
- Bitcoin trades at $84,055 (-1.77% 24h) with a $1.69T market cap as of October 7, 2026
- 30-day exchange netflow SMA sits at -3.12K BTC — persistently negative, per @Alphractal
- Analyst explicitly warns: negative netflow is NOT a direct price appreciation signal
- Watch the 30-day SMA for a reversal toward zero — the first sign the accumulation dynamic is shifting
Bitcoin is trading at $84,055 — down 1.77% over the past 24 hours — with a market capitalization of approximately $1.69 trillion. Beneath the short-term price softness, one structural on-chain metric is telling a different story: the 30-day moving average of Bitcoin’s exchange netflow has remained deeply negative, sitting at -3.12K BTC as of October 7, 2026.
That reading was flagged by on-chain analytics account @Alphractal, which notes that “more BTC has been leaving exchanges than entering them recently” — and is careful to draw an important distinction before drawing any conclusion. The signal text explicitly states: “Negative netflows should not be interpreted as a direct signal for price appreciation.” That caveat is as important as the data itself.
What Exchange Netflow Actually Measures
Exchange netflow is the difference between BTC flowing onto exchanges and BTC flowing off exchanges over a given period. When the reading is negative, more Bitcoin is leaving exchange wallets than entering them — typically interpreted as holders withdrawing to self-custody rather than positioning to sell. The 30-day moving average smooths out daily noise and isolates the sustained directional trend in exchange supply.
The chart shared by @Alphractal shows the 30-day SMA of this metric spanning from approximately 2018 through October 2026. The Y-axis netflow readings range from a peak of +6.8K to a trough near -7.59K. The current reading of -3.12K sits in the lower half of that historical range, indicating a persistent and meaningful supply withdrawal from exchange venues — not a brief one-day anomaly.
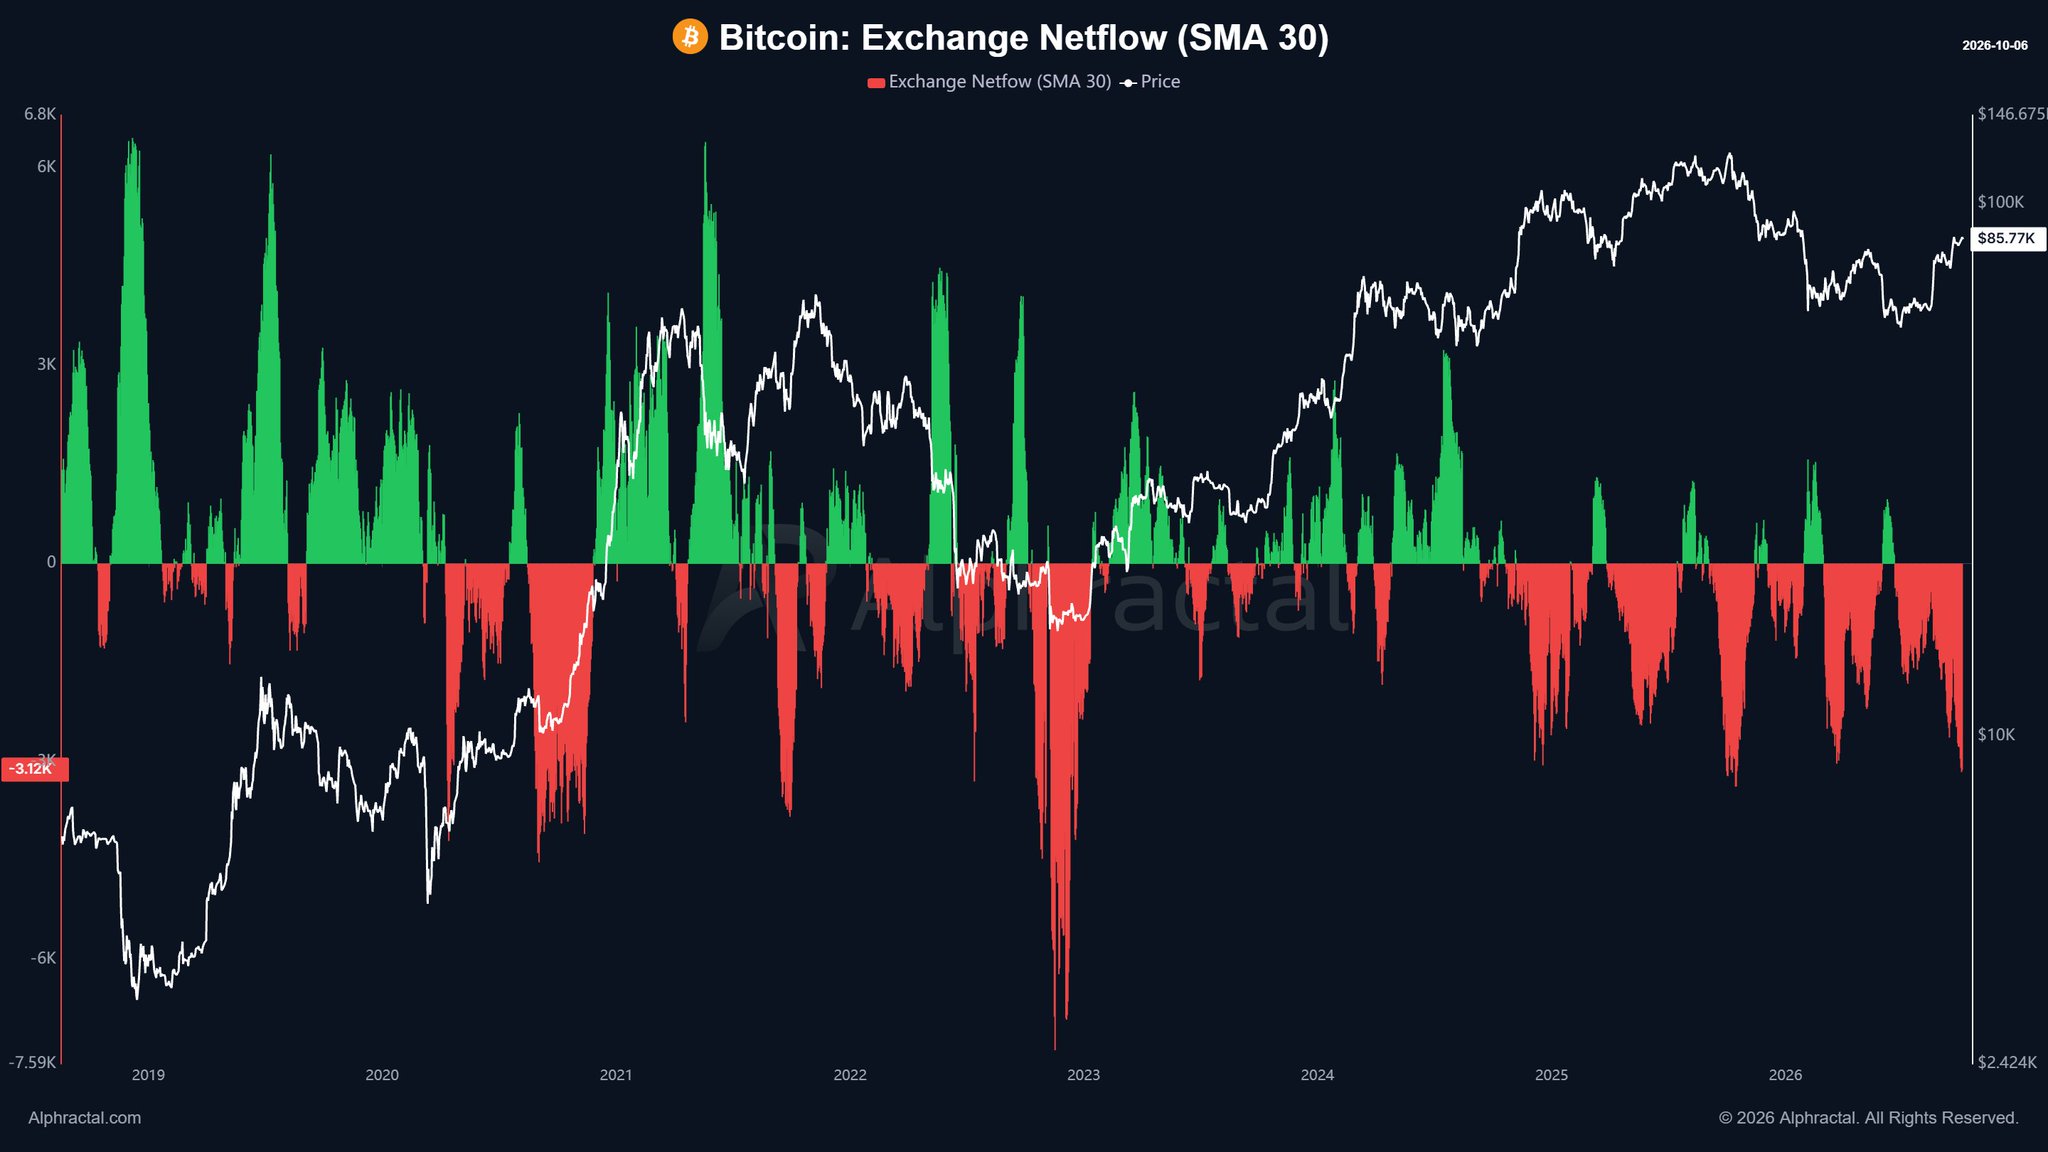
The long-term price line overlaid on the chart trends upward over the same span, while netflow has remained predominantly negative in recent periods. Positive inflow spikes do appear intermittently across the chart — but they are shorter-lived and smaller in magnitude relative to the sustained outflow trend currently in place.
What Persistent Negative Netflow Does — and Does Not — Confirm
@Alphractal is explicit: a negative netflow reading is not a purchase signal. The mechanism it confirms is supply reduction on trading venues. When BTC leaves exchanges in large volumes over sustained periods, the float available for immediate sale shrinks. That reduces the liquid sell-side supply on order books — which is a structural condition, not a directional prediction.
What it does confirm: holders are withdrawing BTC to cold storage or self-custody at a rate that exceeds new deposits. This is consistent with a cohort of market participants choosing not to position for near-term liquidation. It reflects conviction, not urgency to sell.
What it does not confirm: that price will rise, when it will rise, or by how much. Negative netflow has also persisted during periods of price consolidation and sideways action. The metric describes the supply environment — not the demand catalyst that would ultimately move price.
For context on where current on-chain sentiment sits more broadly, CryptoQuant’s multi-analyst consensus recently placed BTC at 82.5% bullish across their composite scoring framework — a separate dataset that complements the netflow picture without replacing it.
The Supply Compression Mechanism — Step by Step
The structural logic behind why sustained negative netflow matters runs as follows:
- BTC exits exchanges at a net rate of approximately -3.12K per day (30-day SMA basis)
- Exchange-available float shrinks — fewer coins available for immediate market-order selling
- Sell-side liquidity thins on spot order books across major venues
- Marginal demand — from new buyers, institutions, or ETF inflows — encounters less supply resistance
- Price sensitivity increases — the same demand impulse produces a larger price impact than it would in a high-float environment
This is a conditions-setting mechanism. It does not generate the move — but it determines how forcefully the market responds when a demand catalyst does appear. That distinction is what @Alphractal’s note is specifically drawing attention to.
Earlier this year, on-chain data from multiple sources similarly suggested Bitcoin was building toward another $100K attempt — a thesis explored in depth here — with exchange supply compression cited as one of the structural preconditions.
Current Reading in Historical Context
The chart’s Y-axis captures the full historical range of this metric from 2018 to present. At -3.12K BTC, the 30-day SMA sits meaningfully below the zero line — not at the historical extreme of -7.59K, but comfortably in negative territory that has historically corresponded with accumulation phases. The chart’s peak positive reading of +6.8K, by contrast, appeared during periods of elevated sell pressure when participants were depositing heavily to exchanges.
The Bitcoin price line on the same chart is annotated at $85.77K as of the chart’s generation date — the live price at time of writing is $84,055, reflecting the session’s 1.77% decline. The chart’s price axis spans from $2,424 at the low end to $146,675 at the high — providing the full cycle context within which the current netflow reading is being evaluated.
What Would Change This Reading
A sustained reversal of the 30-day SMA toward zero — or into positive territory — would signal a shift: holders beginning to deposit BTC back onto exchanges at scale. That would indicate either profit-taking intent or repositioning for sale, and would represent a meaningful change in the supply dynamic currently in place.
Until that reversal occurs, the structural condition flagged by @Alphractal remains intact: exchange supply is contracting, and the float available to absorb any demand surge is smaller than it was during prior periods of heavy inflow. Macro catalysts remain the variable — historically, Bitcoin has responded sharply to macro events including election cycles, gaining 24.5%, 44.9%, and 92.3% after each of the last three midterms — events where reduced exchange supply amplified the price response.
Bullish Scenario
If a demand catalyst emerges — institutional inflows, ETF volume acceleration, or a macro risk-on trigger — the current thin exchange float means the price response could be disproportionately sharp relative to the demand volume. A sustained hold of the 30-day SMA below -2K BTC would keep this structural condition intact.
Bearish Scenario
If the 30-day netflow SMA reverses toward zero or positive, that signals holders are returning BTC to exchanges at scale — a structural deterioration of the accumulation thesis. The metric to track: DeFiLlama and CryptoQuant’s exchange netflow dashboards update this figure in near real time.
Bitcoin’s exchange netflow remains at -3.12K BTC on a 30-day moving average basis — a sustained supply withdrawal that compresses the float available on trading venues without itself being a price signal. @Alphractal’s note is precise in its scope: this metric describes a structural supply condition, not a directional trigger. The condition is present. Whether a demand catalyst arrives to interact with it — and what form that catalyst takes — is the variable that determines whether the compressed supply environment translates into price. Watch the 30-day SMA: a sustained move toward zero is the first signal that the accumulation dynamic is reversing.
Frequently Asked Questions
What does a negative Bitcoin exchange netflow SMA mean in practice?
Does negative exchange netflow guarantee Bitcoin’s price will go up?
What level of exchange netflow would signal the accumulation trend is reversing?
How does the current -3.12K reading compare to historical extremes?
Source: Alphractal · Published by CoinsProbe Markets Desk
The opinions and market insights shared on CoinsProbe represent the views of individual authors based on prevailing market conditions at the time of publication. Cryptocurrency investments carry significant risk and volatility. Readers are encouraged to conduct their own research and seek professional financial advice before making investment decisions. CoinsProbe and its contributors do not accept responsibility for financial losses or decisions made based on published content.
CoinsProbe may publish sponsored articles, affiliate links, or promotional collaborations. All sponsored material is clearly labeled to maintain transparency with our audience. Our editorial decisions remain fully independent, and advertising partnerships do not influence reviews, rankings, or published opinions.
Since 2023, CoinsProbe has delivered reliable insights on cryptocurrency, blockchain, and digital assets. Our content is created by experienced researchers and analysts who follow strict editorial standards focused on accuracy, transparency, and credibility. Every article is carefully reviewed and verified using trusted sources and current market data. We provide unbiased analysis and timely updates covering everything from emerging crypto projects to major industry developments.