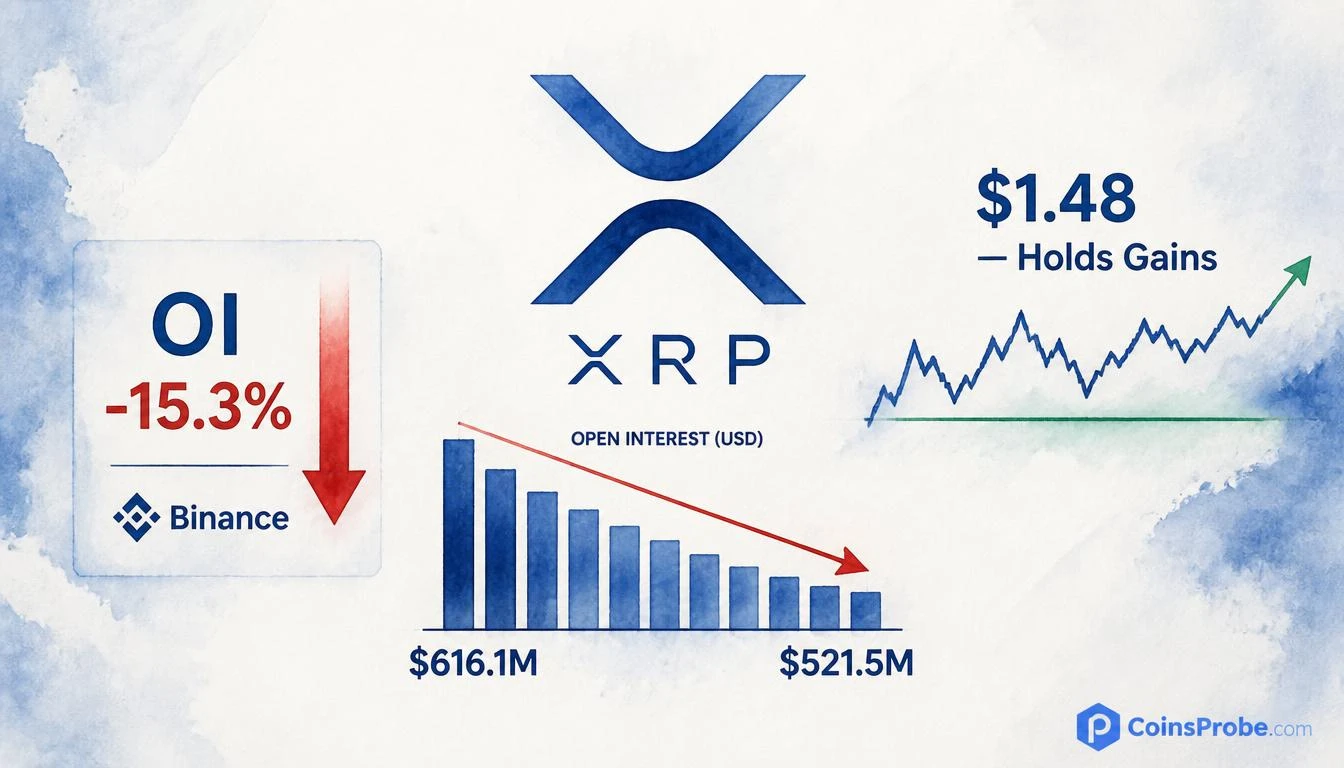
- Binance XRP open interest fell 15.3% from its six-month high, from $616.1 million on September 22 to $521.5 million by September 29.
- Price is only 5.2% below its six-month high near $1.59. Open interest fell about three times as much as price.
- Short liquidations hit $13.70 million on September 21, the six-month high. Since the peak, long liquidations have averaged $3.72 million a day, 2.6 times the six-month mean.
- Leverage has eased from 0.230 to 0.197, but it is still above the six-month mean of 0.169. The flush is underway, not finished.
XRP is trading at $1.48 — down 2.17% in 24 hours — with a market cap of $93.25 billion and $2.9 billion in daily volume. Beneath that routine pullback sits a more consequential data point: Binance open interest has fallen 15.3% from its six-month peak, yet price has surrendered only a fraction of its prior gains. That divergence is the signal.
CryptoQuant analyst @CryptoOnchain flagged the structure in a post shared via @cryptoquant_com: “For now, the clearest reading is that XRP shed leverage while price held most of its gains.” That sentence is doing real analytical work — it distinguishes a healthy deleveraging from a trend breakdown, and the on-chain data supports the distinction.
The OI Structure — What the Numbers Actually Show
Binance XRP open interest peaked at $616.1 million on September 22, 2026, coinciding with a price high of approximately $1.60. As of the time of writing, OI has declined to $521.5 million — a drop of $94.6 million, or 15.3%, over roughly nine days. Price, meanwhile, sits at $1.48 — a decline of just 7.5% from that same September 22 peak.
The asymmetry is what matters. OI fell more than twice as fast as price. That ratio is the structural case @CryptoOnchain is making.
The six-month chart shared via CryptoQuant adds granular context to that picture.
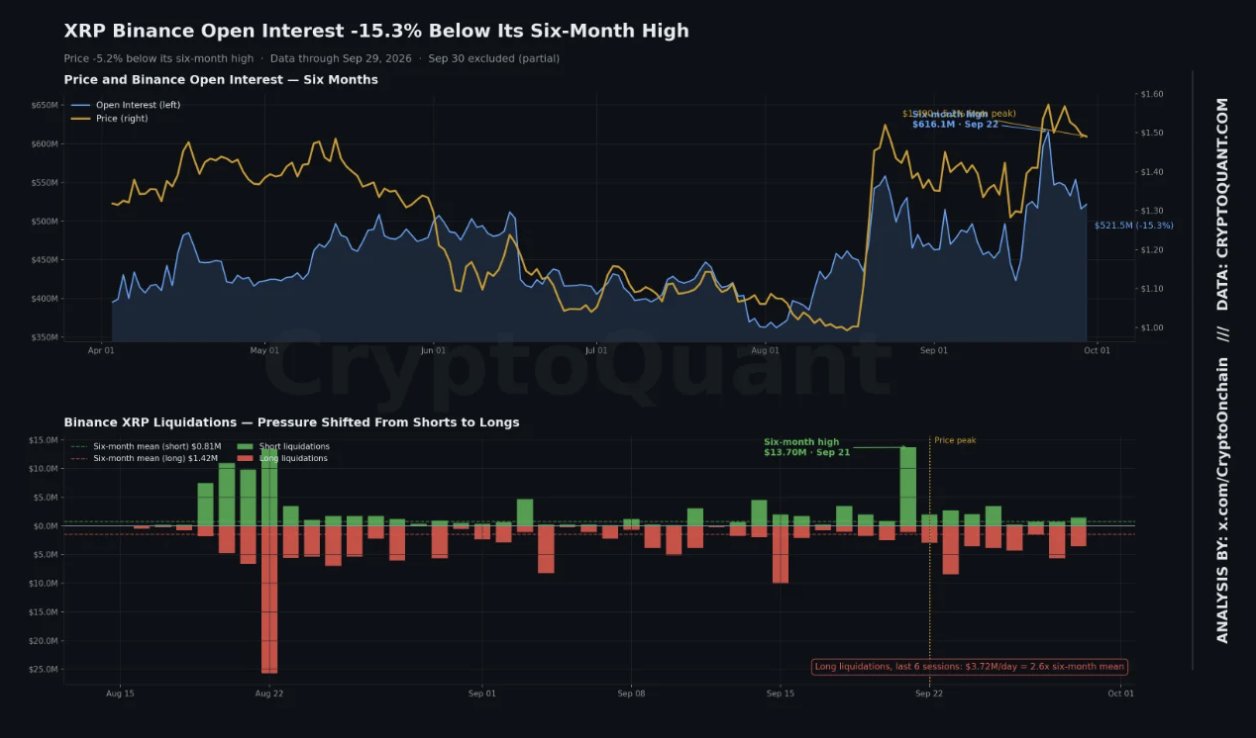
On September 21 — one day before the OI peak — short liquidations spiked to $13.70 million, the highest single-day reading in six months. That is the classic fingerprint of a short squeeze: forced short covering accelerates price upward, OI climbs as new longs pile in at elevated prices. What followed is where the current reading gets its weight: post-peak, long liquidations have been averaging $3.72 million per day — roughly 2.6 times the six-month mean. The pressure has rotated. Shorts were squeezed out; now overleveraged longs are being flushed.
Why This Is Constructive — And Where the Risk Remains
The standard interpretation of falling open interest is bearish — declining OI often signals position liquidation and waning conviction. But that reading requires a price collapse to confirm it. Here, price has not collapsed. XRP gave back 7.5% while OI contracted 15.3%. When leverage exits faster than price falls, the implication is that the underlying demand holding price up is not leveraged — it is spot-driven, or at minimum not dependent on derivatives positioning to sustain itself.
This is the precise distinction @CryptoOnchain is drawing. The move from the August base near $1.20–$1.25 to the September 22 high of $1.60 appears to have been partially amplified by futures leverage. That leverage is now being removed. If the move were purely speculative, price would be tracking OI lower. It is not — which suggests real demand underneath.
The risk is not dismissed, however. Long liquidations running at 2.6 times the six-month average means there are still overleveraged longs in the market. Those positions represent latent selling pressure. @CryptoOnchain’s chart flags $1.45–$1.50 as the zone where that residual overhang is most likely to create friction. XRP is currently sitting at $1.48 — directly inside that range.
For context on XRP’s broader ecosystem development, see What is XRP 2.0: Everything You Need To Know.
The Level That Resolves the Ambiguity
Two price points define the near-term read:
- $1.45 — the near-term support confirmation level. A sustained hold above $1.45 while OI stabilizes or begins recovering would validate the deleveraging-not-distribution thesis. It would mean the flush is complete and organic demand is absorbing the exit.
- $1.25 — the August base. Loss of $1.45 without OI stabilization would put the mid-August accumulation zone back in focus. A retest there would not necessarily invalidate the macro structure, but it would indicate the leverage flush carried more forced selling than the current OI-price divergence implies.
Bullish Scenario — Hold at $1.45 With OI Stabilization
If XRP defends $1.45 and Binance OI stops contracting — or begins recovering from the $521.5M current level — the structure reads as a completed leverage flush with organic demand intact. Prior instances of OI resets from six-month highs in trending assets have preceded continuation moves back toward and through the prior high. That would put the September 22 peak of $1.60 back in scope, with extension potential toward $1.75–$1.80 depending on broader market conditions.
Bearish Scenario — Loss of $1.45 With Continued OI Decline
If long liquidations continue at the current 2.6× pace and price breaks below $1.45, the thesis shifts. What looked like healthy deleveraging would be reclassified as distribution — holders exiting into the derivatives flush rather than holding through it. The $1.20–$1.25 support base from August becomes the first meaningful floor in that scenario.
The Summary Read
XRP Binance open interest has shed $94.6 million — 15.3% — from its six-month peak of $616.1M while price has declined only 7.5% from $1.60 to $1.48. Long liquidations are running at 2.6 times the six-month average, indicating residual overleveraged positioning is still exiting. @CryptoOnchain’s read from CryptoQuant is direct: leverage is being removed, price is holding. That is the constructive interpretation. The test of that interpretation happens at $1.45. If that level holds with OI stabilizing, the data argues for continuation. If it breaks with OI still falling, the leverage flush was hiding a larger unwind. Watch $1.45 — it is the line between a healthy reset and a trend that needs reassessment.
Frequently Asked Questions
Does falling open interest always mean XRP’s price will drop?
What caused the $13.70M short liquidation spike on September 21?
Why are long liquidations at 2.6 times the six-month average significant?
What price level confirms the deleveraging thesis is constructive for XRP?
Source: CryptoQuant · Published by CoinsProbe Markets Desk
The opinions and market insights shared on CoinsProbe represent the views of individual authors based on prevailing market conditions at the time of publication. Cryptocurrency investments carry significant risk and volatility. Readers are encouraged to conduct their own research and seek professional financial advice before making investment decisions. CoinsProbe and its contributors do not accept responsibility for financial losses or decisions made based on published content.
CoinsProbe may publish sponsored articles, affiliate links, or promotional collaborations. All sponsored material is clearly labeled to maintain transparency with our audience. Our editorial decisions remain fully independent, and advertising partnerships do not influence reviews, rankings, or published opinions.
Since 2023, CoinsProbe has delivered reliable insights on cryptocurrency, blockchain, and digital assets. Our content is created by experienced researchers and analysts who follow strict editorial standards focused on accuracy, transparency, and credibility. Every article is carefully reviewed and verified using trusted sources and current market data. We provide unbiased analysis and timely updates covering everything from emerging crypto projects to major industry developments.