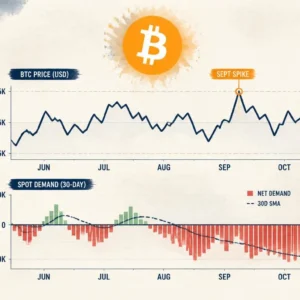

- BTC is trading at $80,890 — up 4.37% in 24 hours and 25.87% over 30 days — with a market cap of ~$1.62 trillion, supported by spot-led demand rather than leverage, per analyst Ali Charts (@alicharts).
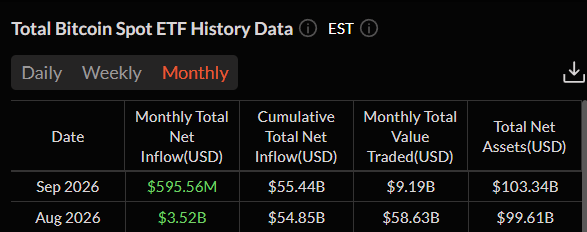
- U.S. Bitcoin spot ETFs have already recorded $595.56 million in September inflows — extending August's $3.52 billion record and pushing total ETF net assets back above $103.34 billion.
- Spot trading volume grew 153% versus 109% for perpetuals, Bitcoin-denominated open interest actually declined as price moved higher, and Binance absorbed $2.63 billion in BTC — confirming this rally is fresh capital, not a leverage squeeze.
Bitcoin’s 25% monthly surge toward $81,000 is being validated by the data underneath the price — and that data is telling a specific and important story. This is not a short squeeze. It is not a leverage-driven pump. According to flow data and analyst Ali Charts (@alicharts), the move is being driven by two simultaneous spot demand engines: institutional capital flowing through ETFs and exchange-level spot buying absorbing billions in BTC without a matching expansion in leveraged open interest.
At the time of writing, BTC is trading at approximately $80,890 — up 4.37% in 24 hours and 25.87% over the past 30 days — with a market capitalization of approximately $1.62 trillion.

September ETF Inflows — Institutional Demand Continues After August’s Record Month
The first signal that August’s institutional demand was not a one-month anomaly comes from the ETF flow data: September has already added $595.56 million in net inflows — and the month is not close to over.
Per SoSoValue monthly data:
| Month | Net ETF Flow |
|---|---|
| June 2026 | -$4.51 billion |
| July 2026 | +$172.43 million |
| August 2026 | +$3.52 billion (strongest of 2026) |
| September 2026 (so far) | +$595.56 million |
| Cumulative Net Inflows | $55.44 billion |
| Total Net Assets | $103.34 billion |
As covered in our BTC spot ETFs pull in $3.5B in August — strongest monthly inflow since July 2025 analysis, August’s $3.52 billion represented the most significant single-month institutional demand reversal of 2026 — following $4.51 billion in June outflows. The key question after that spike was whether institutional demand would sustain or quickly reverse.
September’s $595.56 million in early inflows answers that question: institutional spot demand did not disappear after the August spike. Total ETF net assets have climbed back above $103 billion — recovering a significant portion of the asset base that was eroded during the June–July outflow period and confirming that the structural demand recovery is ongoing rather than a one-month event.
The 25% BTC Rally Was Spot-Led, Not Leverage-Driven
The most analytically important element of the current Bitcoin setup is not the price level — it is what the flow data reveals about the character of the demand driving it.
Analyst Ali Charts (@alicharts) analyzed the mechanics behind Bitcoin’s recent breakout and reached a conclusion that materially changes how the rally should be interpreted:
“Bitcoin’s recent breakout was a spot-led move, not a derivatives squeeze.”
The Four Data Points That Confirm Spot Leadership
1. Spot volume grew faster than perpetuals:
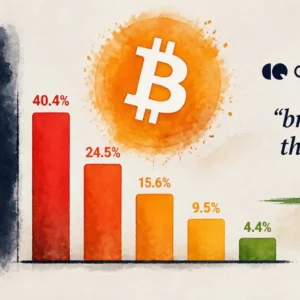
Spot trading volume increased 153% during the rally period. Perpetual futures volume grew 109%. The gap — 44 percentage points of outperformance by spot versus perpetuals — indicates that the marginal buyer driving the move was purchasing actual BTC rather than leveraged exposure.
2. Spot-to-perpetual ratio compressed:
The spot-to-perpetual volume ratio moved from 6.02x to 4.97x — meaning spot volume declined as a share of total volume relative to perpetuals, but the absolute growth in spot volume still outpaced perpetuals. This reflects a market where both spot and derivatives activity increased, but spot demand was the primary driver of the directional move.
3. ETF inflows turned positive before the breakout:
Institutional demand through ETFs began flowing in before Bitcoin’s price broke higher — not after. Capital preceding price is the behavioral signature of accumulation rather than momentum chasing. This sequencing is structurally more constructive than ETF inflows that appear only after a price move has already begun.
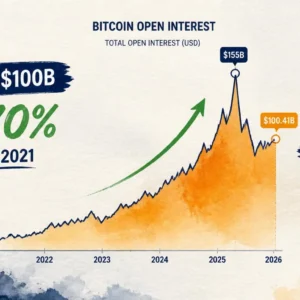
4. Bitcoin-denominated open interest declined as price moved higher:
This is the single most definitive indicator that the move was not leverage-driven. In a short squeeze or leverage-fueled pump, open interest rises as price rises — more positions are being opened. In the current setup, BTC-denominated open interest declined even as price moved higher — meaning existing leveraged positions were closing or being reduced rather than expanding. The price move was being driven by spot buying, not by increasing derivatives exposure.
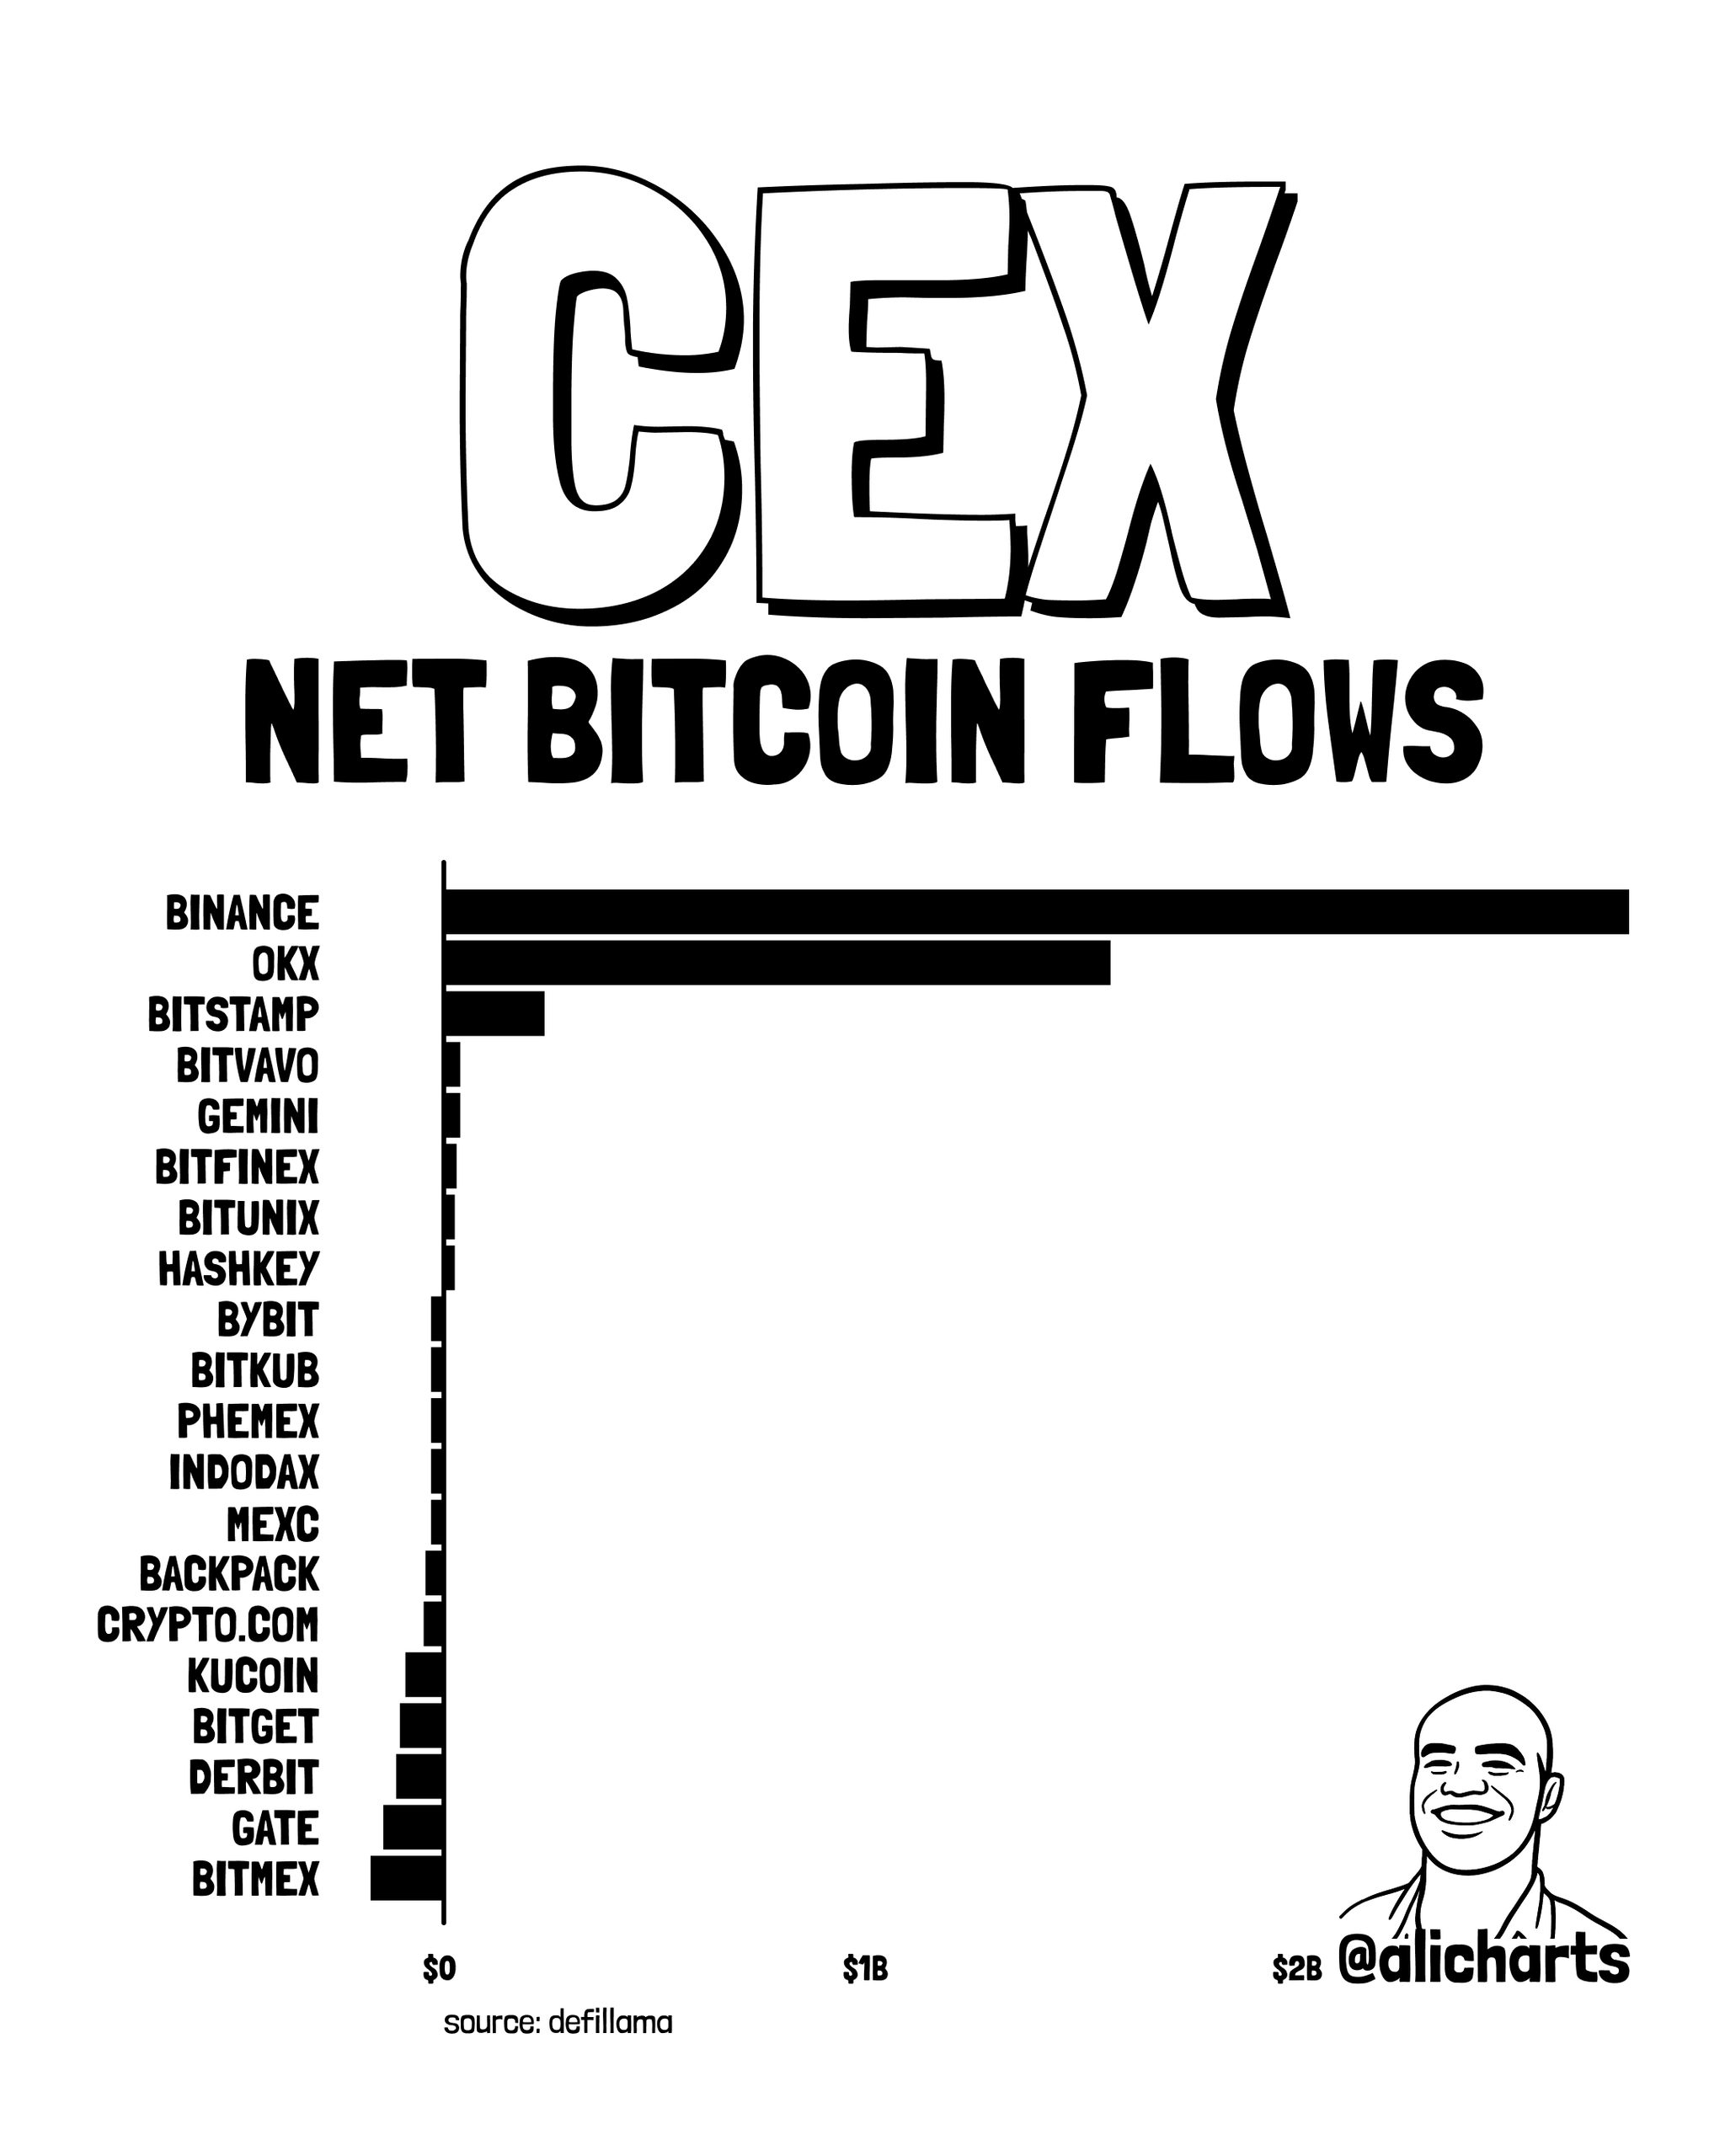
Binance Absorbs $2.63 Billion in BTC — Almost Matching Total U.S. ETF Inflows
The exchange-level flow data adds the most concrete quantification of the spot demand behind the rally.
Binance added approximately $2.63 billion in BTC balances during the move — a figure that represents almost as much as the $3.05 billion that flowed into all U.S. spot Bitcoin ETFs over the same period. This parallel between Binance inflows and ETF inflows is remarkable: two separate, structurally different demand channels were absorbing comparable amounts of BTC during the same rally window.
Binance’s Dominant Market Position
The Binance flow data is further contextualized by the exchange’s market share during the rally period:
- Only tracked exchange averaging more than $10 billion in daily spot volume
- Accounted for nearly 46% of spot volume across all exchanges analyzed
At 46% of total spot volume, Binance’s $2.63 billion BTC absorption is not a niche data point — it represents the single largest venue-level demand signal available in the spot market. When the exchange responsible for nearly half of all spot volume is absorbing billions in BTC without a corresponding surge in leveraged open interest, the structural demand signal is as clean as the spot market can produce.
The Exchange Flow Picture
The CEX net-flow chart reinforces the Binance signal: Binance and OKX absorbed the largest Bitcoin inflows, while most other venues saw much smaller changes. The concentration of inflows at the two largest spot exchanges — rather than being distributed across derivatives-heavy venues — is consistent with the spot-led character of the demand Ali Charts identified.
Why Spot-Led Demand Is More Constructive Than a Short Squeeze
The distinction between spot-led demand and leverage-driven price action matters for assessing whether the current Bitcoin rally has durability.
Short squeeze rallies are mechanically amplified by forced buying — short positions being closed involuntarily, creating temporary upward pressure that fades once the squeeze is complete. The price move can be dramatic but is inherently self-limiting: once the shorts are closed, the forced buying stops and the underlying demand must be sufficient to sustain the higher price level.
Spot-led rallies reflect genuine capital deployment — real buyers acquiring and holding BTC rather than temporarily closing leveraged positions. Spot demand creates actual changes in the Bitcoin supply distribution: more BTC moves from short-term to long-term holders, less is available for immediate sale, and the bid-side of the market strengthens structurally rather than temporarily.
The current setup — 153% spot volume growth, declining BTC-denominated open interest, $2.63 billion in Binance BTC absorption, and $595.56 million in September ETF inflows — describes a rally with the structural characteristics of genuine demand rather than mechanical short-covering.
As covered in our CryptoQuant Bitcoin bear cycle declared over analysis and Bitcoin 1,130-day SMA reclaim breakdown, the macro and on-chain framework around Bitcoin’s current structure has been consistently pointing toward a genuine regime transition rather than a temporary bounce. The spot demand data now provides the flow-level confirmation of that thesis.
What to Watch — The Key Tests Ahead
September ETF inflow trajectory: The $595.56 million already recorded in early September is constructive — but the monthly total will be the key data point. A full September above $1 billion would confirm that institutional demand has genuinely sustained. A sharp reversal to outflows would raise questions about whether August’s inflows were front-loaded around the specific macro catalysts (Treasury buyback, White House summit) rather than structurally durable.
BTC-denominated open interest: If open interest begins rising sharply as price continues higher, the character of the demand is shifting from spot-led to leverage-driven — increasing the risk of a squeeze-driven correction. Sustained flat or declining open interest while price moves higher would confirm the spot-led character of the rally is persisting.
$83,000 — the 365-day MA: As identified in our CryptoQuant bull market analysis, a sustained weekly close above the 365-day moving average at approximately $83,000 is the final confirmation threshold for a fully validated new bull market. At $80,890, Bitcoin is approximately 2.6% below that level — within a single session’s move of the confirmation close.
Bottom Line
Bitcoin’s 25.87% monthly rally toward $81,000 is supported by the most structurally sound demand data the current recovery has produced. 153% spot volume growth versus 109% for perpetuals, declining BTC-denominated open interest as price moved higher, $2.63 billion absorbed by Binance, and $595.56 million in September ETF inflows continuing after August’s $3.52 billion record — all pointing to the same conclusion: this is fresh capital entering the market, not a leverage squeeze unwinding.
The next test is whether this spot demand holds as price pushes toward and potentially above $83,000 — the 365-day moving average that remains the sole remaining confirmation level for a fully validated Bitcoin bull market. The data underneath the current rally is the most constructive argument that it will.
Frequently Asked Questions
Was Bitcoin’s recent rally driven by leverage?
No. Analyst says spot volume grew 153% versus 109% for perpetuals, while Bitcoin-denominated open interest declined as price moved higher.
How much have Bitcoin spot ETFs added in September 2026?
U.S. spot Bitcoin ETFs have taken in about $595.56 million so far in September, after $3.52 billion in August.
The opinions and market insights shared on CoinsProbe represent the views of individual authors based on prevailing market conditions at the time of publication. Cryptocurrency investments carry significant risk and volatility. Readers are encouraged to conduct their own research and seek professional financial advice before making investment decisions. CoinsProbe and its contributors do not accept responsibility for financial losses or decisions made based on published content.
CoinsProbe may publish sponsored articles, affiliate links, or promotional collaborations. All sponsored material is clearly labeled to maintain transparency with our audience. Our editorial decisions remain fully independent, and advertising partnerships do not influence reviews, rankings, or published opinions.
Since 2023, CoinsProbe has delivered reliable insights on cryptocurrency, blockchain, and digital assets. Our content is created by experienced researchers and analysts who follow strict editorial standards focused on accuracy, transparency, and credibility. Every article is carefully reviewed and verified using trusted sources and current market data. We provide unbiased analysis and timely updates covering everything from emerging crypto projects to major industry developments.