
- Bitcoin trades at $82,364 (+0.54% 24h), $1.655T market cap — CryptoQuant flags possible bottom forming
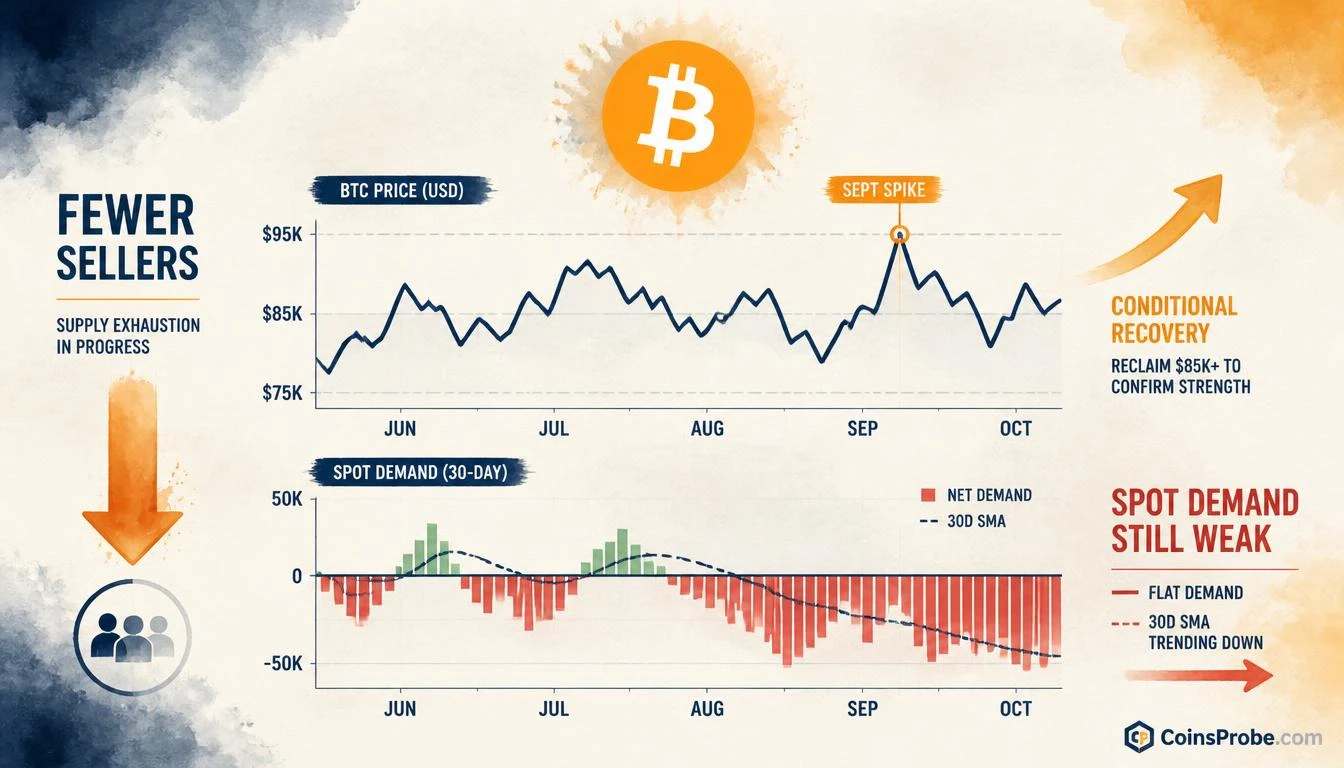
- @xwinfinance: 'fewer sellers' phase underway, but 30-day spot demand bars remain predominantly negative/red
- SMA(90) on 1-year apparent demand is still curving downward — sustained rally requires demand confirmation
- Watch CryptoQuant's 30-day apparent demand bars: must turn and hold green before bottom is confirmed
Bitcoin is trading at $82,364 — up 0.54% in the past 24 hours — with a market capitalization of approximately $1.655 trillion. The price action, however, is not the story. The story is what CryptoQuant’s on-chain data reveals about the structural condition underneath it: selling pressure is easing, but the buyers have not yet arrived in force.
That is the precise conclusion published on October 20, 2026 by CryptoQuant analyst @xwinfinance, shared via the official @cryptoquant_com account. The analyst’s exact words: “The market is progressing from ‘fewer sellers’ toward a possible bottom, but a sustained rally still needs stronger spot demand.” This is not a bullish declaration. It is a sequenced, conditional diagnosis — and the distinction matters.
Signal 1 — Fewer Sellers: What It Means and What It Doesn’t
“Fewer sellers” is a specific on-chain condition, not a sentiment description. It means the rate of Bitcoin moving from long-term holder wallets to exchange deposit addresses — a proxy for realized selling intent — has declined measurably. When supply-side pressure exhausts itself, price stabilizes. That stabilization is the foundation of every major bottom in Bitcoin’s history.
But exhaustion of sellers is not the same as arrival of buyers. The distinction is critical. A market with no sellers and no buyers is a market in suspension, not a market in recovery. @xwinfinance’s framing — “progressing from fewer sellers toward a possible bottom” — is explicitly sequential. Step one (selling pressure reduction) appears to be underway. Step two (demand re-entry) has not been confirmed.
This reading is consistent with what CryptoQuant’s chart data shows across the January–October 2026 period. For context on how holder behavior feeds into this kind of analysis, only 4.4% of BTC’s 6–12 month holders are currently selling — a figure that reinforces the supply-side compression @xwinfinance is identifying.
Signal 2 — Spot Demand Remains Weak: The Missing Ingredient
The CryptoQuant chart shared in the post tracks Bitcoin’s 1-year apparent demand (blue area) and 30-day spot demand bars alongside price through 2026. The visual is unambiguous: the 30-day bars are predominantly red — negative — across the majority of the year. Only brief green clusters appeared around August and September before retreating. The SMA(90) on the demand metric has curved downward throughout the period, confirming this is not a short-term fluctuation but a sustained structural contraction in spot buying activity.
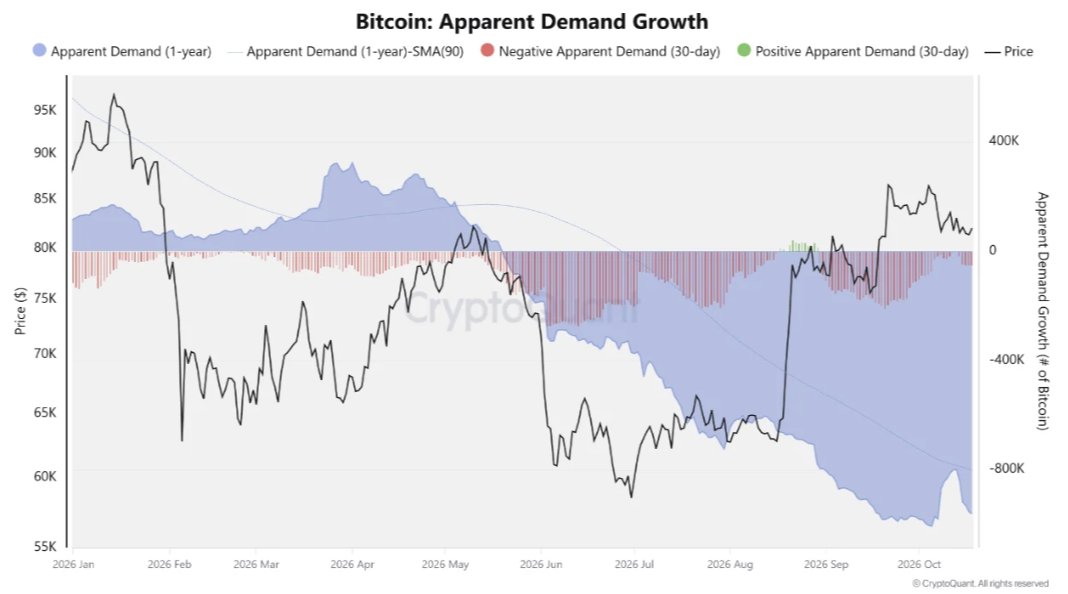
Apparent demand — as CryptoQuant defines it — measures net Bitcoin absorption across spot markets. When it trends negative for an extended period, it signals that new capital is not entering the market at a rate sufficient to offset distribution. The brief demand recovery in August–September that the chart shows did not sustain. The SMA(90) remained pointed downward even as price staged a sharp spike in September.
This is the analytical core of @xwinfinance’s note: a price spike without demand confirmation is not a trend reversal. It is a relief rally operating in a demand vacuum — and relief rallies in demand vacuums reverse.
The Sequencing: Why “Possible Bottom” Is Not “Confirmed Bottom”
@xwinfinance uses the phrase “possible bottom” deliberately. In CryptoQuant’s analytical framework, a confirmed bottom requires both conditions to align: supply-side exhaustion AND demand-side re-entry. The chart shows the first condition progressing. The second remains absent.
This two-condition requirement is not a minor caveat. It is the difference between a dead-cat bounce and the beginning of a new trend leg. Bitcoin’s recovery in October has faced multiple unmet conditions — and the spot demand gap is among the most structurally significant of them.
The metric to watch is straightforward: CryptoQuant’s 30-day spot demand bars need to turn and hold green — not for one session, but on a sustained basis with the SMA(90) beginning to curl upward. Until that happens, @xwinfinance’s framing is accurate: the market is building toward a possible bottom, not confirming one.
What the Chart Shows vs. What It Confirms
The January–October 2026 price chart reveals a sequence that is common at major bottoms: a sharp initial decline from the January peak, a partial mid-year recovery, a second leg down through June–August, then a sharp September spike followed by retreat. That pattern — declining lows with a failed spike — is consistent with late-stage distribution resolving into accumulation. But the demand data does not yet confirm the accumulation phase has begun in earnest.
The price axis shows Bitcoin oscillating in a range roughly between $75,000 and $95,000 across the visible period, with the most recent price at $82,364 sitting toward the lower half of that range. The demand axis shows the 1-year apparent demand figure still deeply negative, with the most recent 30-day bars failing to sustain positive territory. The gap between price stabilization and demand recovery is the exact gap @xwinfinance is flagging.
For broader context on how derivatives positioning interacts with this kind of structural demand analysis, see Crypto Open Interest Up 570% Since 2021 — What $100B in Derivatives Means.
Bullish and Bearish Scenarios
Bullish Scenario
If 30-day spot demand bars turn consistently green and the SMA(90) on apparent demand begins to inflect upward, @xwinfinance’s “possible bottom” thesis advances toward confirmation. In that scenario, the supply-demand structure that typically precedes sustained Bitcoin rallies would be in place, and the current price range near $82,364 would represent a late-stage accumulation zone.
Bearish Scenario
If spot demand remains negative and the SMA(90) continues its downward trajectory, the absence of buyers means any near-term price strength remains at risk of reversal. A demand structure that fails to recover would invalidate the bottom formation thesis and suggest the market has further work to do on the downside before genuine absorption occurs.
Bitcoin at $82,364 is sitting at a structurally important juncture: selling pressure is measurably easing per CryptoQuant’s on-chain data, but spot demand — as tracked by the 1-year apparent demand metric and 30-day bars in @xwinfinance’s analysis — remains predominantly negative. The analyst’s conclusion is conditional, not declarative: a bottom is possible, a sustained rally requires demand confirmation that has not yet arrived. The metric to watch is CryptoQuant’s 30-day apparent demand bars — specifically, whether they establish and hold positive readings with the SMA(90) inflecting upward. Until that condition is met, the on-chain data supports caution over conviction. Watch spot demand as the one variable that separates a possible bottom from a confirmed one.
Source: x.comFrequently Asked Questions
What does ‘fewer sellers’ mean on Bitcoin’s on-chain data?
What is CryptoQuant’s ‘1-year apparent demand’ metric and what is it showing right now?
What specific condition must be met before @xwinfinance’s bottom thesis is confirmed?
Is Bitcoin’s September 2026 price spike a sign of a new bull trend?
Source: CryptoQuant · Published by CoinsProbe Markets Desk
The opinions and market insights shared on CoinsProbe represent the views of individual authors based on prevailing market conditions at the time of publication. Cryptocurrency investments carry significant risk and volatility. Readers are encouraged to conduct their own research and seek professional financial advice before making investment decisions. CoinsProbe and its contributors do not accept responsibility for financial losses or decisions made based on published content.
CoinsProbe may publish sponsored articles, affiliate links, or promotional collaborations. All sponsored material is clearly labeled to maintain transparency with our audience. Our editorial decisions remain fully independent, and advertising partnerships do not influence reviews, rankings, or published opinions.
Since 2023, CoinsProbe has delivered reliable insights on cryptocurrency, blockchain, and digital assets. Our content is created by experienced researchers and analysts who follow strict editorial standards focused on accuracy, transparency, and credibility. Every article is carefully reviewed and verified using trusted sources and current market data. We provide unbiased analysis and timely updates covering everything from emerging crypto projects to major industry developments.