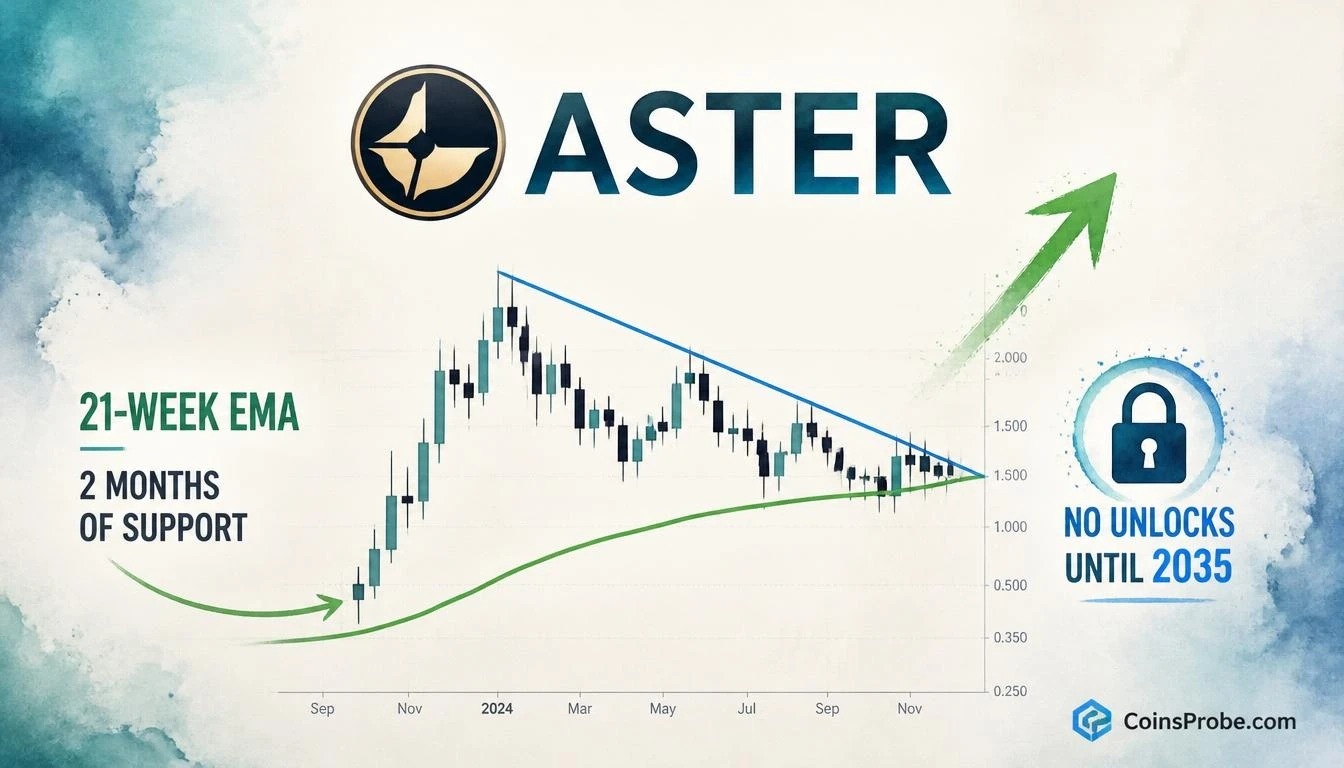

- ASTER trading at $0.7147, holding the 21-Week EMA as support for two consecutive months per @CryptoBullet1
- No significant token unlock events scheduled until 2035 — eliminating near-term dilution sell pressure
- Pattern still forming: weekly close above descending resistance trendline is the confirmation trigger; 21-Week EMA near $0.7147 is the invalidation line
ASTER is trading at approximately $0.7147, consolidating beneath a descending resistance trendline while holding the 21-Week Exponential Moving Average as support — a structure that analyst @CryptoBullet1 identifies as a compelling watch setup. The combination of two months of EMA defense and a near-zero near-term unlock schedule is what separates this consolidation from ordinary sideways action.
In a post dated October 29, 2026, crypto analyst @CryptoBullet1 flagged the setup directly: “I’m watching $ASTER here. I like that it’s been holding the 21-Week EMA as Support for 2 months now. No significant token unlocks until 2035.” The note is brief but structurally precise — it combines a technical anchor (the EMA) with a supply-side fundamental (unlock schedule) that removes one of the most common reasons an asset fails to sustain a breakout.
Signal 1 — 21-Week EMA Held as Support for Two Consecutive Months
The 21-Week EMA is a medium-term trend filter commonly used to separate assets in recovering uptrends from those in distribution phases. It is not an oscillator — it does not measure momentum or overbought conditions. It tracks the average closing price across the past 21 weeks, weighted toward recent closes, giving it a curved, dynamic quality that responds to sustained price behavior rather than short-term noise.
What @CryptoBullet1 highlights is not a single touch of the EMA — it is two months of continuous price defense at that level. Every weekly close for approximately eight consecutive weeks has occurred at or above the 21-Week EMA. That is the market’s way of stating that sellers at current levels are being absorbed. A single wick into EMA support is noise. Two months of sustained holds is structure.
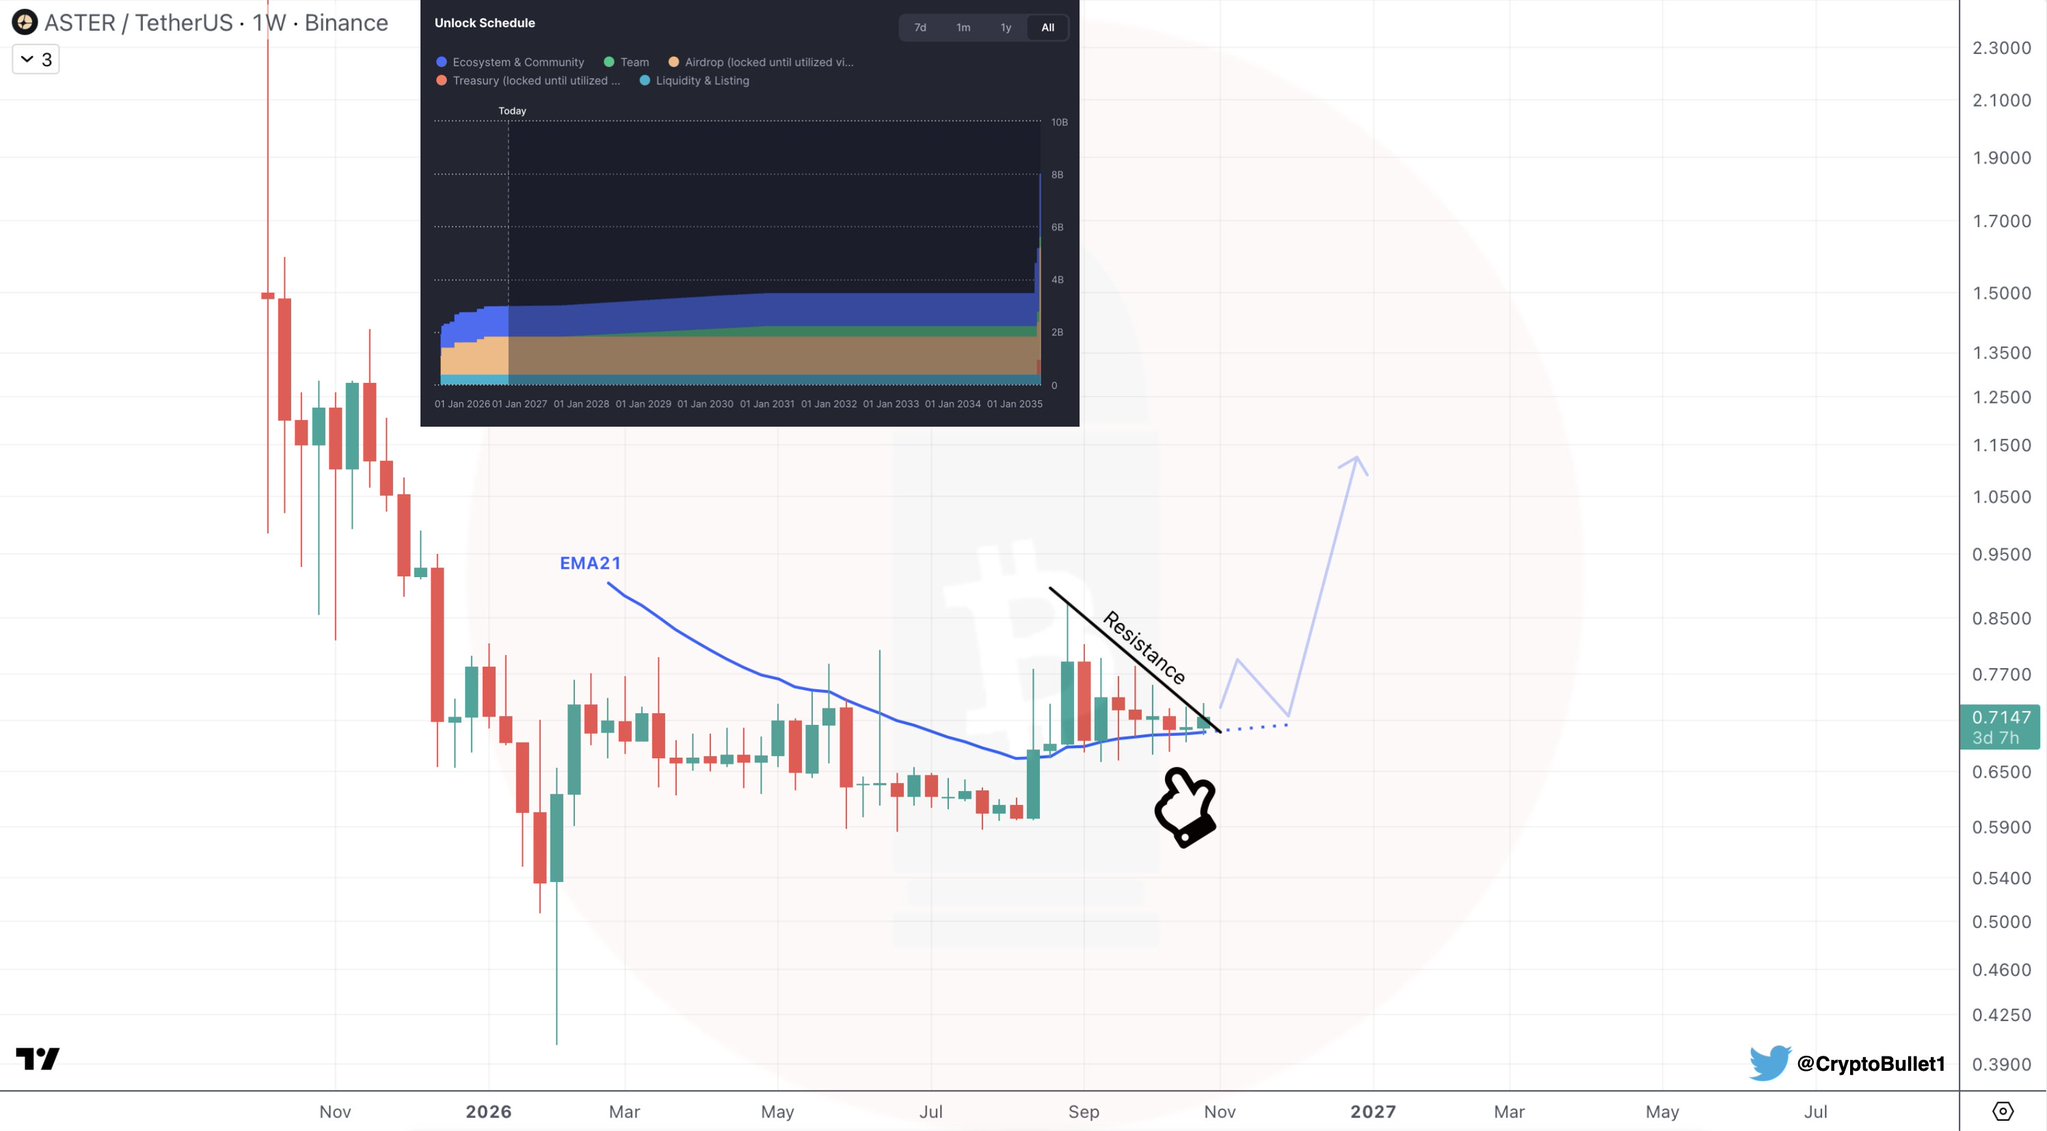
The weekly chart shows price consolidating beneath a descending resistance trendline that has been in place since ASTER’s prior high. The EMA21 curves upward beneath price, acting as a rising floor. The pattern is still forming — no breakout above the descending trendline has been confirmed — but the setup is one of compression: price is being squeezed between rising EMA support below and descending resistance above. The projected resolution, as annotated on the chart, points sharply higher into 2027 if resistance yields.
Signal 2 — No Significant Token Unlocks Until 2035
Token unlocks are one of the most predictable sources of forced sell pressure in crypto markets. When a project has scheduled vesting events — for team allocations, early investors, or ecosystem grants — those recipients frequently sell at unlock, creating overhead supply regardless of market conditions or fundamentals.
@CryptoBullet1’s note states explicitly: no significant token unlocks until 2035. That is approximately nine years of supply-side clarity. For an asset currently consolidating beneath resistance, the absence of scheduled unlock pressure means any breakout attempt does not face an embedded calendar headwind. Buyers do not need to price in dilution risk. The float at current levels is stable.
This is structurally different from the typical mid-cap altcoin setup, where a bullish technical pattern exists simultaneously with a six- or twelve-month unlock cliff that caps the rally. Here, the technical setup and the supply schedule are aligned rather than in conflict. For context on how unlock schedules interact with price action in other assets, see our analysis on AVAX’s long-term support retest and liquidity structure.
The Combined Setup — Compression With Structural Tailwinds
Individually, each signal has limited predictive power. An asset holding its EMA for two months could simply be in slow bleed. An asset with no unlocks until 2035 could still see its float sold aggressively by existing holders. But together, these two signals describe a specific condition: an asset holding technical structure without the supply-side pressure that typically prevents breakouts from sustaining.
The weekly chart confirms the compression structure is intact. Price at $0.7147 remains below the descending resistance trendline, with the 21-Week EMA curving upward beneath it. The pattern requires a confirmed weekly close above the descending trendline to shift from forming to resolved. Until that close materializes, the setup is a watch — not a confirmed breakout.
The engagement data on @CryptoBullet1’s post — 6,400 views with 33 likes and 6 replies — reflects early-stage attention rather than crowded consensus. Setups that attract broad agreement at formation rarely deliver the upside they advertise. This one has not yet attracted that crowd, which is consistent with the pattern still being in its compression phase.
Bullish Scenario
A sustained weekly close above the descending resistance trendline — currently converging near the $0.75–$0.85 zone based on chart structure — would confirm a breakout from two months of EMA-supported compression. With no unlock pressure through 2035, any momentum that develops post-breakout faces minimal structural supply headwind, consistent with the chart’s projected trajectory toward higher levels in 2027.
Bearish Scenario
A weekly close below the 21-Week EMA — currently near $0.7147 — would invalidate two months of support structure and shift the pattern from compression to breakdown. Loss of the EMA on a weekly closing basis is the line @CryptoBullet1’s thesis requires to remain intact.
ASTER’s setup is defined by two months of 21-Week EMA support and no meaningful supply unlock events through 2035 — a combination that removes two of the most common failure modes for altcoin breakout setups. The descending resistance trendline remains intact, the pattern has not yet resolved, and a sustained weekly close above resistance is the confirmation event the chart requires. The 21-Week EMA near $0.7147 is the line traders are watching to the downside.
Frequently Asked Questions
What is the 21-Week EMA and why does it matter for ASTER?
What does ‘no significant token unlocks until 2035’ mean for ASTER’s price?
Has ASTER broken out above resistance yet?
What price level would invalidate @CryptoBullet1’s bullish thesis on ASTER?
Source: Cryptobullet1 · Published by CoinsProbe Markets Desk
The opinions and market insights shared on CoinsProbe represent the views of individual authors based on prevailing market conditions at the time of publication. Cryptocurrency investments carry significant risk and volatility. Readers are encouraged to conduct their own research and seek professional financial advice before making investment decisions. CoinsProbe and its contributors do not accept responsibility for financial losses or decisions made based on published content.
CoinsProbe may publish sponsored articles, affiliate links, or promotional collaborations. All sponsored material is clearly labeled to maintain transparency with our audience. Our editorial decisions remain fully independent, and advertising partnerships do not influence reviews, rankings, or published opinions.
Since 2023, CoinsProbe has delivered reliable insights on cryptocurrency, blockchain, and digital assets. Our content is created by experienced researchers and analysts who follow strict editorial standards focused on accuracy, transparency, and credibility. Every article is carefully reviewed and verified using trusted sources and current market data. We provide unbiased analysis and timely updates covering everything from emerging crypto projects to major industry developments.