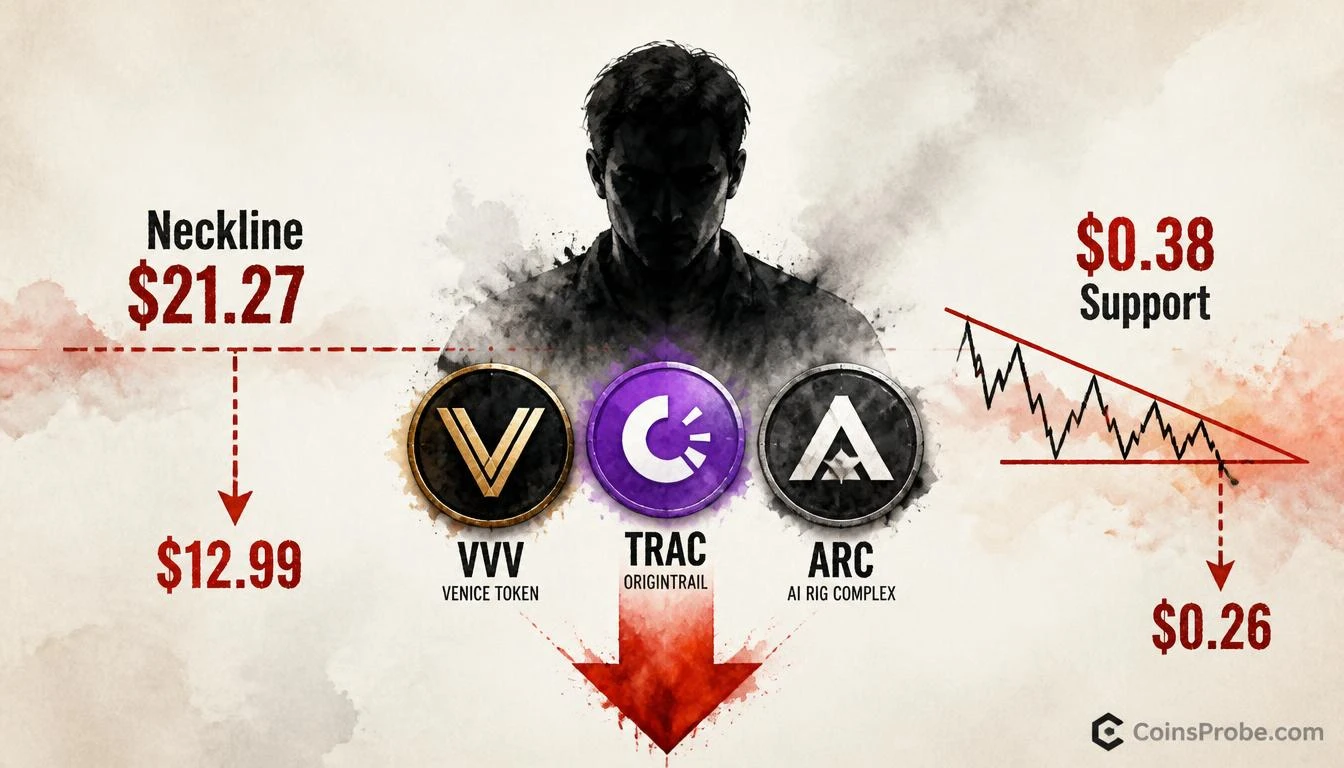

- VVV forming head-and-shoulders with neckline at $21.27 — 4H close below targets $12.99 and $10.74 per @alicharts
- TRAC descending triangle compressing toward $0.38 support — 4H close below triggers retracement to $0.26
- ARC bounced from $0.030 channel floor to $0.059 mid-range — daily close below $0.030 opens $0.014 or $0.0075
- All three patterns remain unconfirmed as of Oct 24, 2026 — confirmation requires specific 4H or daily closes
Three AI agent altcoins — Venice Token ($VVV), OriginTrail ($TRAC), and AI Rig Complex ($ARC) — are simultaneously flashing bearish technical setups that chart analyst Ali Charts (@alicharts) describes with a blunt verdict: “AI Agent Altcoins in Big Trouble.” Published on October 24, 2026, the five-part thread identifies distinct reversal and breakdown patterns across all three assets, each with specific trigger levels and downside targets.
This is not a broad altcoin bearish call. Each token carries its own independent pattern with its own confirmation threshold. None has confirmed a breakdown at the time of writing — but all three are sitting at or approaching critical levels where the next 4-hour or daily candle close becomes decisive.
Signal 1 — Venice Token ($VVV): Head and Shoulders Near the Neckline
The most structurally defined setup in the thread belongs to VVV. Ali Charts identifies a textbook head-and-shoulders pattern forming on the 4-hour chart, with the neckline sitting near $21.27. The pattern features a left shoulder, a higher central peak (the head), and a right shoulder that appears complete — with price currently trading at approximately $24.42, sitting above the neckline but below the right shoulder resistance near $27.97.
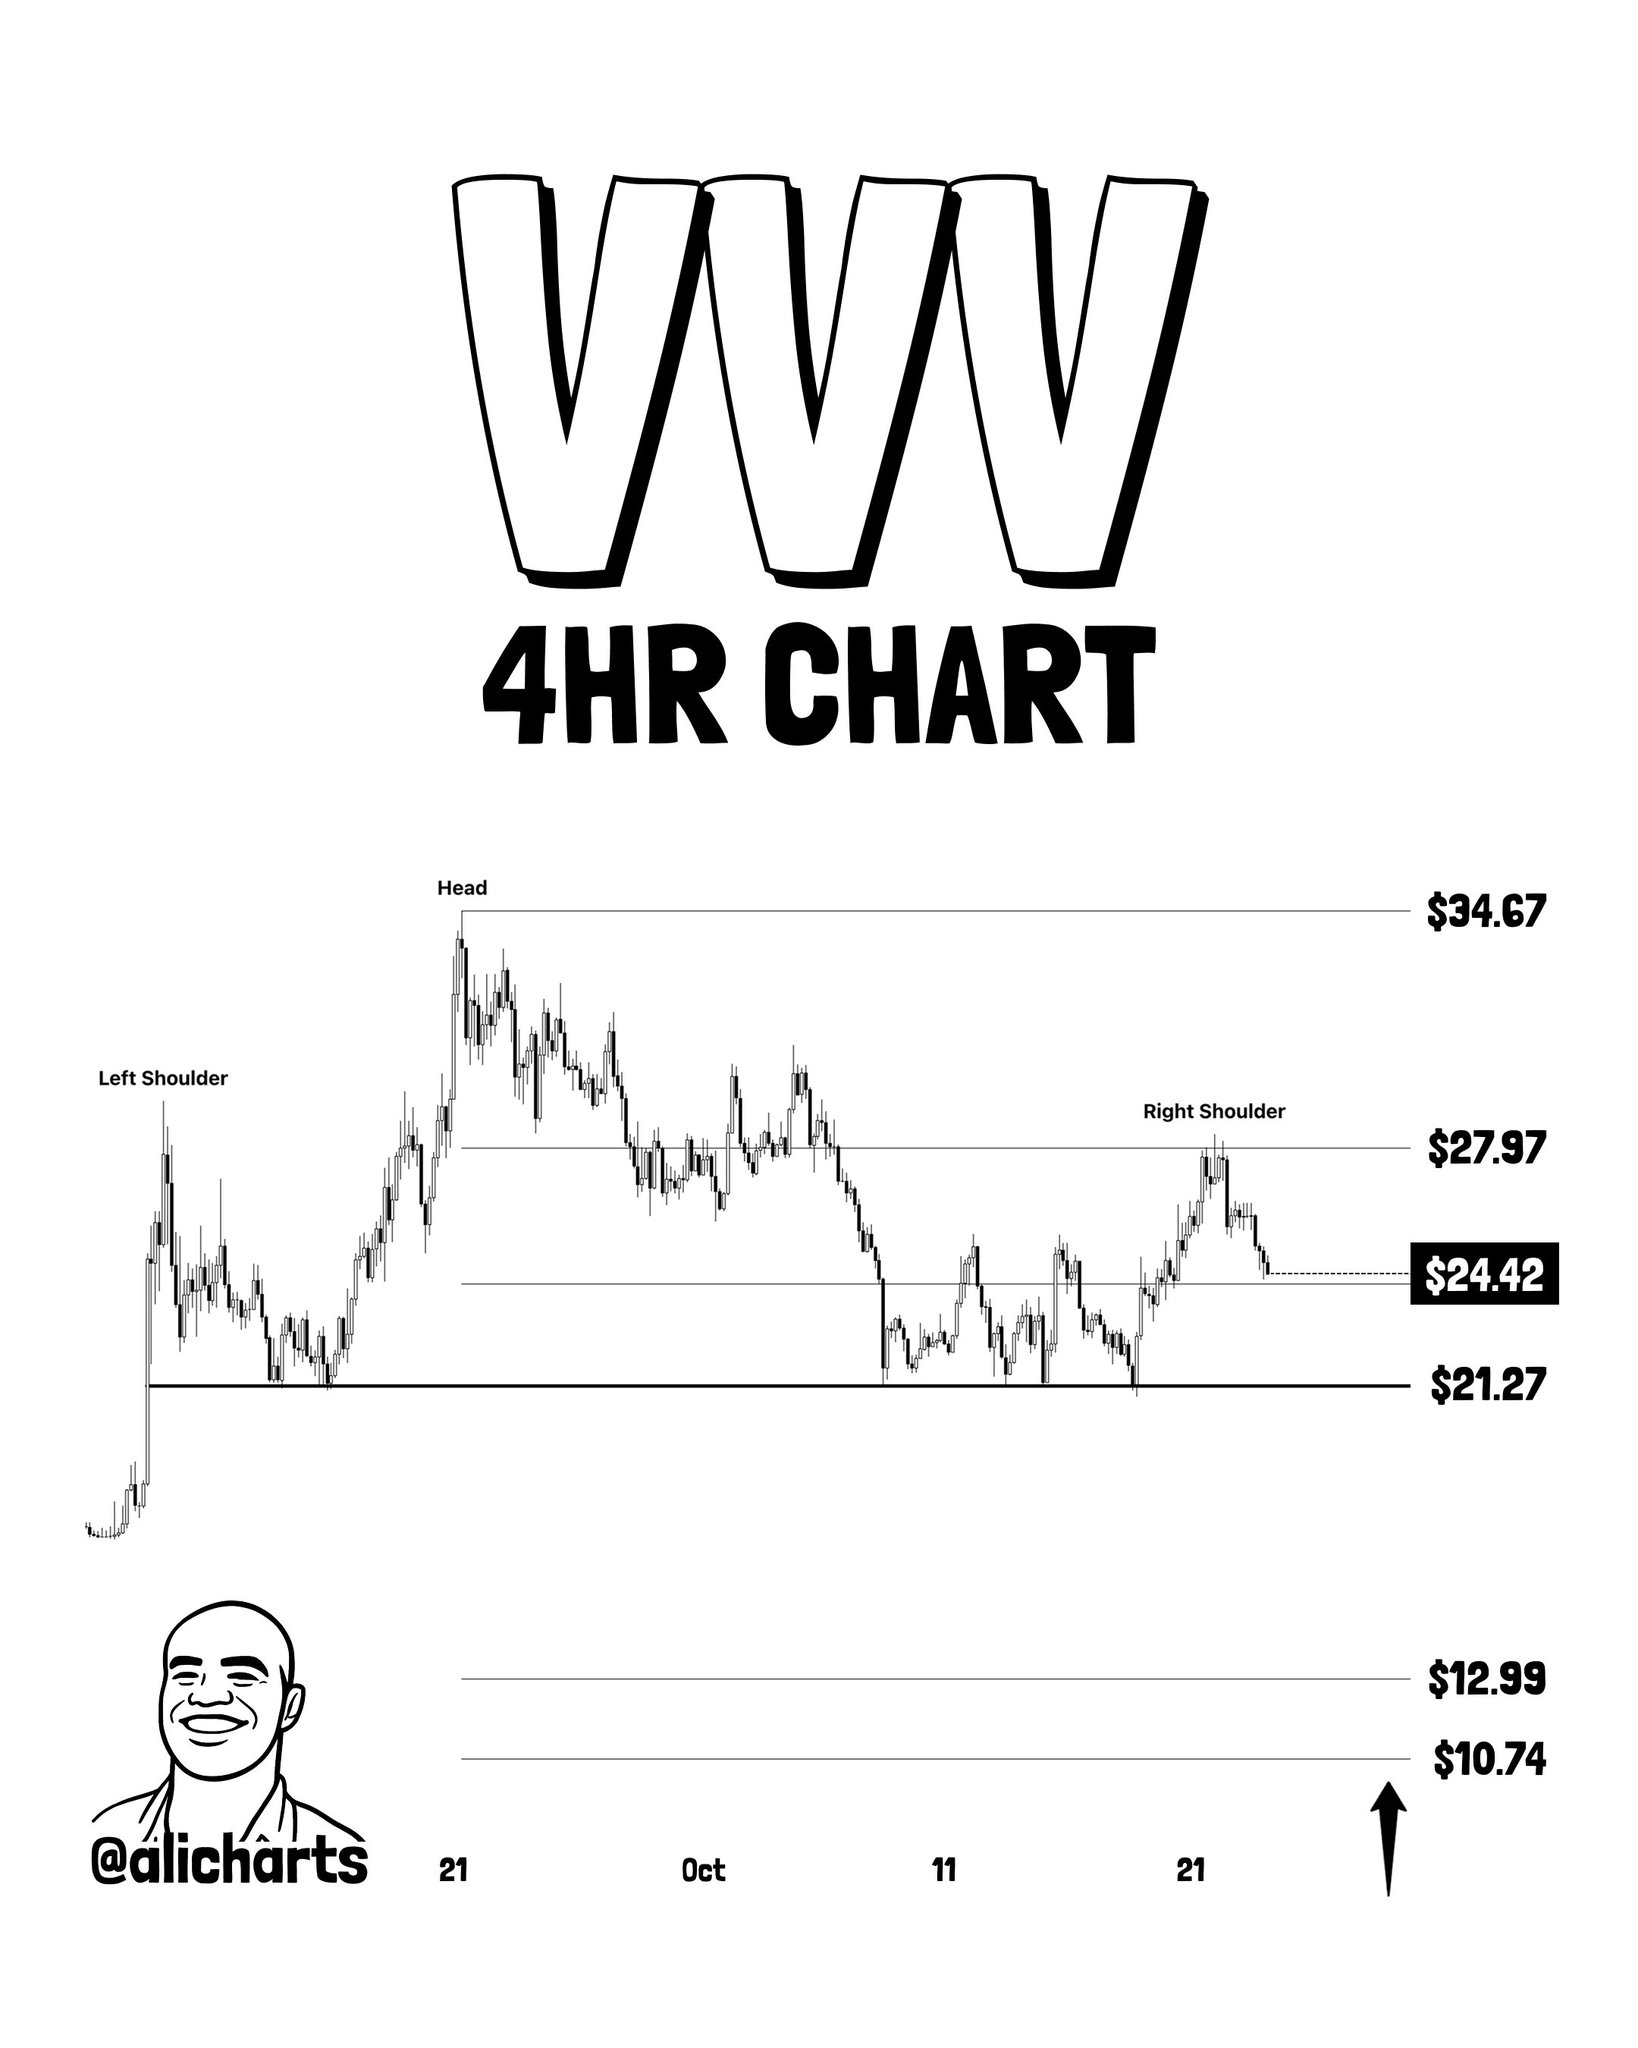
The head-and-shoulders is a three-peak reversal pattern where the middle peak (head) exceeds both flanking peaks (shoulders). When price breaks the horizontal neckline connecting the pattern’s troughs, it signals a momentum regime change from bullish to bearish. The analyst’s exact trigger: a 4-hour close below $21.27. That close, if it comes, would confirm the bearish reversal. The downside targets stated by @alicharts are $13 and $11 — representing declines of approximately 47% and 55% from the neckline level respectively. The chart labels $12.99 and $10.74 as the projected target zones.
Critically, the pattern has not yet confirmed. Price remains above $21.27. The right shoulder structure appears to have printed its peak near $27.97, and the current position at $24.42 places VVV in the descending phase between the right shoulder and neckline — the most dangerous pre-confirmation zone, where sellers dominate but no formal breakdown has triggered.
Bullish Scenario
A reclaim and 4-hour close back above the right shoulder near $27.97 would invalidate the head-and-shoulders structure, reopening a retest of the head at $34.67.
Bearish Scenario
A 4-hour close below $21.27 confirms the pattern. Ali Charts targets $12.99 as the primary downside destination, with $10.74 as the extended target — a 55% decline from the neckline.
Signal 2 — OriginTrail ($TRAC): Descending Triangle Compressing Toward $0.38
TRAC is presenting a different but equally bearish compression structure. Ali Charts flags a descending triangle on the 4-hour chart — a pattern defined by declining highs (a falling upper trendline) pressing against a flat horizontal support. The support level is $0.38. The current price sits at approximately $0.415, already below the descending trendline but above the horizontal floor, placing TRAC inside the triangle near its lower boundary.
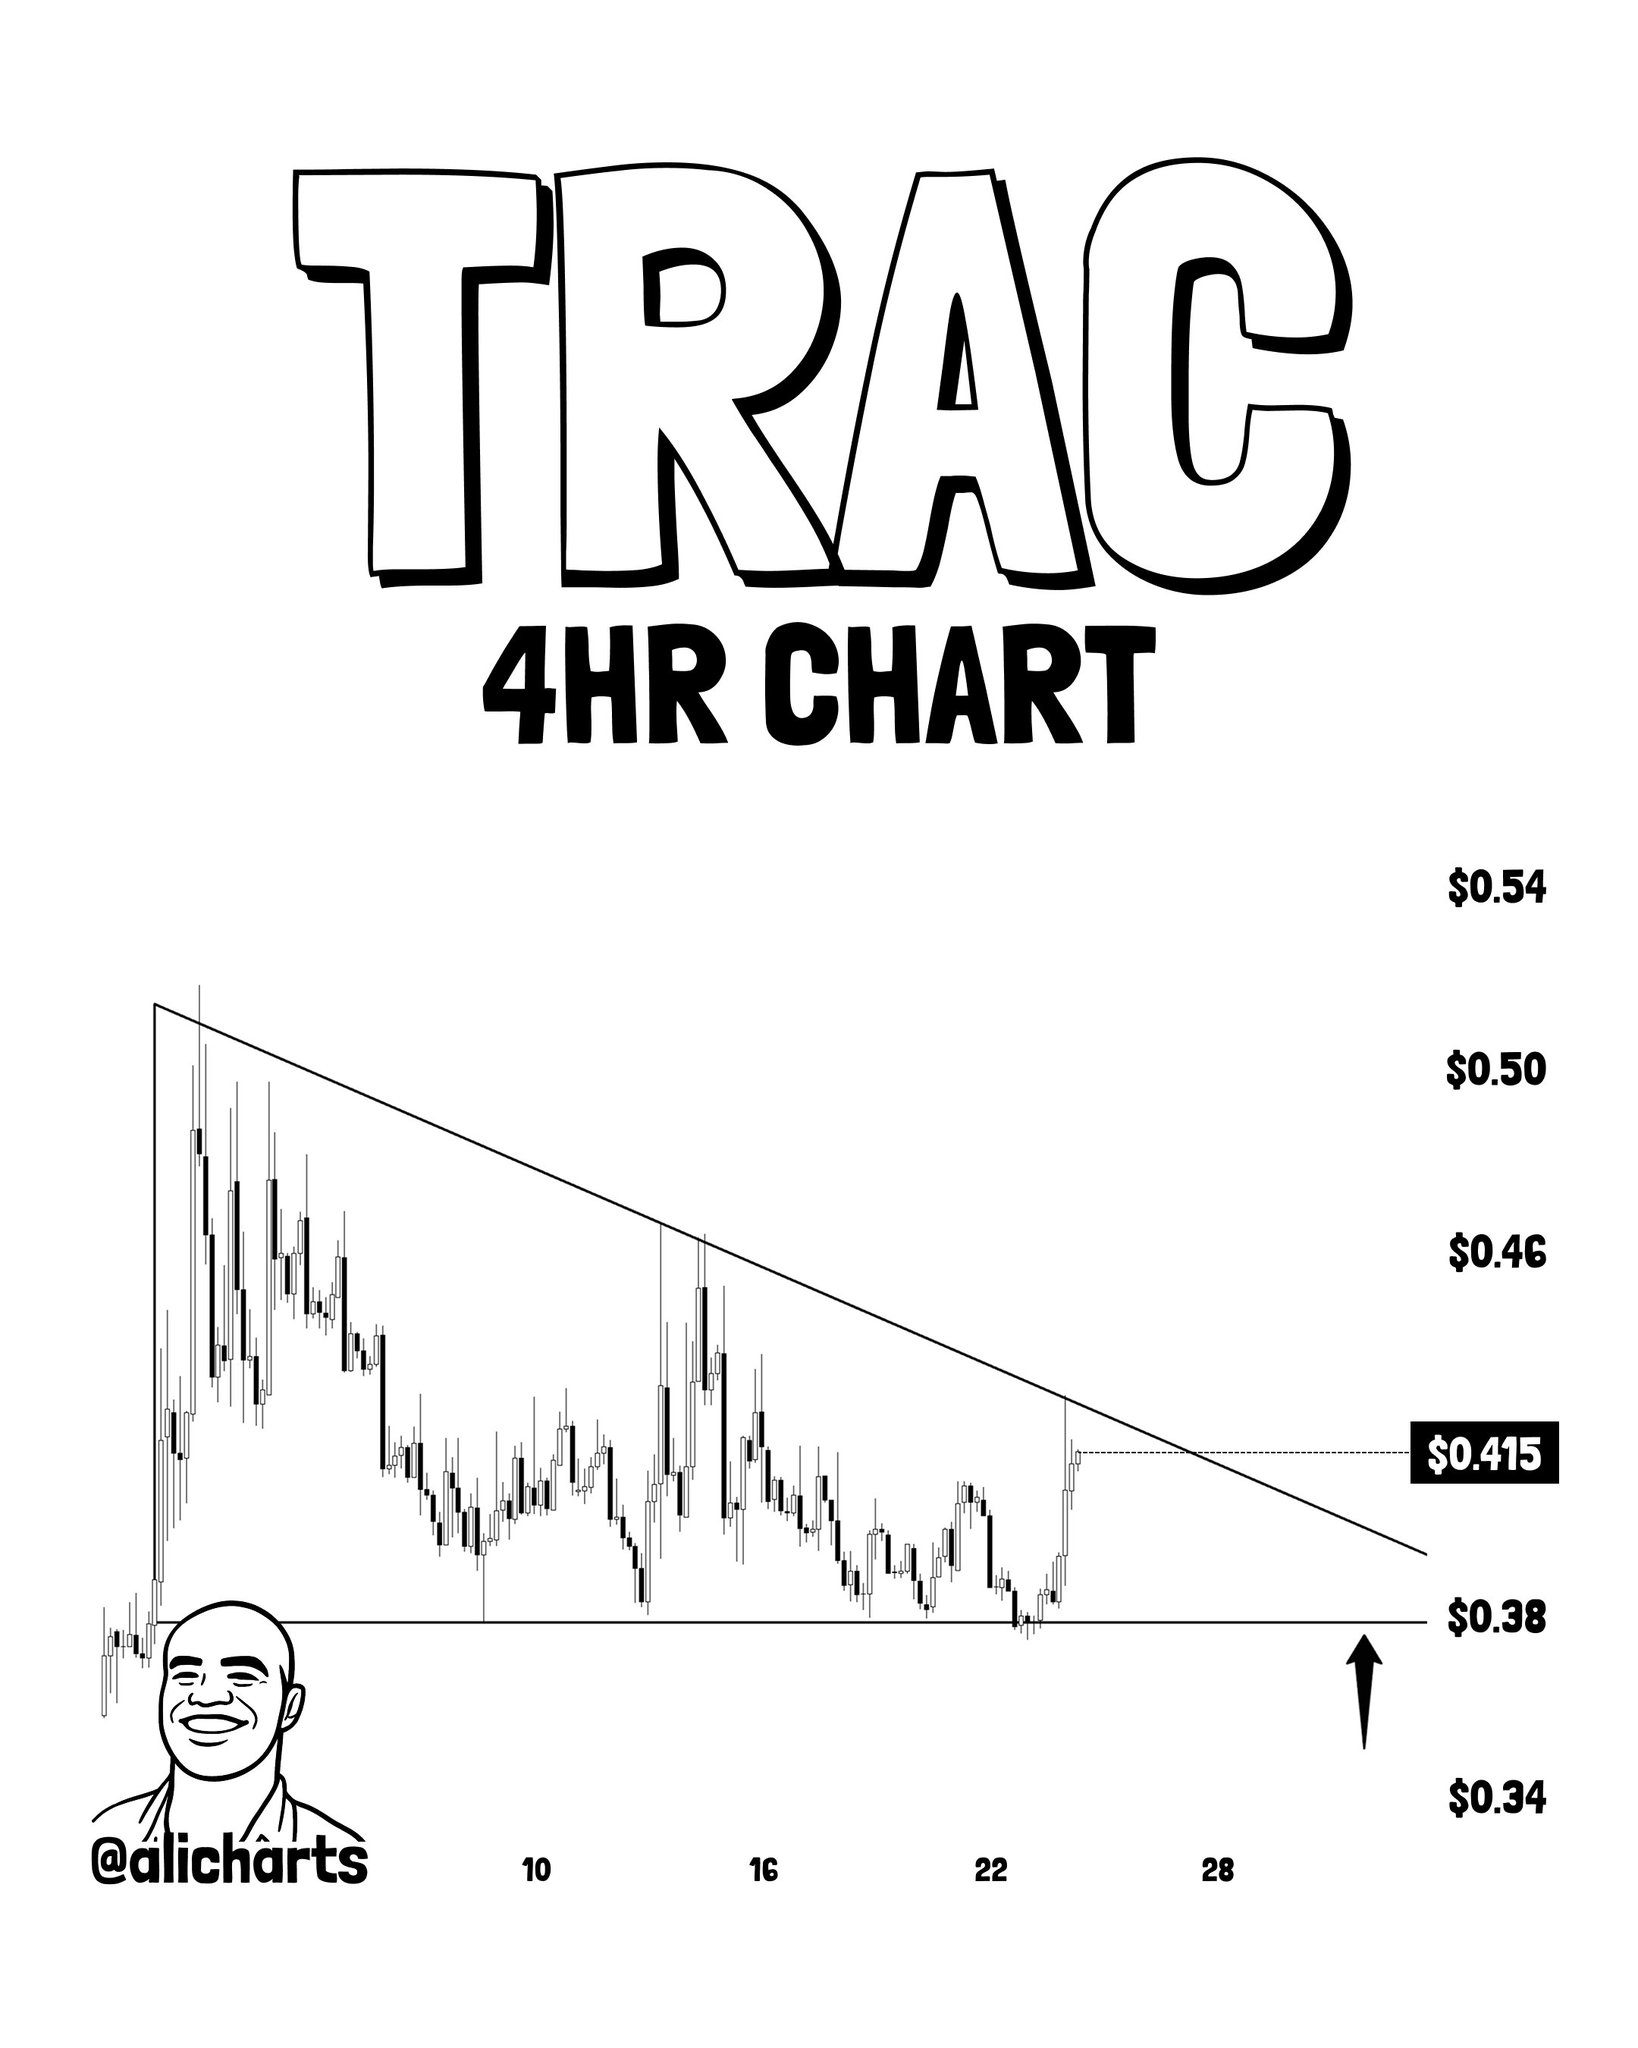
A descending triangle is typically a bearish continuation pattern. Each successive rally fails at a lower high, reducing buying pressure. The flat support at $0.38 absorbs selling — until it doesn’t. When that level fails, it often accelerates because stop-loss orders beneath flat supports tend to cluster. The analyst’s trigger is a 4-hour close below $0.38. According to the thread, that close could trigger a deeper retracement to $0.26 — a decline of approximately 32% from the support level.
The chart shows a recent bounce from near $0.38, with price recovering to $0.415. That bounce is visible but has not broken the descending upper trendline — meaning the triangle compression is intact and the pattern remains unresolved. Every rally continues to fail at lower highs. The coiled structure between the falling upper trendline and flat $0.38 floor is approaching its apex.
Bullish Scenario
A 4-hour close above the descending trendline — currently acting as dynamic resistance — would negate the triangle, with $0.46 and $0.50 as intermediate recovery targets.
Bearish Scenario
A 4-hour close below $0.38 confirms triangle breakdown. Ali Charts targets $0.26 — a 32% decline from the support level.
Signal 3 — AI Rig Complex ($ARC): Channel Bounce Stalling at Mid-Range Decision Zone
ARC tells a slightly different story. The daily chart shows a defined horizontal channel with a floor near $0.030 and a ceiling near $0.100. After a sharp descent to the channel floor, ARC staged an aggressive V-shaped recovery, but that recovery has now stalled — with price sitting at approximately $0.059, inside the mid-range decision zone between $0.059 and $0.070.
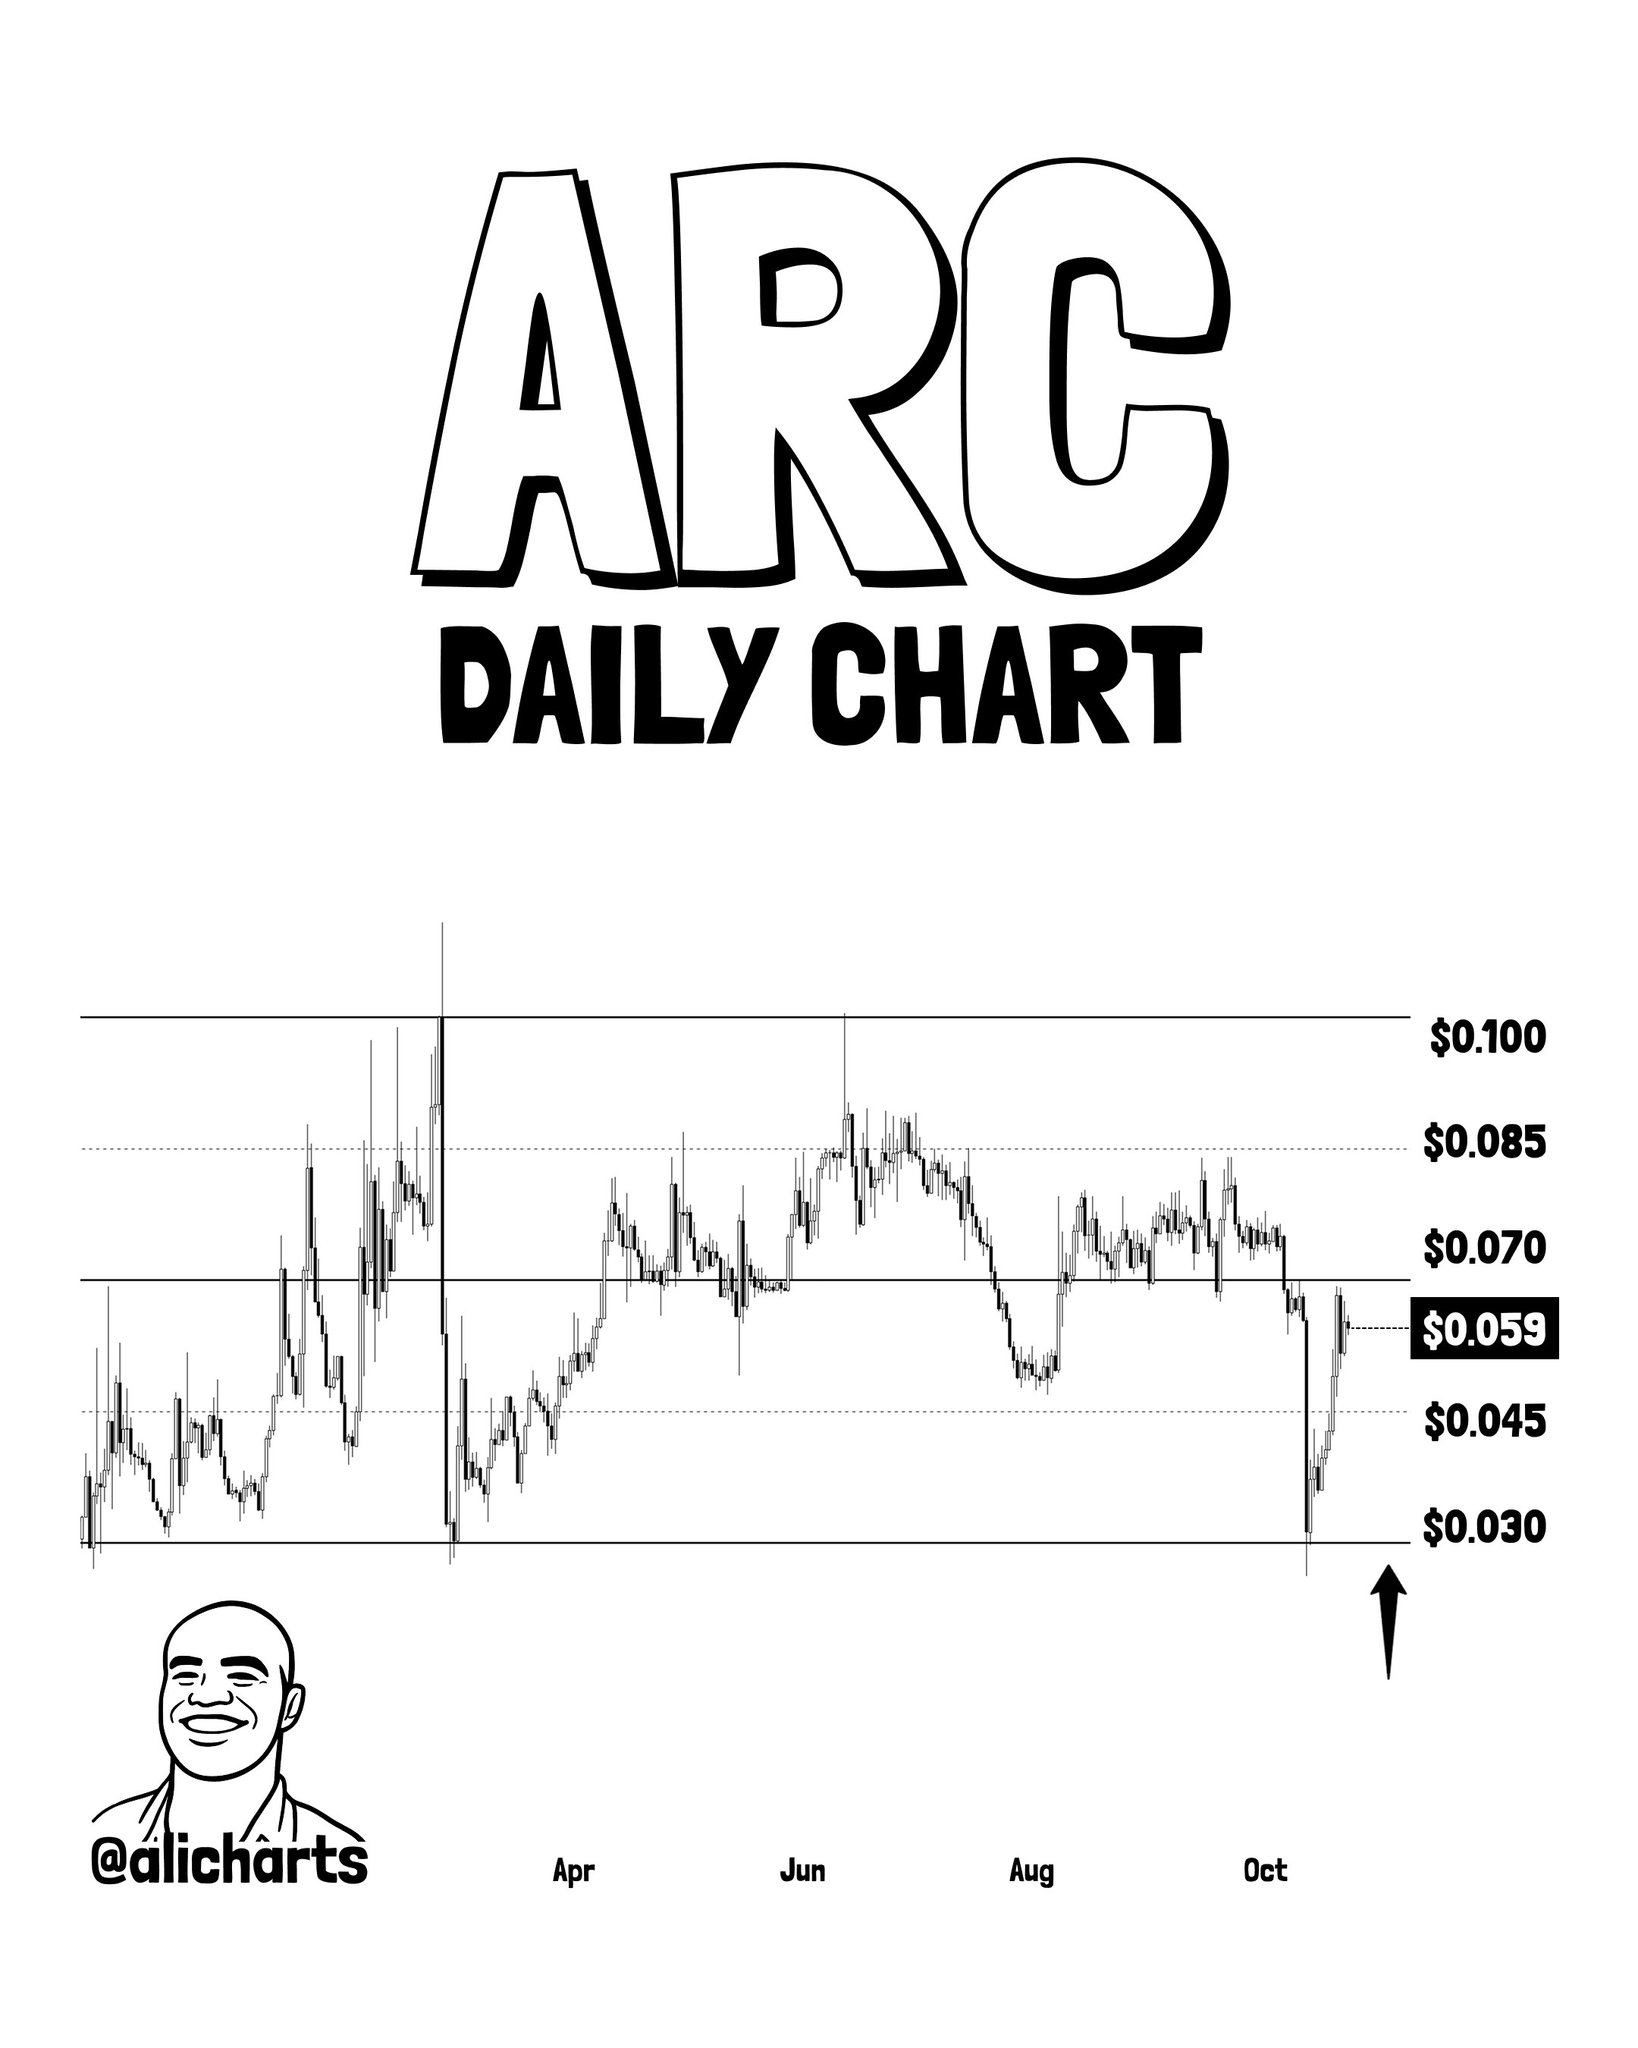
The analyst’s concern here is specific: a rejection at the mid-range zone could send price back to retest the channel floor at $0.030. More critically, a daily close below the channel floor at $0.030 would be the structural breakdown signal. Ali Charts states that a daily close below that level opens the door to $0.014 or $0.0075 — declines of 53% and 75% from the floor respectively.
The pattern is still forming. No breakdown has been confirmed. Price remains within the channel, having completed the bounce phase but not yet approaching either boundary. The $0.059–$0.070 zone is the current battleground: if buyers absorb selling pressure here and drive a close above $0.070, the structure remains intact. If sellers reject price at mid-range and the channel floor fails on a daily close basis, the downside math becomes severe.
The AI agent token sector has attracted significant speculative positioning over recent cycles. For broader context on how institutional capital has been flowing into AI-adjacent crypto assets through regulated products, the SUI ETF inflows data — five consecutive weeks of demand provides a useful comparison on what genuine structural inflows look like versus pattern-driven rotations.
Bullish Scenario
A daily close above $0.070 clears the mid-range resistance and reopens a run toward the channel ceiling at $0.085 and $0.100.
Bearish Scenario
Rejection at the $0.059–$0.070 decision zone followed by a daily close below $0.030 confirms channel breakdown. Ali Charts targets $0.014 as the primary destination, with $0.0075 as the extended bearish projection.
Three Patterns, One Sector — What It Means
The significance of this thread is not any single pattern — it is the simultaneous emergence of reversal structures across three independent AI agent tokens, each on a different pattern type (head-and-shoulders, descending triangle, channel) but converging on the same directional warning. None of these setups has confirmed yet. That distinction matters: a pattern that is still forming is not a breakdown. It is a risk framework — one that defines exactly what a bearish confirmation looks like and what it would target.
The confirmation levels are precise: $21.27 on VVV (4-hour close), $0.38 on TRAC (4-hour close), and $0.030 on ARC (daily close). Until those closes arrive, the patterns remain warnings, not verdicts. Watch for AI-adjacent token developments — including how products like the Bitwise NEAR ETF perform — as a gauge of whether institutional appetite supports AI sector tokens or accelerates rotation out of them.
Ali Charts’ assessment on October 24, 2026 is direct: the AI agent altcoin cohort is under structural pressure. Watch $21.27 on VVV — a 4-hour close below that level opens $12.99 and $10.74. Watch $0.38 on TRAC — a 4-hour close below triggers a measured move to $0.26. Watch $0.030 on ARC on the daily — a close below that floor activates targets of $0.014 and $0.0075. Until any of those closes print, the setups remain unconfirmed — but the compression is real, the levels are specific, and the next several sessions will answer the question.
Frequently Asked Questions
What confirms the VVV head-and-shoulders breakdown?
What is the downside target if TRAC breaks below $0.38?
Why does ARC require a daily close rather than a 4-hour close for confirmation?
Are these three AI agent tokens already in breakdown mode?
Source: Ali Charts · Published by CoinsProbe Markets Desk
The opinions and market insights shared on CoinsProbe represent the views of individual authors based on prevailing market conditions at the time of publication. Cryptocurrency investments carry significant risk and volatility. Readers are encouraged to conduct their own research and seek professional financial advice before making investment decisions. CoinsProbe and its contributors do not accept responsibility for financial losses or decisions made based on published content.
CoinsProbe may publish sponsored articles, affiliate links, or promotional collaborations. All sponsored material is clearly labeled to maintain transparency with our audience. Our editorial decisions remain fully independent, and advertising partnerships do not influence reviews, rankings, or published opinions.
Since 2023, CoinsProbe has delivered reliable insights on cryptocurrency, blockchain, and digital assets. Our content is created by experienced researchers and analysts who follow strict editorial standards focused on accuracy, transparency, and credibility. Every article is carefully reviewed and verified using trusted sources and current market data. We provide unbiased analysis and timely updates covering everything from emerging crypto projects to major industry developments.