
- BTC is trading near $63,000–$63,500 as two independent Alphractal long-term metrics simultaneously approach historically significant accumulation zones for the first time in this cycle.
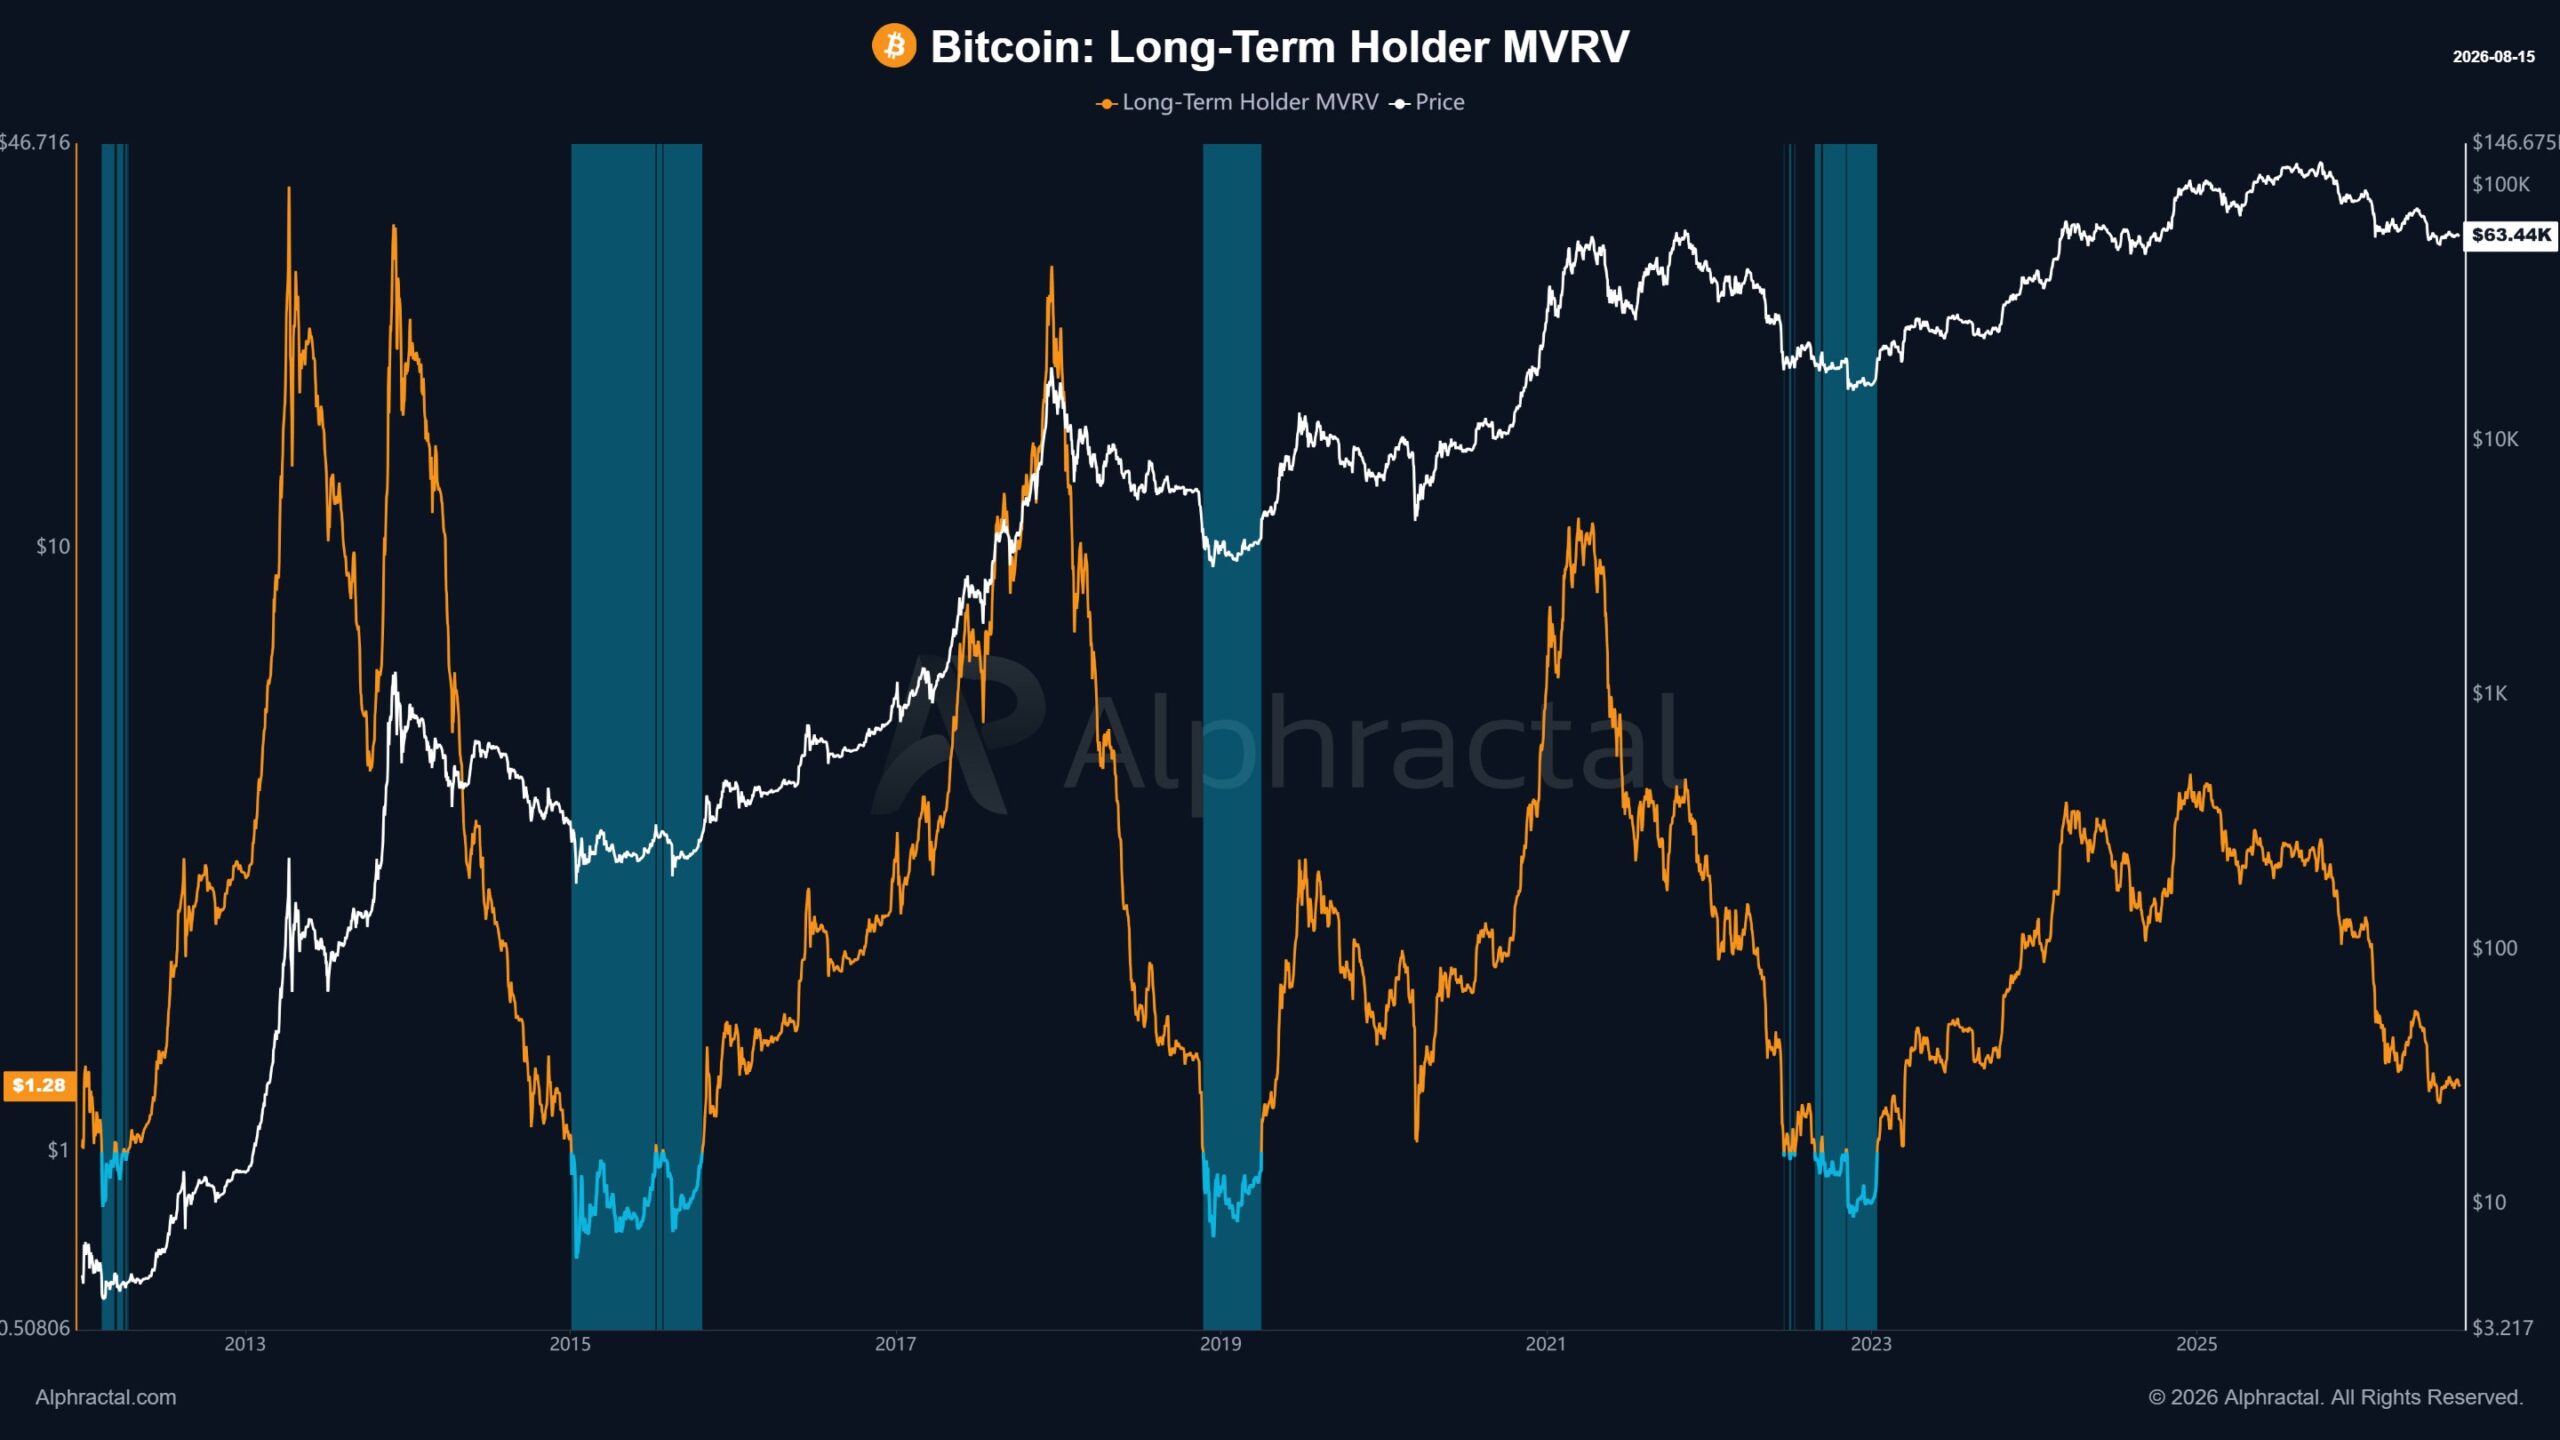
- The Long-Term Holder MVRV at 1.28 is steadily approaching the sub-1.0 zone that has historically coincided with Bitcoin's most important accumulation periods — 2012, 2015, 2018–2019, and 2022.
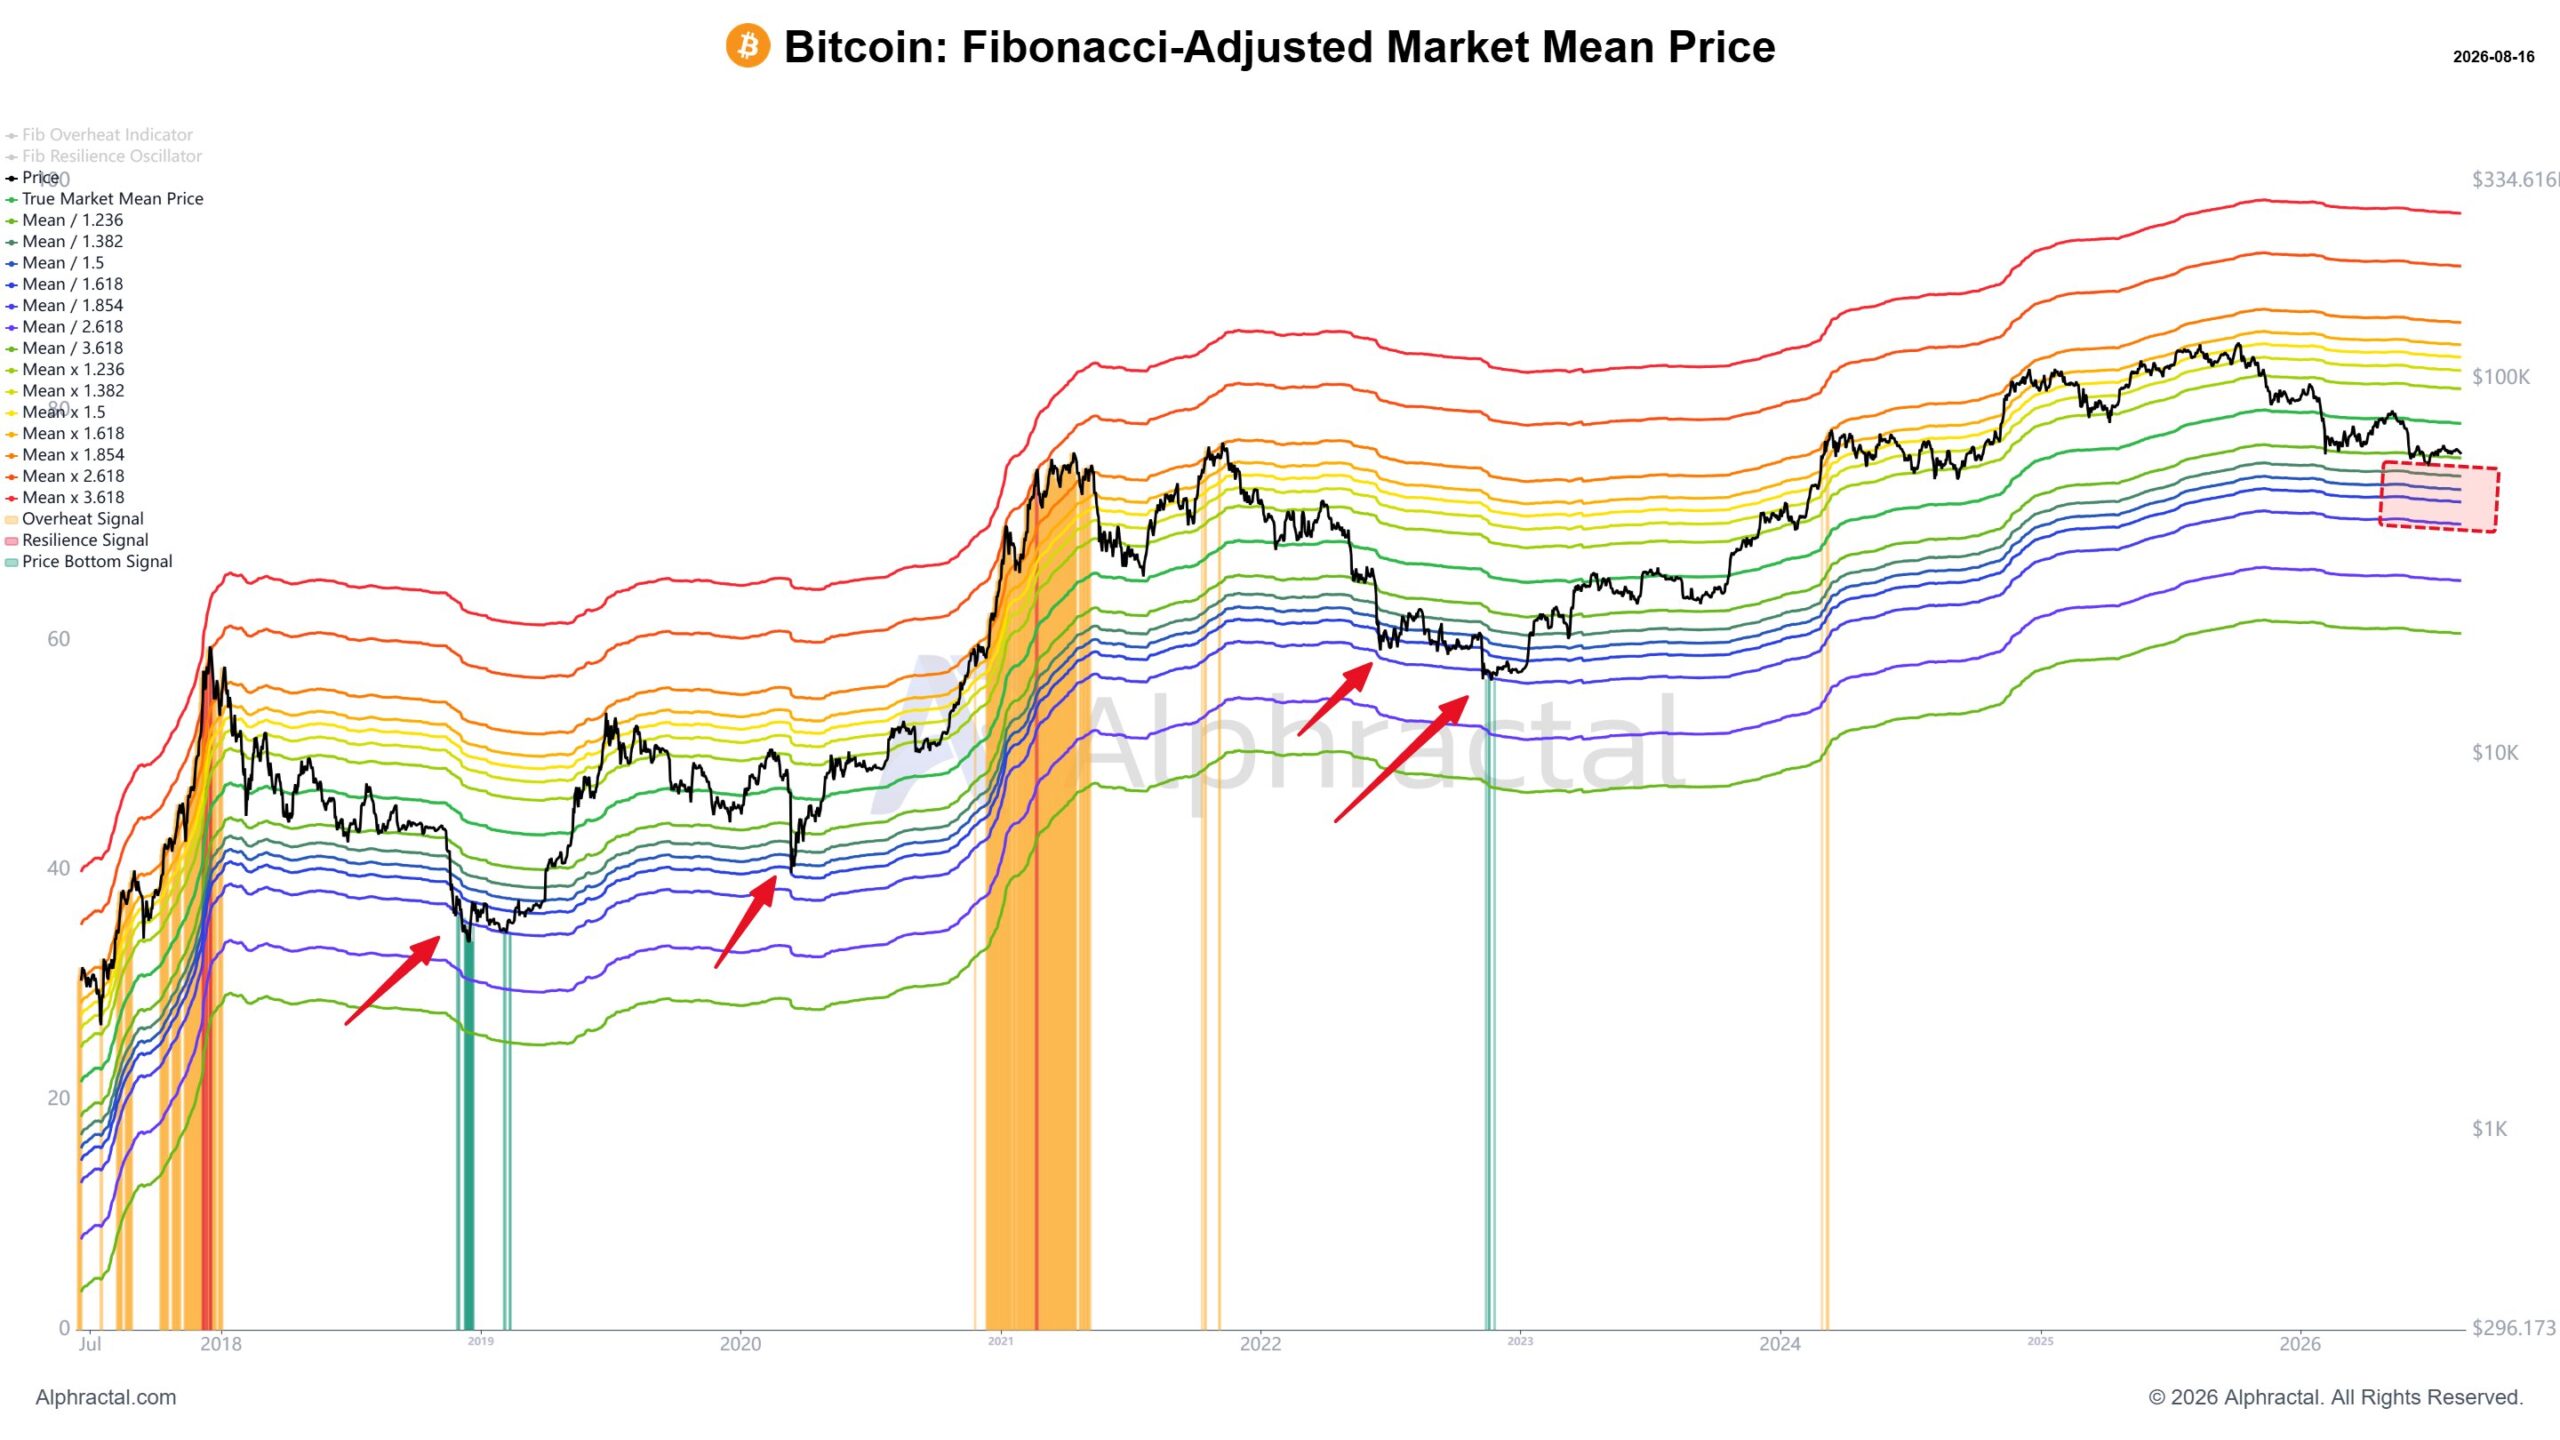
- The Fibonacci-Adjusted Market Mean Price lower blue bands are within reach of current prices — levels that have previously marked some of the best long-term buying opportunities in Bitcoin's history.
Bitcoin is consolidating near $63,000–$63,500 while two of Alphractal’s most historically grounded long-term on-chain metrics are quietly approaching the same zones that have defined Bitcoin’s most significant cycle bottoms. Neither has reached the extreme readings seen at prior capitulation lows — but both are moving in the same direction simultaneously, and the historical pattern they are tracking is one of the most consistently documented in Bitcoin’s on-chain analytical toolkit.
Signal 1 — Long-Term Holder MVRV at 1.28: Approaching the Stress Zone
The Long-Term Holder MVRV (Market Value to Realized Value) is one of the most structurally important metrics in Bitcoin’s on-chain analytical suite — and its current reading of 1.28 is drawing attention from the Alphractal team for reasons that become clear when the historical context is applied.
What the LTH MVRV Measures
The LTH MVRV compares the current market value of Bitcoin held by long-term holders against their average cost basis — the realized price at which those coins were originally acquired. A reading above 1.0 means long-term holders are, on aggregate, sitting on unrealized profits. A reading below 1.0 means the long-term holder cohort is, on aggregate, holding Bitcoin at an unrealized loss.
The 1.28 current reading means long-term holders are still profitable on average — but the margin of that profitability has been compressing steadily as the 2026 corrective phase has continued.
Why the Sub-1.0 Zone Is the Key Threshold
The LTH MVRV dropping below 1.0 is not simply a bearish technical signal — it is a historically rare and structurally meaningful condition that has appeared at Bitcoin’s most significant cycle lows:
| Period | LTH MVRV Reading | What Followed |
|---|---|---|
| 2012 | Near/below 1.0 | Major cycle bottom → multi-year bull run |
| 2015 | Near/below 1.0 | Cycle bottom → 2017 bull market |
| 2018–2019 | Near/below 1.0 | Cycle bottom → 2020–2021 expansion |
| 2022 | Near/below 1.0 | Cycle bottom → 2023–2025 recovery |
| 2026 | 1.28 — approaching | Pending |
When the LTH MVRV drops to or below 1.0, it means long-term holders — the most conviction-driven, least reactive cohort in Bitcoin’s ecosystem — are sitting at breakeven or in loss on aggregate. This condition has historically appeared in the later stages of corrective cycles rather than in their early or middle phases, because reaching this level requires a sustained and significant price decline that forces even long-term accumulated positions into loss territory.
At 1.28, the metric has not yet reached that extreme. But it is moving toward it with the kind of directional consistency that makes the current level worth monitoring closely. A further price decline of meaningful magnitude — without a corresponding increase in long-term holder cost basis — would push the LTH MVRV into the sub-1.0 zone that has marked four of Bitcoin’s most important accumulation entry points in its history.
As covered in our Bitcoin ADCI accumulation zone analysis and Bitcoin macro bottom signals breakdown, the on-chain framework building around Bitcoin’s current position has been accumulating independent signals that collectively describe a market moving toward — rather than away from — historically significant accumulation territory. The LTH MVRV at 1.28 is the latest addition to that picture.
Signal 2 — Fibonacci-Adjusted Market Mean Price: Lower Blue Bands in Reach
The second signal comes from the Fibonacci-Adjusted Market Mean Price model — an Alphractal indicator that has become one of the more visually striking long-term valuation tools in Bitcoin on-chain analysis.
How the Model Works
The indicator is built around Bitcoin’s True Market Mean Price — a measure of the average price at which all Bitcoin in existence was last transacted, weighted for economic significance. Around this mean, the model applies Fibonacci-proportional bands extending both above and below:
Upper bands (orange/red): Zones that have historically coincided with overheated market conditions and cycle peaks — the regions where Bitcoin has been most richly valued relative to its mean price.
Lower blue bands: Zones that have historically aligned with undervalued conditions and major cycle lows — the regions where Bitcoin has offered its most asymmetric long-term risk/reward profile relative to the mean.
Where Bitcoin Sits Now
Bitcoin has not yet entered the lower blue band region on the Fibonacci Mean Price chart. However, Alphractal founder Joao Wedson notes that only a modest further downside from current levels would be required for price to reach those bands if the current corrective phase continues.
The historical significance of the lower blue bands is well-documented on Alphractal’s own chart — each prior instance where Bitcoin’s price touched or briefly entered the lower blue zone corresponds directly with what are now recognized as some of the best long-term buying opportunities in Bitcoin’s history. The 2015 bottom, the 2018–2019 capitulation zone, and the 2022 cycle low all registered contact with or proximity to the lower blue bands before the subsequent recoveries began.
What “Approaching” Means in Practice
The framing that “only modest further downside” is required is analytically meaningful rather than vague. It quantifies the remaining distance between current prices and the lower blue bands as smaller than the distance already traveled in the 2026 corrective phase — meaning the risk/reward dynamic for long-term positioning is more favorable now than it was at higher prices earlier in 2026, and becomes more favorable still if prices continue declining toward the band.
This is not a prediction of further downside — it is a valuation framework that identifies where the historically validated entry zone sits relative to current prices.
Why Two Independent Long-Term Signals Pointing the Same Direction Matters
The LTH MVRV and the Fibonacci-Adjusted Market Mean Price are not the same tool measuring the same thing. One tracks the realized profit/loss position of the long-term holder cohort; the other applies Fibonacci mathematics to Bitcoin’s mean transaction price to identify valuation bands. They are independent in methodology and independent in their data inputs.
Both are currently pointing toward the same conclusion: Bitcoin is approaching — but has not yet reached — the historically validated accumulation zones that have marked major cycle lows.
The absence of extreme readings in either metric is itself part of the analytical picture. At prior cycle bottoms, both the LTH MVRV and the Fibonacci lower bands were not merely approached — they were touched or briefly breached. The current readings suggest the market is in the later stages of its corrective phase but has not yet produced the final capitulation conditions that have historically marked definitive cycle lows.
As documented in our Bitcoin LTH profitability hitting cycle bottom levels analysis and two independent Bitcoin valuation models both pointing to undervaluation, the multi-framework convergence building in Bitcoin’s on-chain toolkit through August 2026 is describing a market where the weight of evidence increasingly favors accumulation over distribution — even if the precise timing of the cycle inflection has not yet been confirmed by the most definitive signals.
What to Watch — The Specific Thresholds That Matter
LTH MVRV crossing below 1.0: This is the specific reading that would place Bitcoin in the zone associated with the four prior major cycle lows. From the current 1.28, reaching sub-1.0 requires a meaningful further decline in price relative to long-term holder cost basis. If and when this threshold is crossed, the historical pattern suggests the risk/reward for long-term accumulation reaches its most favorable level in the current cycle.
Bitcoin touching the lower Fibonacci blue bands: Wedson’s observation that only modest further downside is required to reach these bands means this threshold could be tested relatively quickly if selling pressure returns. A confirmed touch of the lower blue zone — particularly if accompanied by an LTH MVRV reading approaching or below 1.0 — would represent the strongest combination of the two signals seen in this corrective cycle.
STH/LTH Realized Price confirmation: As covered in our Bitcoin ADCI and STH/LTH signal analysis, the STH/LTH Realized Price Market Signal has not yet printed its Bear Market End marker — the most precise cycle confirmation tool in the Alphractal framework. The LTH MVRV and Fibonacci bands approaching their historical thresholds creates a setup where the STH/LTH confirmation, when it eventually arrives, would be accompanied by multiple independent signals all aligned simultaneously.
Bottom Line
Bitcoin near $63,000–$63,500 is presenting a long-term on-chain picture defined by two independent Alphractal metrics — both approaching historically significant accumulation zones for the first time in the current cycle.
The LTH MVRV at 1.28 is steadily moving toward the sub-1.0 threshold that has coincided with every major Bitcoin cycle bottom since 2012. The Fibonacci-Adjusted Market Mean Price lower blue bands are within reach of current prices — zones that have historically marked Bitcoin’s most asymmetric long-term entry opportunities.
Neither metric has reached the extreme readings that characterized the deepest capitulation moments of prior cycles. But both are directionally converging on those zones simultaneously — and the historical pattern they are tracking has a consistent and well-documented record of preceding significant and sustained Bitcoin recoveries.
For long-term oriented participants, LTH MVRV sub-1.0 and Fibonacci lower blue band contact are the two specific thresholds worth monitoring most closely in the weeks ahead. They are not price targets — they are the on-chain conditions that have historically defined where Bitcoin’s most favorable long-term entry opportunities have been found.
Frequently Asked Questions
What is the Long-Term Holder MVRV and what does 1.28 mean
The LTH MVRV compares Bitcoin’s market value held by long-term holders against their average cost basis. A reading of 1.28 means long-term holders are still profitable on average, but the margin is compressing. Sub-1.0 readings — where long-term holders are in aggregate loss — have historically coincided with Bitcoin’s major cycle bottoms in 2012, 2015, 2018–2019, and 2022.
What is the Fibonacci-Adjusted Market Mean Price model?
It applies Fibonacci-proportional bands around Bitcoin’s True Market Mean Price. Upper bands have historically marked overheated conditions. Lower blue bands have historically aligned with undervalued conditions and major cycle lows — representing some of Bitcoin’s best long-term buying opportunities.
Has Bitcoin entered the accumulation zone yet according to these metrics?
Not yet by either metric’s most extreme threshold. LTH MVRV at 1.28 is approaching but has not crossed below 1.0. The Fibonacci lower blue bands are within reach but have not been touched. Both are in the later stages of their approach — not at the extreme capitulation readings seen at prior definitive cycle lows.
How much further downside would trigger the Fibonacci lower bands?
Alphractal founder Joao Wedson notes that only modest further downside from current levels would be required for Bitcoin to reach the Fibonacci lower blue bands — meaning the distance to that historically validated zone is smaller than the decline already experienced in the 2026 corrective phase.
What would confirm Bitcoin’s macro bottom using these two signals?
The strongest confirmation would be a combination of LTH MVRV crossing below 1.0 and Bitcoin touching the Fibonacci lower blue bands simultaneously — accompanied by the STH/LTH Realized Price Signal printing its Bear Market End marker. The convergence of all three independent signals would represent the most historically grounded confirmation of a definitive cycle low.
The opinions and market insights shared on CoinsProbe represent the views of individual authors based on prevailing market conditions at the time of publication. Cryptocurrency investments carry significant risk and volatility. Readers are encouraged to conduct their own research and seek professional financial advice before making investment decisions. CoinsProbe and its contributors do not accept responsibility for financial losses or decisions made based on published content.
CoinsProbe may publish sponsored articles, affiliate links, or promotional collaborations. All sponsored material is clearly labeled to maintain transparency with our audience. Our editorial decisions remain fully independent, and advertising partnerships do not influence reviews, rankings, or published opinions.
Since 2023, CoinsProbe has delivered reliable insights on cryptocurrency, blockchain, and digital assets. Our content is created by experienced researchers and analysts who follow strict editorial standards focused on accuracy, transparency, and credibility. Every article is carefully reviewed and verified using trusted sources and current market data. We provide unbiased analysis and timely updates covering everything from emerging crypto projects to major industry developments.