
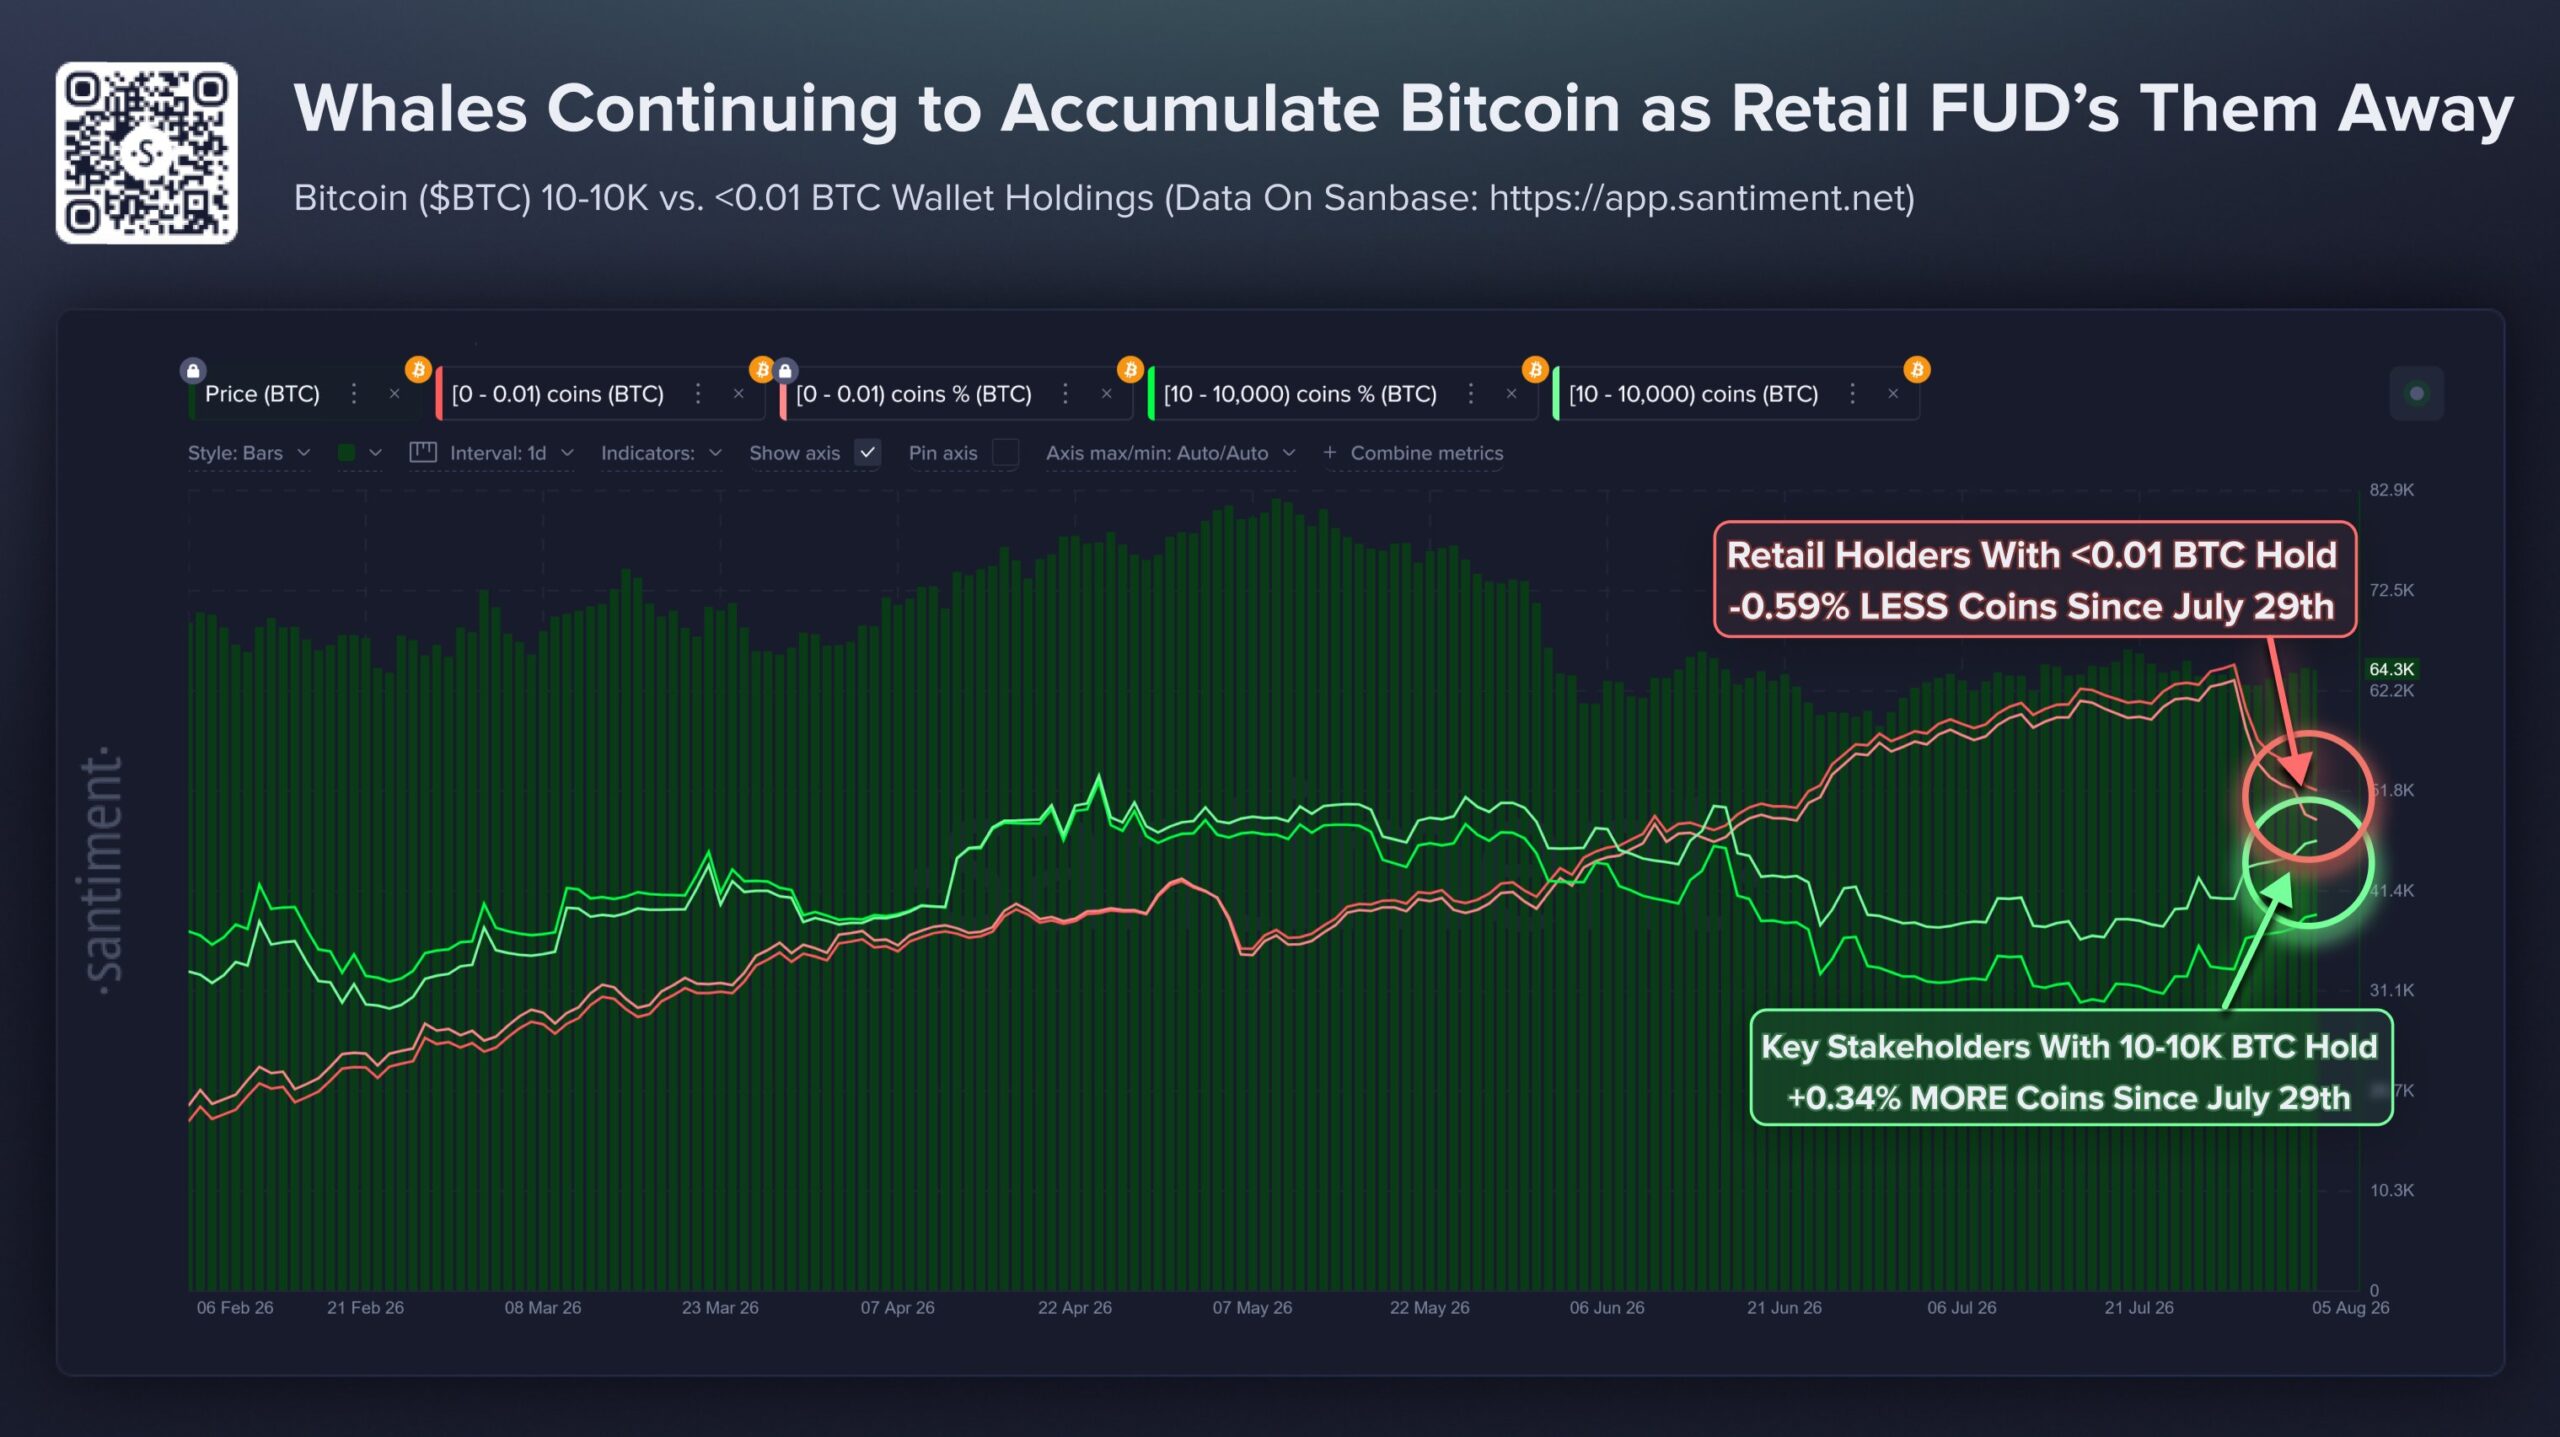
- Whales accumulated 0.34% more BTC since July 29, while retail wallets cut holdings by 0.59%, according to Santiment.
- Bitcoin's monthly momentum oscillator has reached levels seen at the 2011, 2015, 2018, and 2022 market bottoms.
- The combination of whale accumulation and retail capitulation points to a higher probability of a move toward $70,000+ rather than below $60,000.
Bitcoin’s current setup is being read by on-chain analysts and long-term technical analysts as the same environment — from two completely different analytical frameworks — arriving at the same conclusion simultaneously.
Bitcoin is trading at $64,351 — up +0.64% over 7 days and +2.52% over 30 days — with a market cap of approximately $1.29 trillion. The price consolidation near $64,000–$65,000 has now persisted for several sessions — a range that the on-chain and technical signals below suggest may be a historically significant accumulation zone rather than a prelude to further downside.

Whale Accumulation vs Retail Exit: The Classic Bottom Pattern
Santiment data reveals a divergence between large and small Bitcoin holders that has historically been one of the more reliable signals of a market approaching a durable low:
| Holder Type | Wallet Size | Change Since July 29 |
|---|---|---|
| Whales and Sharks | 10–10,000 BTC | +0.34% |
| Micro-retail | Under 0.01 BTC | -0.59% |
What the divergence means:
While retail participants holding less than 0.01 BTC have reduced their holdings by -0.59% — the sharpest drop in micro-holder balances since December 2024 — wallets in the 10–10,000 BTC range have been simultaneously increasing their holdings by +0.34%. Supply is transferring from small, sentiment-reactive holders to large, conviction-driven participants.
The Coldcard fallout as a catalyst:
Santiment specifically notes that this divergence coincides with the Coldcard hardware wallet entropy flaw — where a firmware vulnerability led to an estimated 1,360 BTC (~$87 million) being swept from affected wallets. The resulting fear and uncertainty in the retail community appear to have accelerated small holder selling — while larger, more informed participants have been absorbing that supply rather than joining the exit.
Santiment’s probability assessment:
The data provider suggests that this specific pattern — key stakeholders accumulating while retail reduces exposure amid FUD — historically increases the probability of Bitcoin moving toward $70,000+ rather than revisiting levels below $60,000. This is not a guaranteed outcome — it is a probability assessment based on prior instances where the same divergence appeared.
Monthly Oscillator at Historic Bottom Zone
Analyst @JamesEastonUK shared a full-history monthly Bitcoin chart that provides the longest possible timeframe context for the current momentum reading — and the signal it is producing is one that has appeared at every major Bitcoin cycle bottom since 2011.
Reading the chart:
The chart displays Bitcoin’s price action (right axis) alongside a momentum oscillator (purple line, left axis) that tracks the rate of momentum change on the monthly timeframe. The current reading sits at approximately -46.41 — in extreme oversold territory.
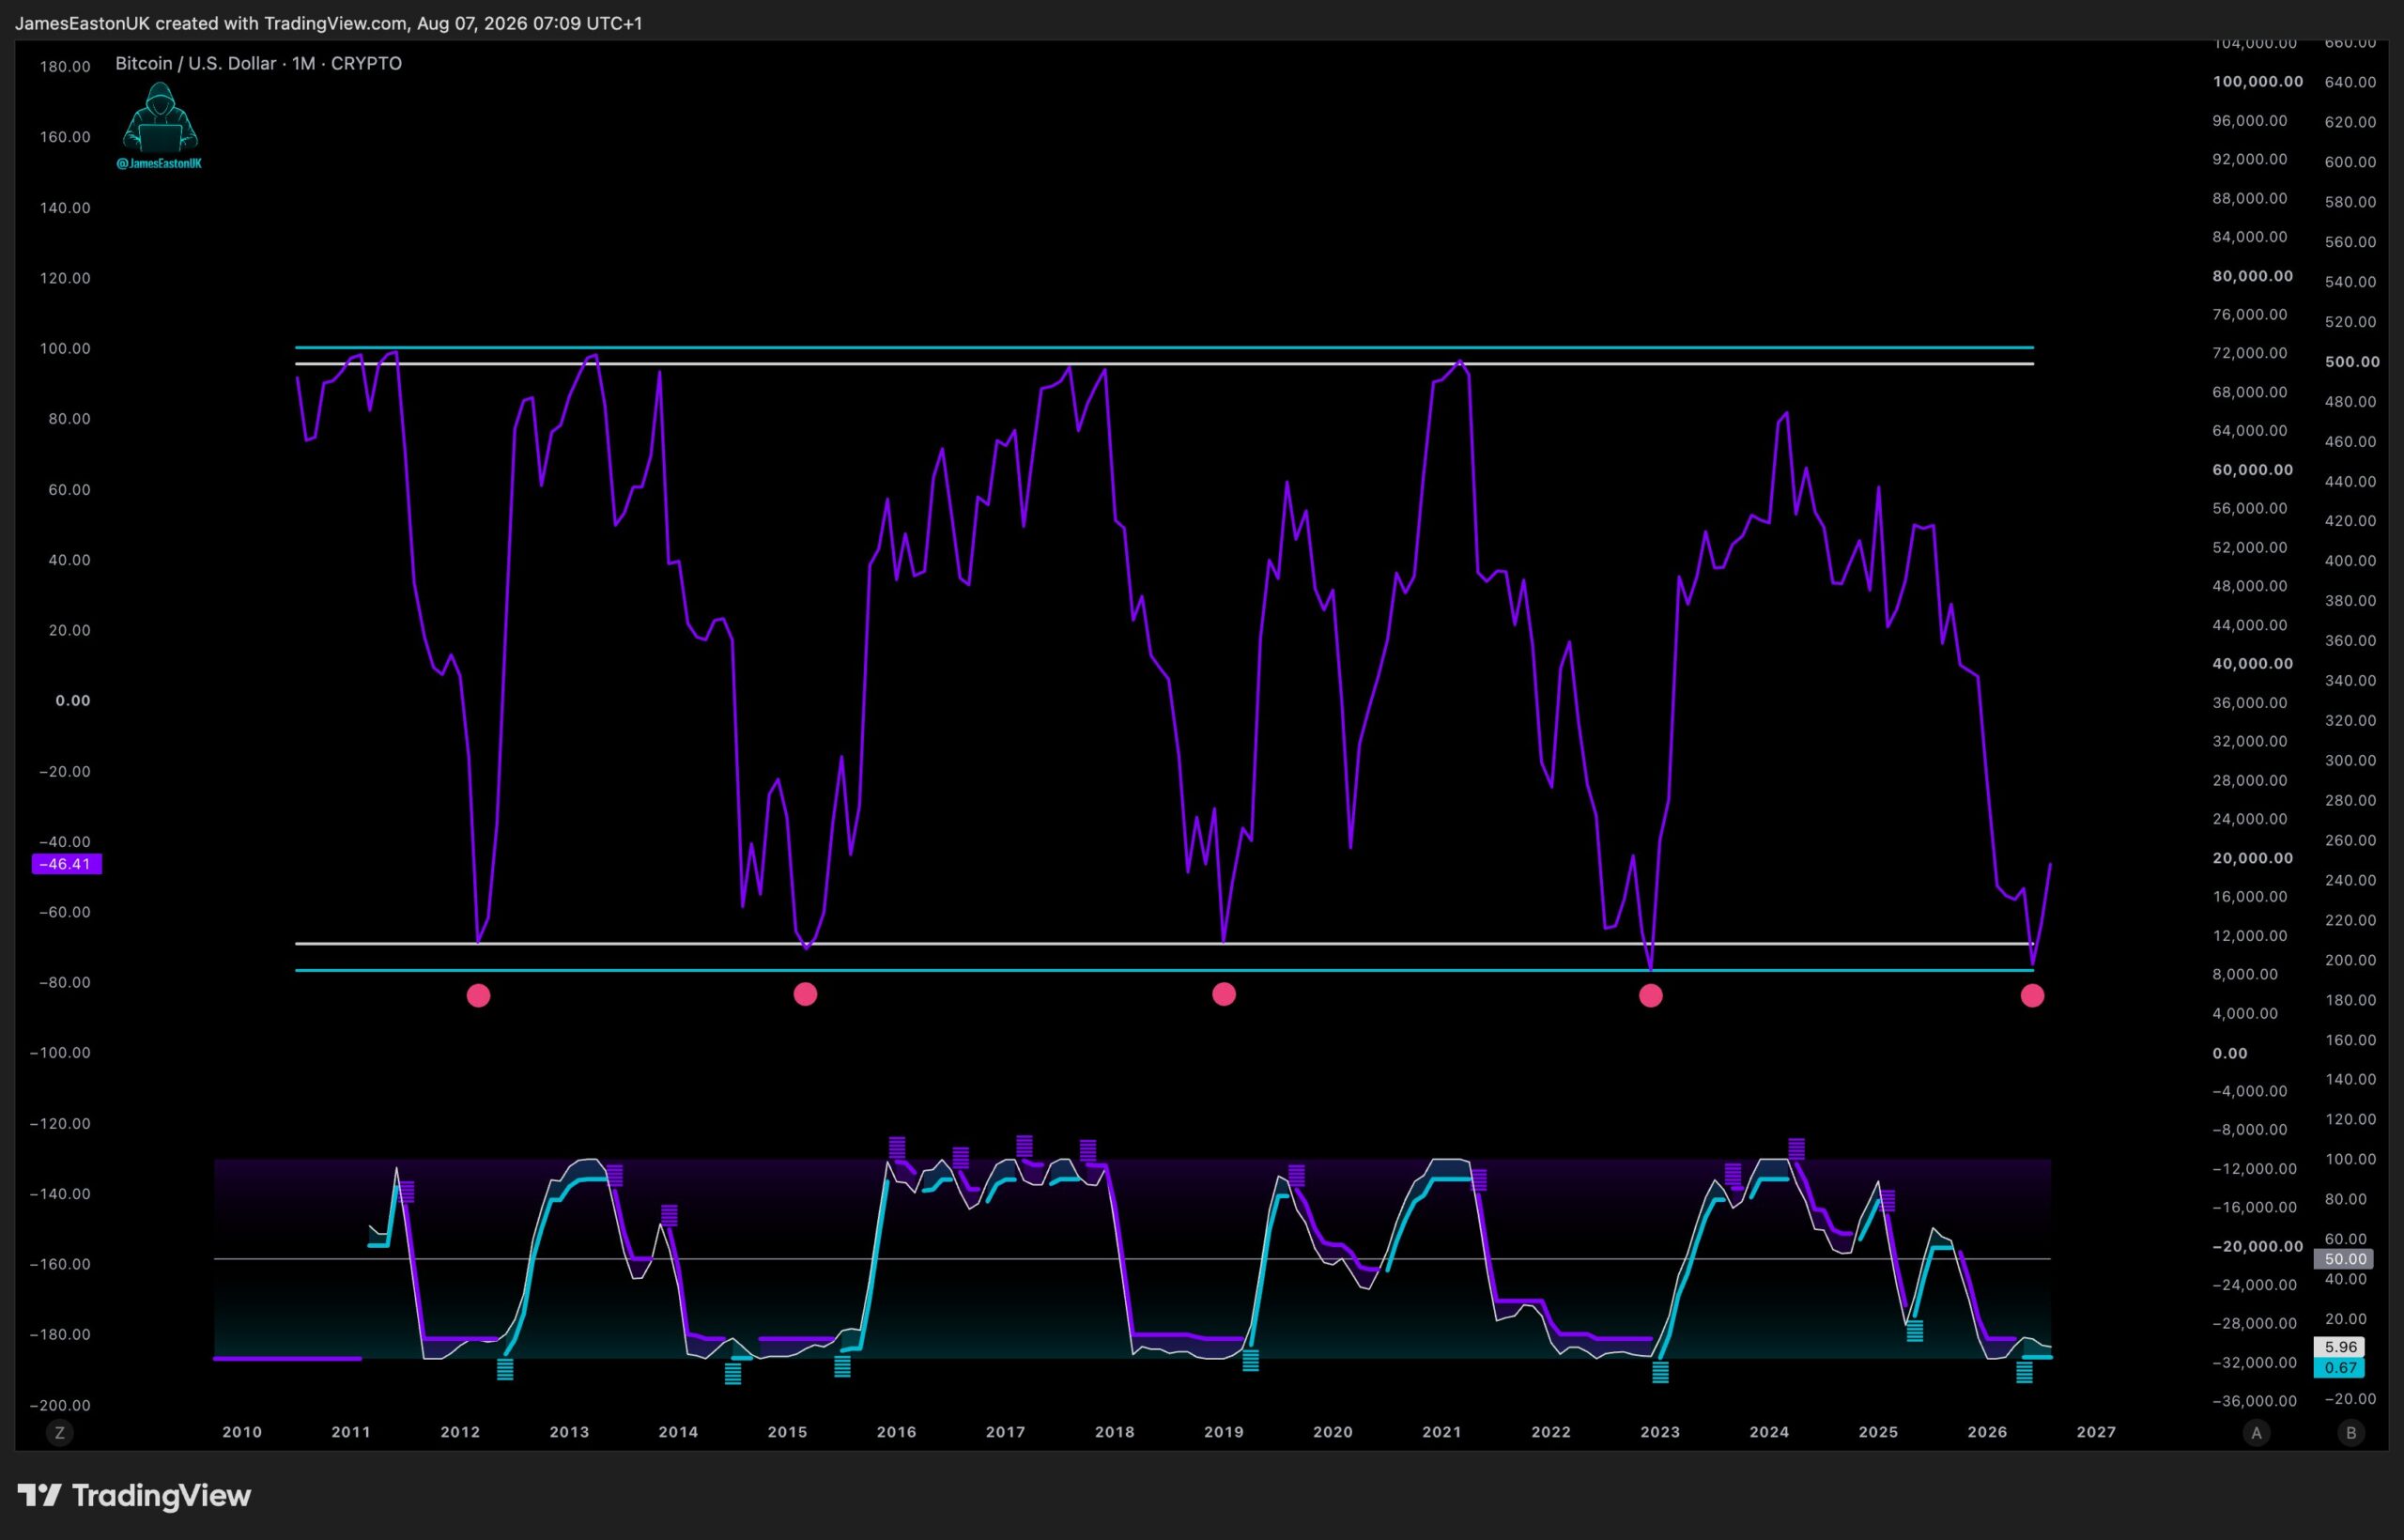
The five historic bottom zones — marked by red dots:
The chart’s red dots mark each prior instance where the monthly oscillator reached the extreme oversold zone visible at the bottom of the indicator panel. These occurred at:
| Period | Bitcoin Approximate Price | What Followed |
|---|---|---|
| Late 2011 / Early 2012 | ~$2–$3 | Major cycle bottom → Substantial rally |
| Early 2015 | ~$150–$200 | Major cycle bottom → 2017 bull run |
| Late 2018 / Early 2019 | ~$3,200 | Major cycle bottom → 2020–2021 bull run |
| Late 2022 | ~$15,500–$16,000 | Major cycle bottom → Current cycle ATH $126K |
| 2026 (Current) | ~$64,000 | Reading now matching prior bottoms |
The current reading in context:
The monthly oscillator has now dropped to the same extreme level that appeared at each of the four prior major Bitcoin cycle bottoms — with each prior instance followed by a substantial multi-month to multi-year recovery. The blue horizontal lines on the chart mark the upper resistance zone (approximately 100 on the oscillator) and the extreme oversold zone (approximately -70 to -80) — with the current reading sitting near the lower boundary.
The current position on the price chart:
Bitcoin at approximately $60,000–$64,000 on the right axis corresponds to the current oscillator reading — visible at the rightmost point of the chart where the purple oscillator line is descending toward the extreme oversold zone marked by the lower cyan horizontal line.
@JamesEastonUK’s comment accompanying the chart was direct and unambiguous:
“Most will buy higher, MUCH higher.”
The implication is consistent with every prior red dot on the chart — each appeared at a point where the majority of market participants were reducing or avoiding exposure, and each preceded a significant appreciation in Bitcoin’s value.
Why Both Signals Point the Same Direction
The on-chain divergence and the monthly technical reading are measuring fundamentally different things — yet both are identifying the same environment:
Santiment’s whale vs retail divergence measures actual holder behaviour — who is buying and who is selling in real time. It is a present-tense signal about current market participant activity.
@JamesEastonUK’s monthly oscillator measures momentum on the longest available timeframe — comparing current momentum conditions to every prior cycle in Bitcoin’s 15-year history. It is a historical context signal about where in the cycle the current reading appears.
Two frameworks. One conclusion: the current zone has historically been where informed accumulation occurs before the broader market realises it missed the bottom.
This convergence adds to the body of evidence we have been building throughout July and August 2026 — including the MVRV at the 5th percentile, the Realized Profit vs Loss crossover approaching, the 147-day weekly bullish divergence, and the Structural Market Bands support zone — each measuring the same underlying dynamic from a different angle.
Bottom Line
Bitcoin at $64,351 is sitting at the intersection of a Santiment-confirmed whale accumulation signal and a monthly momentum oscillator reading that has matched every major Bitcoin cycle bottom since 2011. Retail is selling. Whales are buying. The monthly oscillator is at extreme historic lows. These three observations are not individually conclusive — but their simultaneous appearance is the kind of convergence that, in prior cycles, has characterised the late accumulation phase before the next major directional move.
@JamesEastonUK’s observation — “Most will buy higher, MUCH higher” — is the compressed version of what the full historical chart is showing. Every prior red dot on that monthly chart was followed by a period where that statement proved accurate.
Frequently Asked Questions
What does the Bitcoin BTC whale accumulation data show?
Wallets holding 10–10,000 BTC increased holdings by +0.34% since July 29 while micro-retail wallets (under 0.01 BTC) reduced by -0.59% — the sharpest drop since December 2024 — a classic supply transfer from weak to strong hands.
What triggered the retail Bitcoin selling?
Santiment identified the Coldcard hardware wallet entropy flaw — where a firmware vulnerability led to approximately 1,360 BTC (~$87 million) being swept from affected wallets — as accelerating retail FUD and small holder exits.
What does the monthly oscillator chart show?
The monthly Bitcoin momentum oscillator has dropped to extreme oversold levels matching readings that appeared at the 2011, 2015, 2018, and 2022 cycle bottoms — each of which was followed by a substantial multi-month rally.
Is now a good time to buy Bitcoin?
On-chain and long-term technical data suggest a potential accumulation zone, but cryptocurrency markets remain highly volatile and past patterns do not guarantee future results.
The opinions and market insights shared on CoinsProbe represent the views of individual authors based on prevailing market conditions at the time of publication. Cryptocurrency investments carry significant risk and volatility. Readers are encouraged to conduct their own research and seek professional financial advice before making investment decisions. CoinsProbe and its contributors do not accept responsibility for financial losses or decisions made based on published content.
CoinsProbe may publish sponsored articles, affiliate links, or promotional collaborations. All sponsored material is clearly labeled to maintain transparency with our audience. Our editorial decisions remain fully independent, and advertising partnerships do not influence reviews, rankings, or published opinions.
Since 2023, CoinsProbe has delivered reliable insights on cryptocurrency, blockchain, and digital assets. Our content is created by experienced researchers and analysts who follow strict editorial standards focused on accuracy, transparency, and credibility. Every article is carefully reviewed and verified using trusted sources and current market data. We provide unbiased analysis and timely updates covering everything from emerging crypto projects to major industry developments.