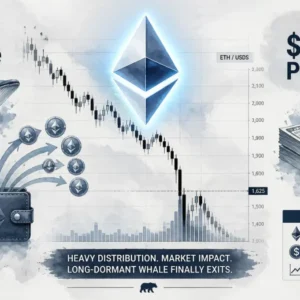

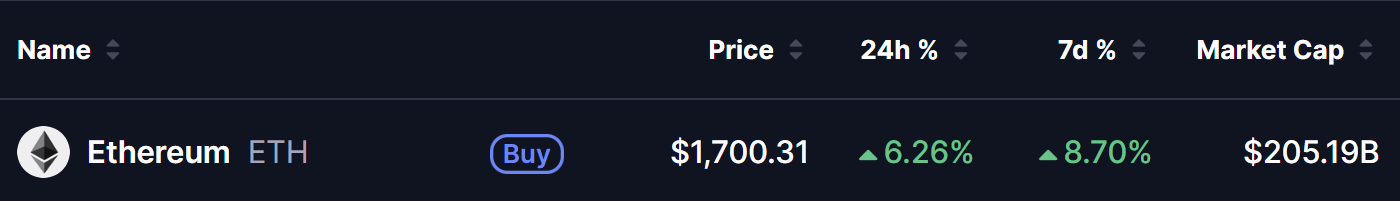
- Ethereum (ETH) is trading near $1,700, up 6.3% in 24 hours and 8.7% over the past week.
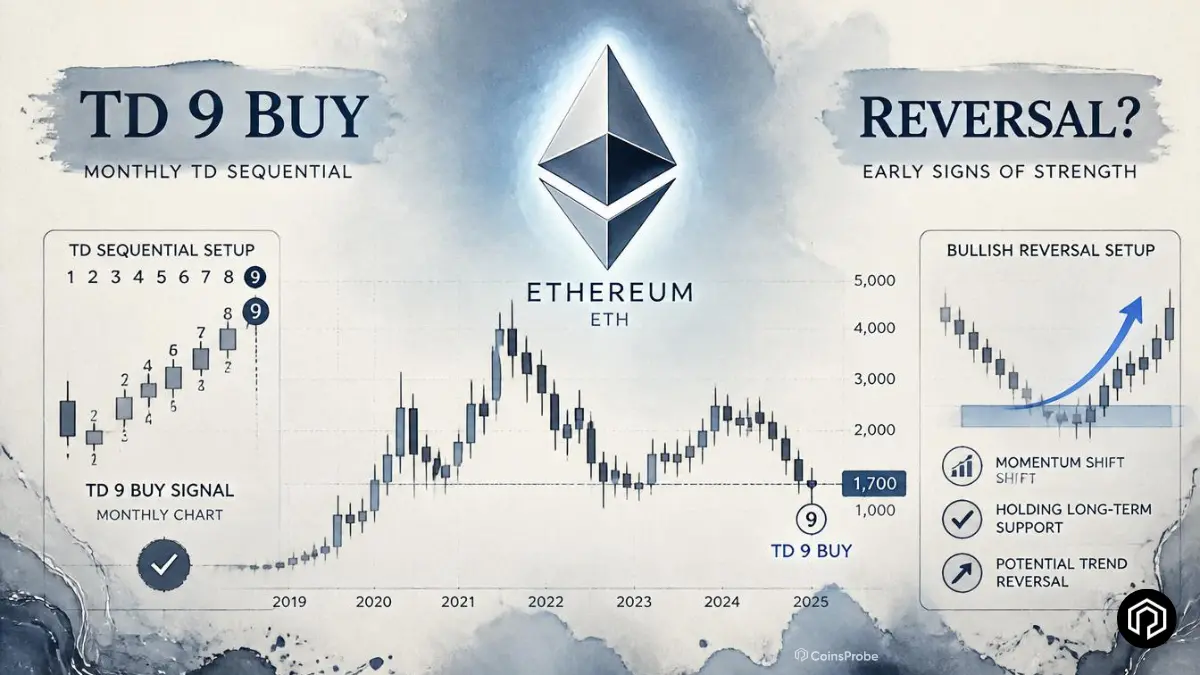
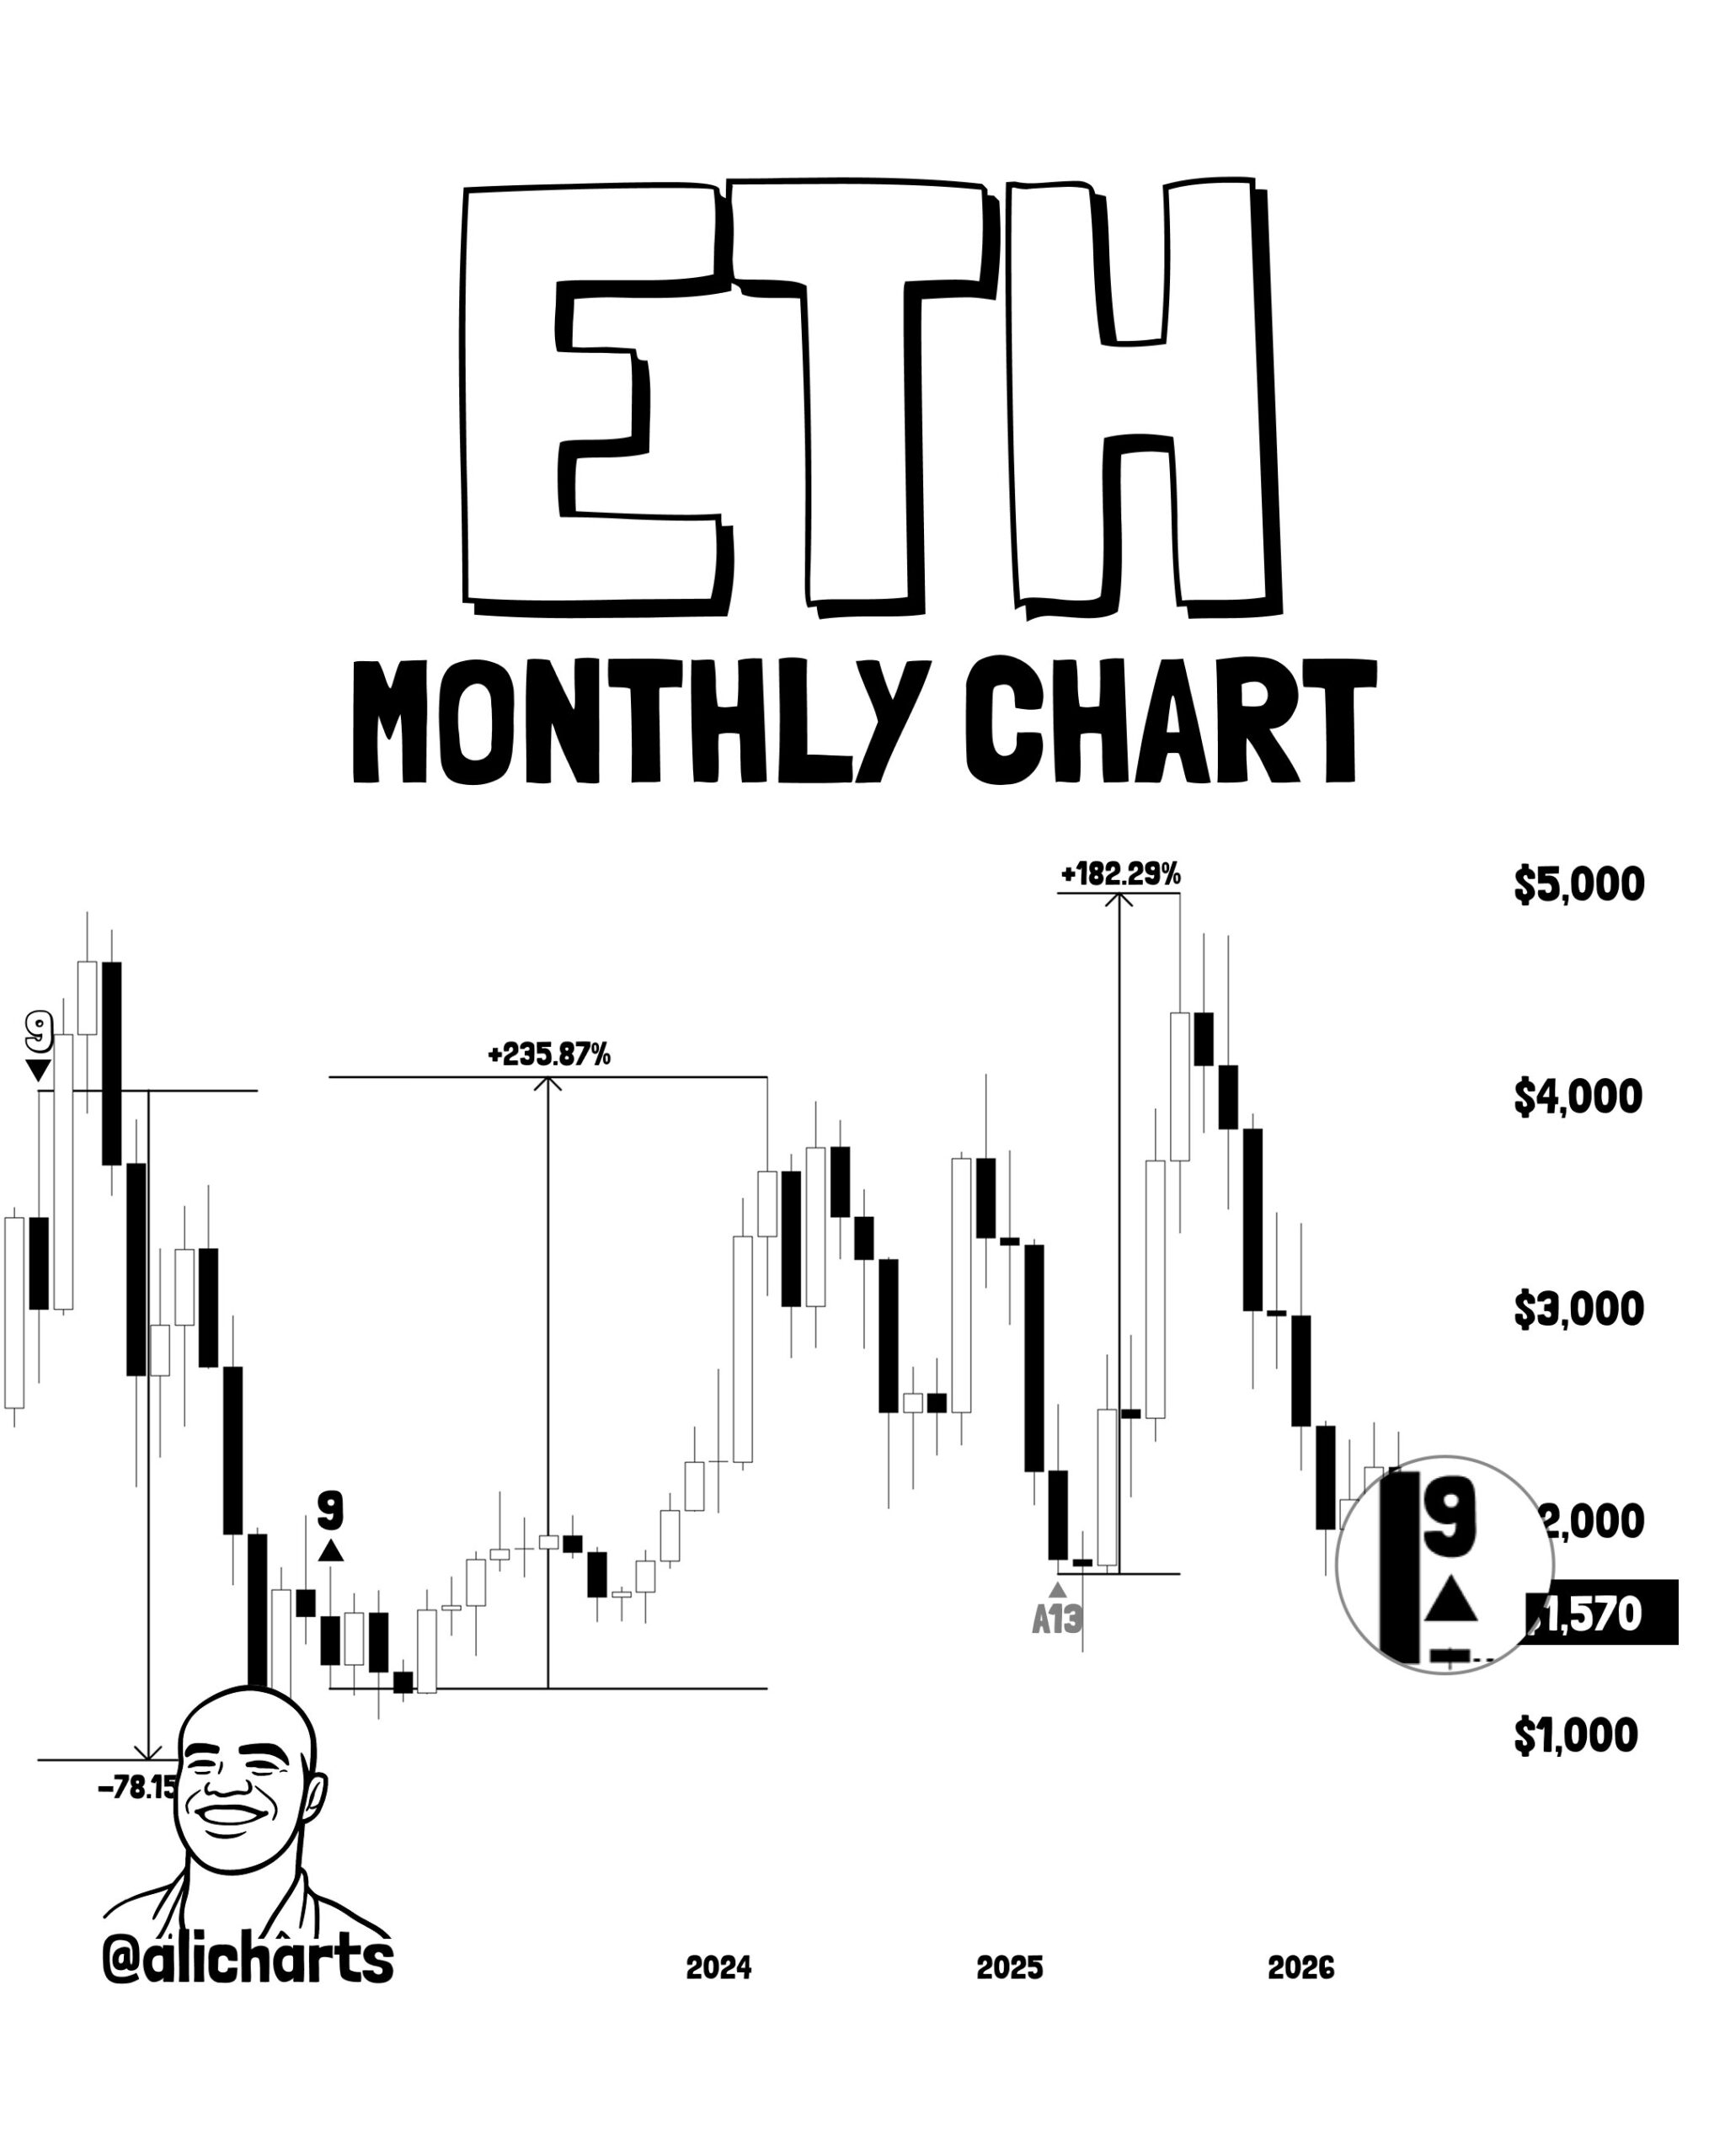
- Analyst says the TD Sequential has flashed a monthly buy signal, the first since March 2025.
- Previous monthly buy signals preceded rallies of 182% and 235%.
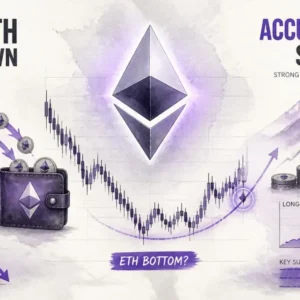
- The signal adds to growing evidence that Ethereum may be forming a market bottom.
Ethereum is opening July with one of the most historically reliable technical signals its monthly chart produces — and the timing, at the start of a new monthly candle and after a week of +8.70% price recovery, gives that signal meaningful additional weight.
ETH Price at a Glance — July 2, 2026
Ethereum is currently trading at $1,700.31, up +6.26% in the last 24 hours and +8.70% over the past 7 days. The token holds a market capitalization of approximately $205.19 billion.
The Signal — Monthly TD Sequential Buy
Analyst @alicharts highlighted that as July begins, Ethereum has printed a TD Sequential buy signal on the monthly timeframe — a development that carries substantially more weight than the same signal on daily or weekly charts, specifically because of its established historical track record on ETH’s macro price structure.
Understanding the TD Sequential monthly signal:
The Tom DeMark Sequential indicator counts a specific sequence of candles to identify points of trend exhaustion — where the prevailing directional move has run its statistical course and the probability of reversal increases meaningfully. On daily timeframes, TD Sequential signals are relatively common and carry moderate reliability. On monthly timeframes — where each candle represents an entire month of price action — the signal is far rarer and has historically carried far greater predictive significance for major trend shifts.
The Historical Track Record — Three Data Points That Matter
@alicharts specifically highlights three prior monthly TD Sequential events on Ethereum’s chart — each of which produced a consequential, directional price outcome:
September 2021 — Monthly Sell Signal at Macro Highs
The TD Sequential issued a sell signal on the monthly chart exactly at the point when ETH was approaching its cycle peak. What followed: a -78% price decline from the highs into the prolonged 2022 bear market. The signal identified seller exhaustion at the top — which in the context of a completed uptrend meant the peak had been reached.
September 2022 — Monthly Buy Signal at the Bottom
At the opposite extreme — with Ethereum deeply underwater in the bear market — the TD Sequential flipped to a buy signal on the monthly chart. What followed: a +235% rally as ETH recovered from bear market lows into the next bull cycle. This is the single most powerful historical data point for the current signal’s potential significance — a buy signal at comparable conditions of market exhaustion produced one of ETH’s most substantial percentage recoveries.
March 2025 — Monthly Buy Signal at a Corrective Low
The most recent prior instance: a monthly buy signal at a corrective low in March 2025, which preceded a +182% price expansion as Ethereum rallied from that inflection point. This data point is particularly relevant for the current reading because it demonstrates the signal’s reliability not just at major cycle bottoms but also at significant corrective lows within the broader market structure.
The summary:
| Date | Signal | Outcome |
|---|---|---|
| September 2021 | Monthly Sell | -78% decline |
| September 2022 | Monthly Buy | +235% rally |
| March 2025 | Monthly Buy | +182% expansion |
| July 2026 (current) | Monthly Buy | TBD |
Three prior signals. Three accurate outcomes — in both directions. The current reading is the fourth monthly TD Sequential signal on ETH’s chart since late 2021 — and the third buy signal in that sequence.
Why a Monthly Signal Carries More Weight Than Lower Timeframes
It is worth being explicit about the distinction between a monthly TD Sequential buy signal and the more commonly discussed daily versions — because the difference matters significantly for how to interpret the current reading.
As we covered in our TD Sequential and Morning Star Doji article for XRP, TD Sequential signals on daily timeframes typically precede 1–4 day relief bounces — short-term, tactical signals. A monthly TD Sequential signal, by contrast, is measuring trend exhaustion across multiple months of price action simultaneously — and when it resolves into a reversal, the resulting move tends to be measured in weeks to months, not days.
This is why the September 2022 buy signal produced +235% over many months, and the March 2025 signal produced +182% — these were not brief bounces, but extended directional recoveries that began from the exact monthly candle where the signal appeared.
The Broader Bottoming Evidence — Multiple Signals Converging
The monthly TD Sequential buy signal does not exist in isolation — it arrives as the latest addition to a body of evidence that has been building throughout June 2026 pointing toward an Ethereum bottoming process.
As we documented in our 500,000 ETH pulled from exchanges article — nearly half a billion dollars worth of ETH left centralised exchanges in a single week, suggesting genuine accumulation by participants moving to self-custody rather than preparing to sell. And as we covered in our Ethereum historic RSI low article — ETH’s monthly RSI reached an all-time low in recent weeks, a level never previously seen in the asset’s history, which has historically been associated with extreme oversold conditions that precede meaningful recoveries.
The TD Sequential monthly buy signal now adds a third distinct technical signal pointing toward the same conclusion — all three measuring the same underlying dynamic from different analytical frameworks:
- Exchange outflows — behavioural signal (what holders are doing with their ETH)
- Historic monthly RSI low — momentum signal (how far selling pressure has extended)
- Monthly TD Sequential buy — exhaustion signal (whether the downtrend has run its course)
Three independent frameworks. Three converging conclusions.
What This Means — And What It Doesn’t Guarantee
What the signal says: Seller exhaustion is being identified on Ethereum’s monthly chart — the same framework that correctly called the September 2022 bottom and the March 2025 corrective low. Combined with the broader evidence of accumulation and historic momentum extremes, the probability that ETH is carving out a significant bottom is meaningfully elevated relative to the prior months of this correction.
What it doesn’t guarantee: An immediate linear recovery without any further volatility. Monthly candles are just opening, and within any individual monthly candle, significant short-term price swings remain possible. As we covered in our Bitcoin DCA below the 200-week SMA article — the appropriate response to historically significant accumulation signals is disciplined, time-distributed buying rather than a single aggressive entry expecting an immediate reversal.
The key confirmation to watch: Sustained buying pressure on lower timeframes — daily and weekly — building on the monthly signal. A monthly TD Sequential buy in July becoming the foundation for a consistent series of higher lows on the weekly chart would be the most important confirmation that the signal is translating into genuine trend reversal rather than a temporary relief bounce within a larger structure.
Bottom Line
Ethereum’s monthly TD Sequential buy signal at the start of July is the most historically reliable technical signal the asset’s monthly chart produces — and its track record across September 2022 (+235%) and March 2025 (+182%) is as clear as any indicator’s historical precedent in crypto.
Combined with the 500,000 ETH exchange withdrawal accumulation signal and the historic monthly RSI low documented in June — the case for Ethereum carving out a significant bottom is now supported by three independent analytical frameworks pointing toward the same conclusion simultaneously.
The monthly signal has appeared. The historical precedents are clear. Whether this becomes ETH’s fourth confirmed major turning point on the monthly TD Sequential timeline — or requires more time and potentially another leg lower before a sustained recovery — will be determined by whether buyers can sustain the current momentum and build consistent higher lows in the weeks ahead.
Frequently Asked Questions
What is the monthly TD Sequential buy signal for Ethereum?
The Tom DeMark Sequential indicator has printed a buy signal on ETH’s monthly chart as July begins — the first monthly buy signal since March 2025, and only the third in the indicator’s history on ETH since late 2021.
What happened after the previous monthly TD Sequential buy signals?
September 2022 buy signal → +235% rally. March 2025 buy signal → +182% expansion. Both preceded significant multi-month price recoveries from the exact candle where the signal appeared.
The opinions and market insights shared on CoinsProbe represent the views of individual authors based on prevailing market conditions at the time of publication. Cryptocurrency investments carry significant risk and volatility. Readers are encouraged to conduct their own research and seek professional financial advice before making investment decisions. CoinsProbe and its contributors do not accept responsibility for financial losses or decisions made based on published content.
CoinsProbe may publish sponsored articles, affiliate links, or promotional collaborations. All sponsored material is clearly labeled to maintain transparency with our audience. Our editorial decisions remain fully independent, and advertising partnerships do not influence reviews, rankings, or published opinions.
Since 2023, CoinsProbe has delivered reliable insights on cryptocurrency, blockchain, and digital assets. Our content is created by experienced researchers and analysts who follow strict editorial standards focused on accuracy, transparency, and credibility. Every article is carefully reviewed and verified using trusted sources and current market data. We provide unbiased analysis and timely updates covering everything from emerging crypto projects to major industry developments.