
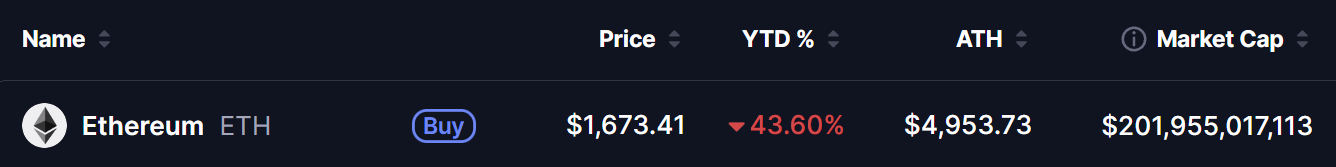
- Ethereum is trading at $1,673.41 — down -43.60% year-to-date and approximately 66% below its $4,953.73 ATH — with a market cap of approximately $201.96 billion.
- On-chain analyst flagged that nearly 500,000 ETH (~$800M) has been withdrawn from centralised exchanges in a single week — one of the sharpest recent drops in exchange reserves — a historically significant accumulation signal.
- Technical analyst identifies three simultaneous bottoming signals — the Lower Acceptance Cloud touch at $1,500, weekly RSI at 31 approaching the sub-30 threshold, and a daily RSI of 11 at the recent low — the lowest daily RSI in Ethereum's entire history.
- Both analysts stop short of calling the bottom confirmed — further downside is possible — but the confluence of on-chain and technical signals is building a case that has historically appeared near major ETH cycle lows.
Ethereum is in pain — and has been for most of 2026. But two independent signals arrived this week that deserve serious attention from anyone watching the asset closely: half a billion dollars worth of ETH left exchanges in seven days, and a technical analyst has identified a rare convergence of indicators that has only appeared at prior Ethereum cycle bottoms.
As we covered in our ETH historic RSI low article and our Ethereum whale accumulation analysis — the signals pointing toward a potential ETH bottom have been building for weeks. This week’s exchange outflow data and technical alignment add two more concrete data points to that picture.
ETH at a Glance — June 13, 2026
Signal 1 — Nearly 500,000 ETH Leaves Exchanges in One Week
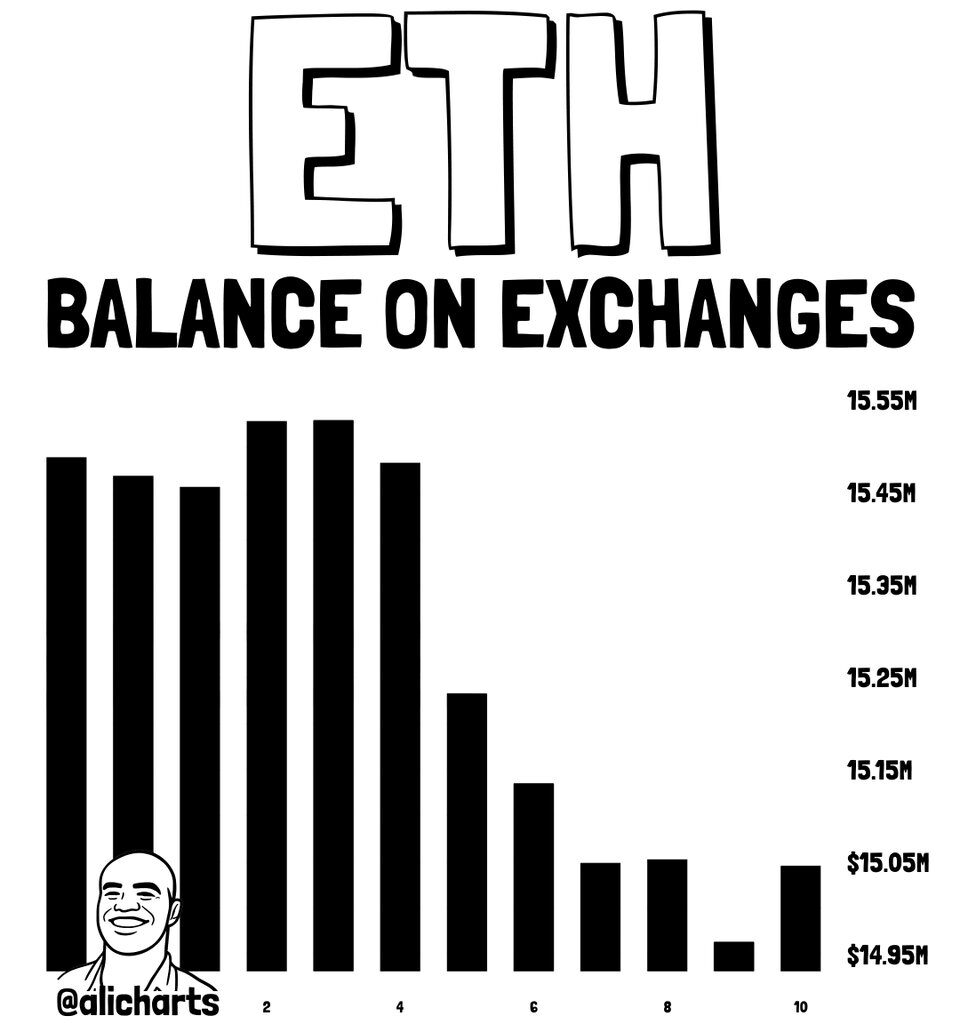
On-chain analyst @alicharts highlighted one of the most significant exchange flow developments of the current ETH cycle:
Nearly 500,000 ETH — worth approximately $800 million at current prices — has been withdrawn from centralised trading platforms in a single week.
The Glassnode chart shared by @alicharts confirms the trend visually: ETH balances held on exchanges have been declining steadily — with the past week showing one of the sharper drops in recent periods.
Why this matters in plain English:
When ETH sits on an exchange — it is available to sell immediately. When it moves to a private wallet — it is no longer immediately accessible for selling. 500,000 ETH leaving exchanges in one week means approximately $800 million worth of potential selling pressure has been removed from the immediate market.
This type of movement — large-scale ETH moving off exchanges into self-custody — has historically been associated with one thing: accumulation. Long-term holders, institutions, and large retail participants who are positioning for a multi-month or multi-year hold do not need their ETH on an exchange. They move it to cold storage because they are not planning to sell soon.
The significance of the timing: this is happening while ETH is down 43.60% year-to-date and 66% below its ATH — exactly the kind of discounted zone where historically informed accumulators have entered. As we documented in our Ethereum whale accumulation article — sophisticated participants tend to accumulate during periods of maximum fear rather than during recovery.
The historical context:
Sustained reductions in exchange ETH reserves have preceded every major Ethereum recovery phase. In 2022 — ETH exchange outflows accelerated in the months before the $880 bottom and the subsequent recovery. In 2020 — exchange outflows spiked in the weeks before the multi-month rally that took ETH from $300 to $4,300 in 12 months. The current week’s 500,000 ETH withdrawal is one of the largest single-week reductions in the current cycle.
Signal 2 — Three Technical Bottoming Indicators Aligning Simultaneously
Technical analyst @ArdiNSC (AltcoinArdi) published a detailed weekly chart breakdown this week — identifying three specific technical conditions that have historically appeared together only at major Ethereum cycle bottoms.
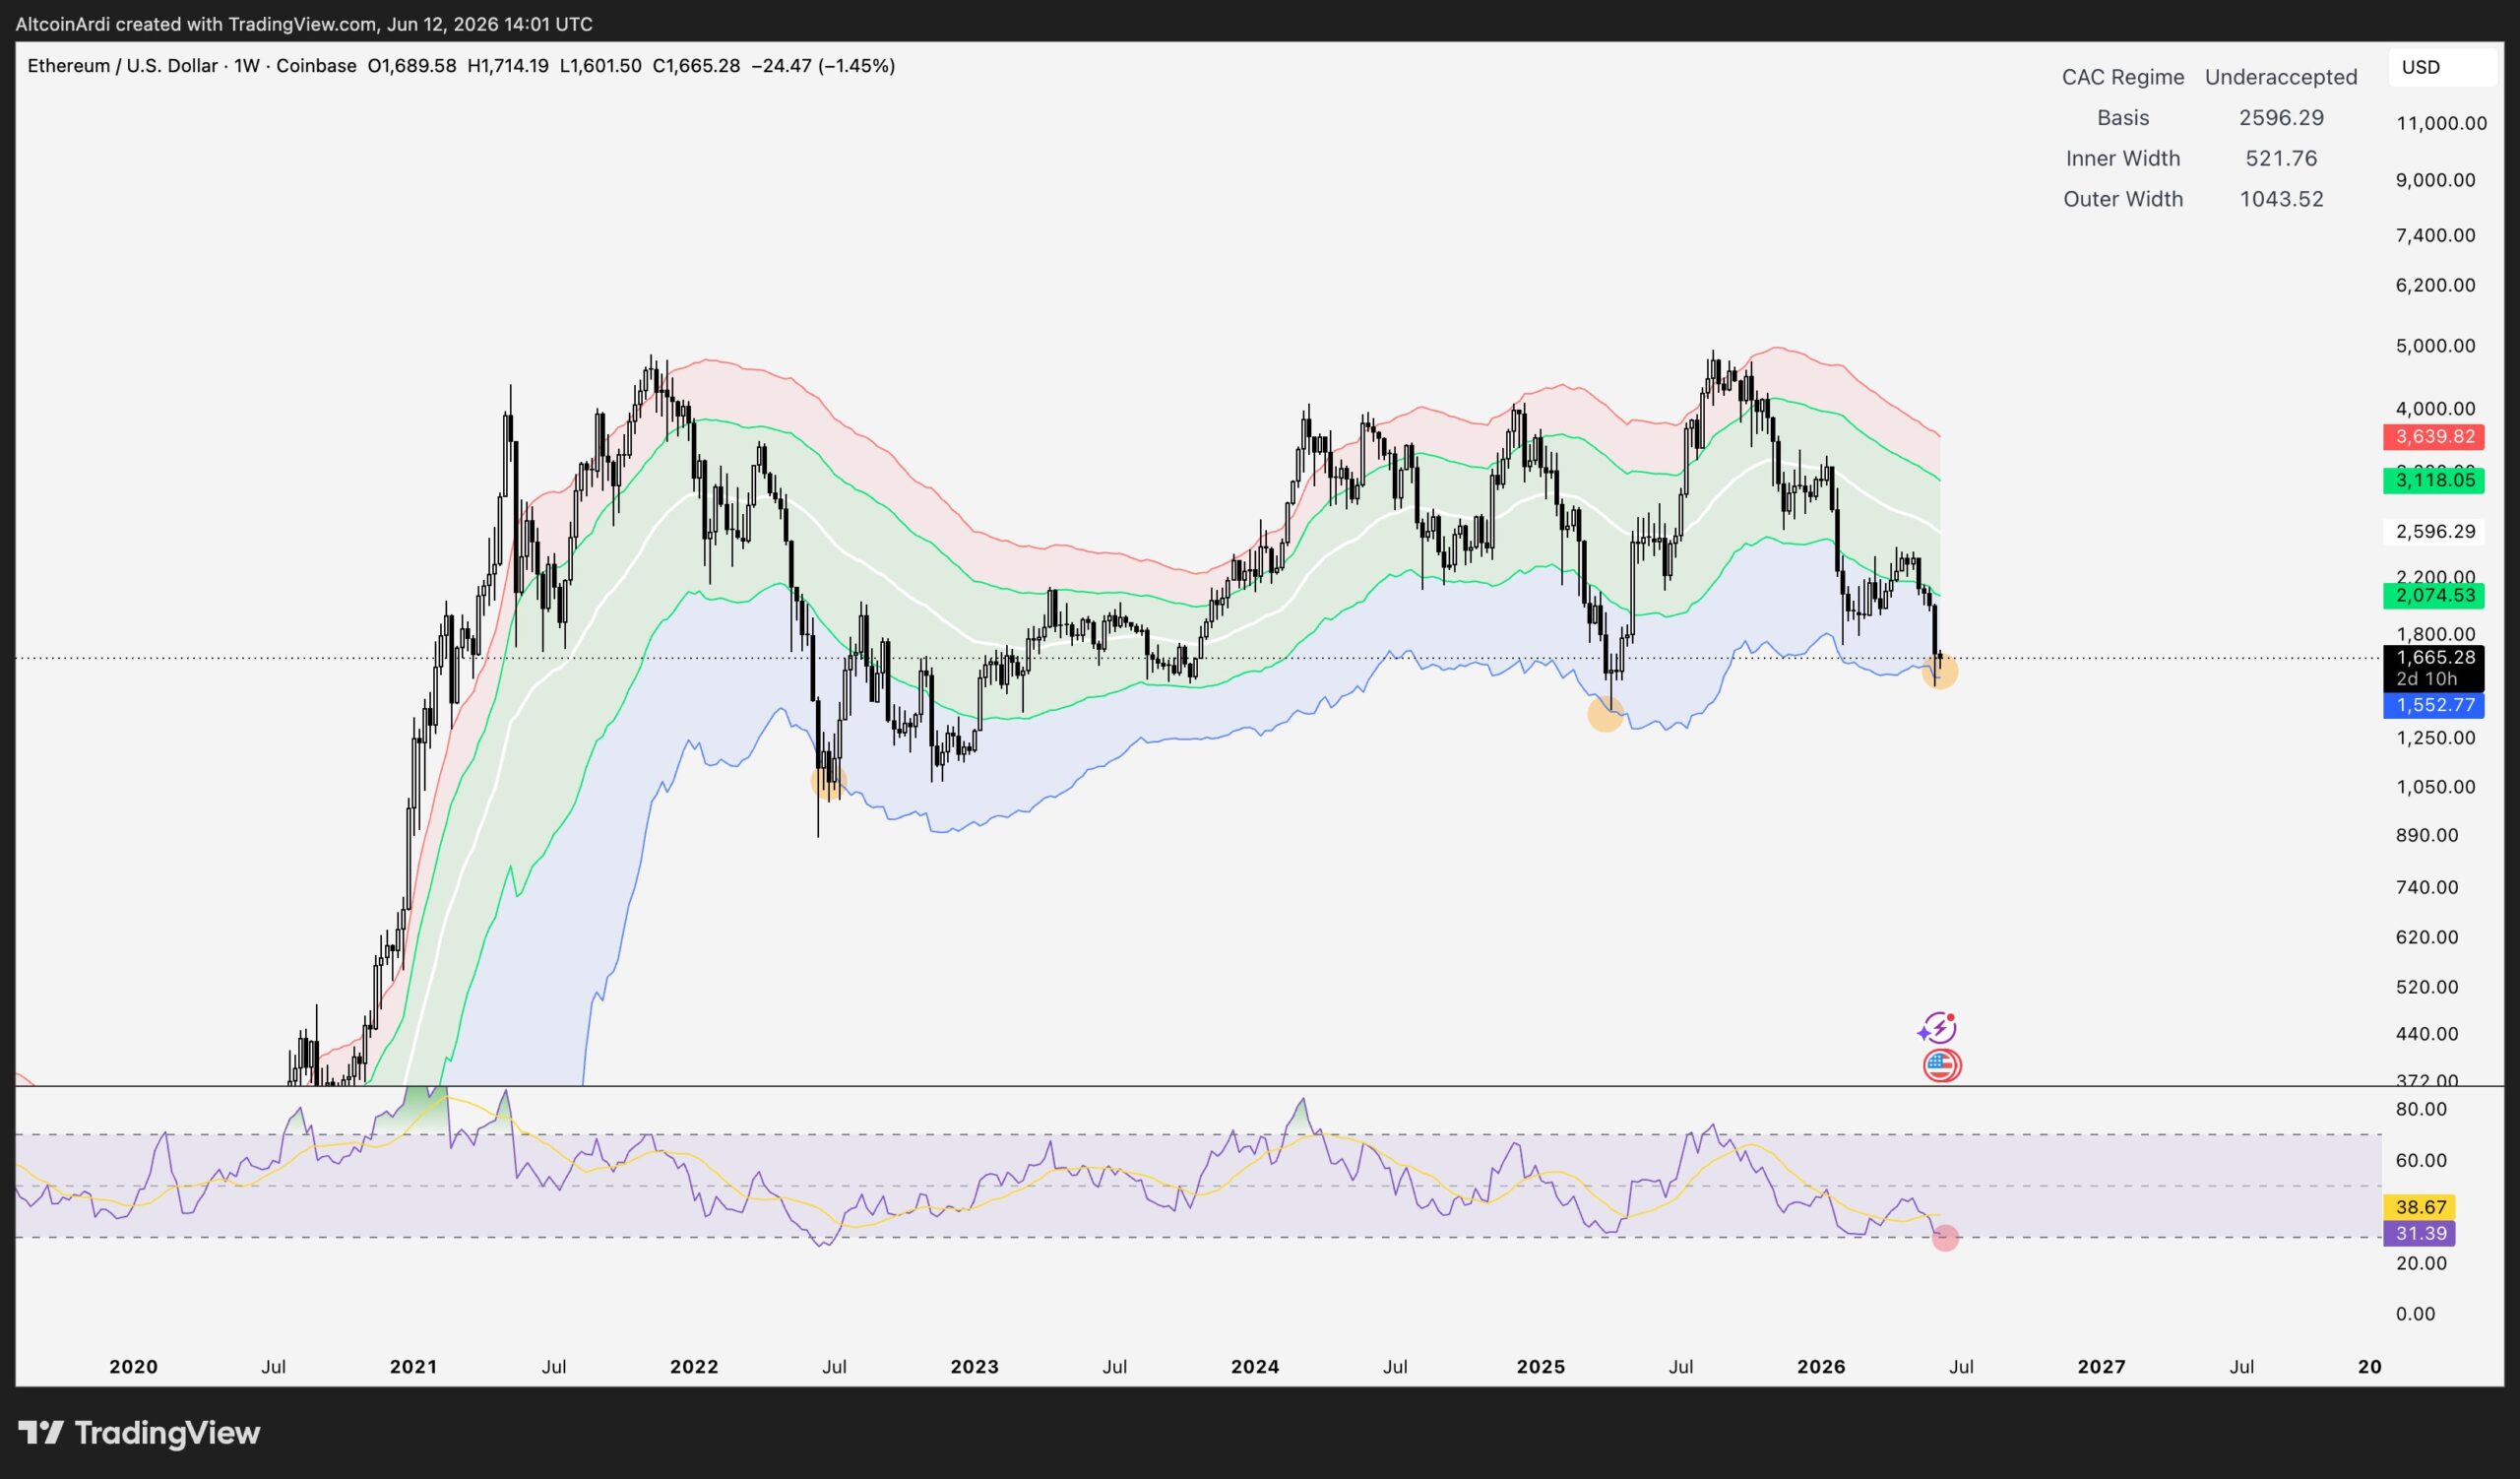
Indicator 1 — The Lower Acceptance Cloud Touch
The Lower Acceptance Cloud is a proprietary technical zone that @ArdiNSC tracks on the weekly chart. The key historical observation: every time ETH has touched the outer band of this cloud, it has marked the macro low for that cycle.
The flush toward $1,500 delivered the first touch of this cloud in the current bear market — placing current price action in the exact zone that has defined the cycle bottom in every prior instance. The cloud touch does not guarantee the low is in — but it does establish that ETH is now in the zone where macro lows have historically formed.
Indicator 2 — Weekly RSI at 31
The weekly RSI is currently sitting at 31 — approaching but not yet reaching the sub-30 threshold that has historically signalled the transition into the bottoming phase.
As we covered in our Ethereum historic RSI low article — ETH’s monthly RSI has already hit an all-time low near 40. The weekly RSI at 31 — with consecutive weeks below 30 historically marking the accumulation transition — means the weekly indicator is one sustained move away from satisfying the historical bottoming pattern.
@ArdiNSC notes this explicitly: consecutive weekly RSI readings below 30 have preceded the start of bottoming phases in prior cycles. The current reading at 31 is approaching — but not yet confirming — that threshold.
Indicator 3 — Daily RSI of 11 at the $1,500 Low
This is the most extreme data point of the three. At the recent low near $1,500 — ETH’s daily RSI plunged to 11 — the lowest daily RSI reading in Ethereum’s entire history.
As we covered in our ETH RSI data analysis — the 6 prior deepest daily RSI episodes since 2021 all produced positive returns at 30, 60, and 90 days — with a median of +7.2% at 30 days, +20.7% at 60 days, and +25.8% at 90 days. A reading of 11 is more extreme than any of those prior 6 episodes — which historically has meant more severe oversold conditions and more significant subsequent recoveries.
What Analyst Is Saying — And What He Is Not
The important nuance in @ArdiNSC’s analysis is the distinction between conditions building for a bottom and confirmation that the bottom is in:
The three indicators establish that ETH is beginning its bottoming phase — not that the low is already confirmed.
His specific caution: “true capitulation pain” may still occur once the weekly RSI fully satisfies the historical pattern by spending consecutive weeks below 30. The current setup is the beginning of the bottoming process — not necessarily the final low.
The ETH/BTC context adds nuance:
@ArdiNSC also notes that ETH/BTC remains in a downtrend — implying potential further relative weakness if Bitcoin makes new lows. The relationship matters because ETH has historically underperformed Bitcoin during the deepest bear market phases — and a Bitcoin decline toward the $50,000–$55,000 zone we covered in our Bitcoin on-chain bottom analysis could create additional pressure on ETH even as the bottoming signals build.
The prior cycle precedent:
In the previous cycle — ETH bottomed approximately 6 months before Bitcoin. If that pattern repeats — ETH finding its macro low before Bitcoin’s cycle bottom could mean the current setup is the beginning of an accumulation window that resolves on a significantly different timeline than the broader market narrative suggests.
@ArdiNSC’s personal plan:
The analyst outlined his approach: DCA meaningfully into the blue accumulation zone — the Lower Acceptance Cloud — for a medium-to-long-term hold. His cited risk-reward: approximately 12R even to the upper boundary of the zone — meaning the potential upside relative to the risk at current prices is approximately 12 to 1 by his framework.
As we covered in our Vitalik Buterin privacy roadmap article — Ethereum’s fundamental development has not paused during the price correction. The technical and on-chain signals building around the current price zone are arriving on top of a protocol that continues advancing its roadmap regardless of market conditions.
Bottom Line
Ethereum at $1,673 is sending two signals simultaneously — one from on-chain data and one from technical analysis — that have historically appeared near major cycle lows. Nearly half a billion dollars worth of ETH leaving exchanges in a single week reflects the kind of informed accumulation that has preceded prior recoveries. Three technical indicators converging at the same time — cloud touch, weekly RSI approaching sub-30, and the lowest daily RSI in ETH’s history — reflect the kind of momentum exhaustion that has marked prior bottoming phases.
Neither signal confirms the bottom is in. Further downside is possible — particularly if Bitcoin declines and ETH/BTC weakness continues. But the conditions building right now are the conditions that have historically appeared before Ethereum’s most significant recoveries.
The accumulators are moving ETH off exchanges. The technical indicators are approaching historic extremes. Watch the weekly RSI — when it spends consecutive weeks below 30, the bottoming phase historically begins in earnest.
Frequently Asked Questions
How much ETH left exchanges this week?
Nearly 500,000 ETH (~$800M) withdrew from centralised exchanges in a single week — one of the sharpest exchange reserve drops in the current cycle — flagged by @alicharts using Glassnode data.
What are the three $ETH technical bottoming signals?
The Lower Acceptance Cloud touch at $1,500 (marks macro low zone historically), weekly RSI at 31 approaching sub-30 (bottoming threshold), and daily RSI of 11 at the recent low — the lowest in ETH’s entire history.
Does this confirm ETH has bottomed?
No — analyst specifically states these signals mark the beginning of a bottoming phase — not confirmation the low is in. Further downside is possible especially if Bitcoin declines and ETH/BTC weakness continues.
The opinions and market insights shared on CoinsProbe represent the views of individual authors based on prevailing market conditions at the time of publication. Cryptocurrency investments carry significant risk and volatility. Readers are encouraged to conduct their own research and seek professional financial advice before making investment decisions. CoinsProbe and its contributors do not accept responsibility for financial losses or decisions made based on published content.
CoinsProbe may publish sponsored articles, affiliate links, or promotional collaborations. All sponsored material is clearly labeled to maintain transparency with our audience. Our editorial decisions remain fully independent, and advertising partnerships do not influence reviews, rankings, or published opinions.
Since 2023, CoinsProbe has delivered reliable insights on cryptocurrency, blockchain, and digital assets. Our content is created by experienced researchers and analysts who follow strict editorial standards focused on accuracy, transparency, and credibility. Every article is carefully reviewed and verified using trusted sources and current market data. We provide unbiased analysis and timely updates covering everything from emerging crypto projects to major industry developments.