
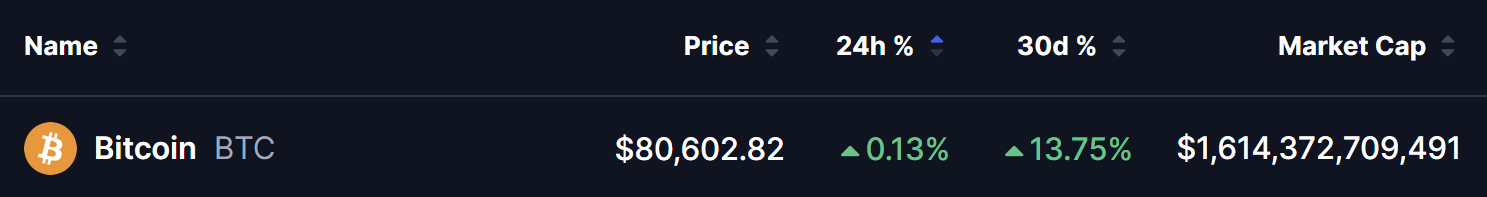
- Bitcoin is trading at $80,602 — up +0.13% in 24 hours and +13.75% over 30 days — with a market cap of approximately $1.614 trillion.
- Despite hotter-than-expected U.S. CPI data — April inflation at 3.8% vs a 3.7% forecast — BTC held steady near the $80K zone with the sell-off driven by $1.25 billion in leveraged derivatives unwinding rather than spot selling.
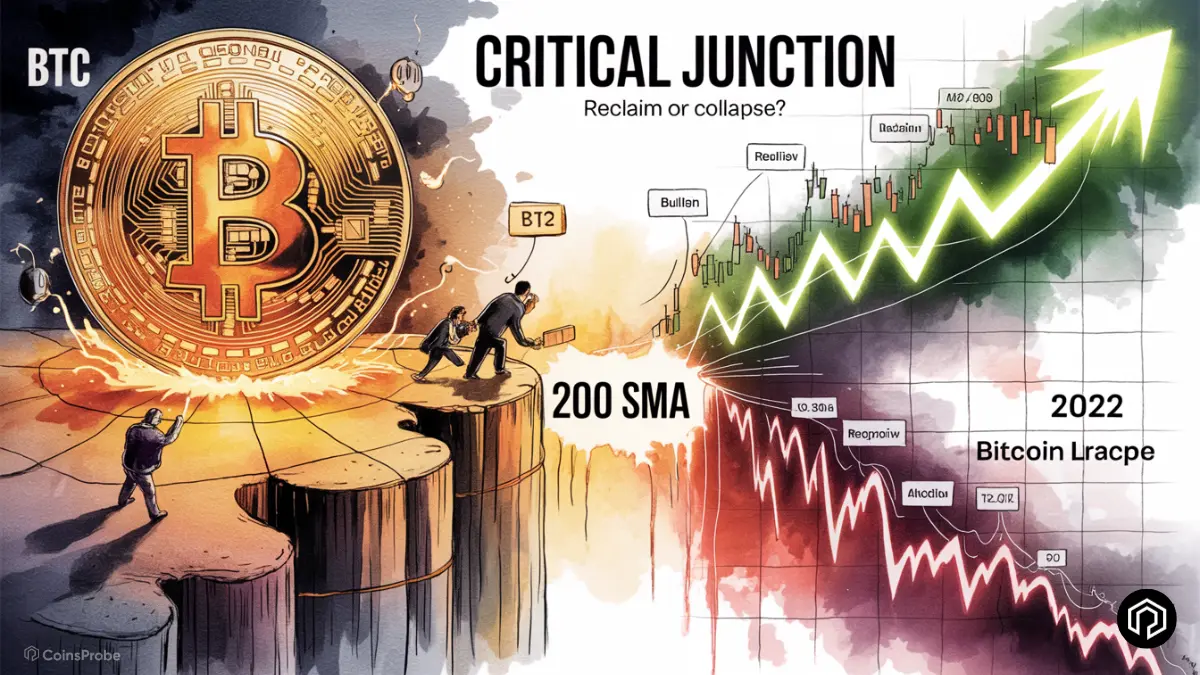
- A striking 2022 vs 2026 bearish fractal shows Bitcoin mirroring the same pattern — a -52.52% correction in 2022 from $69,198 ATH and a -52.62% correction in 2026 from $126,208 ATH — both now retesting the 200-day SMA as the critical decision level.
- Bullish: A weekly close above the 200 SMA at ~$82,333 invalidates the fractal and targets $98,000+. Bearish: A break below the 100 SMA at ~$71,783 confirms the fractal and opens the door to a significantly deeper correction.
Bitcoin continues to demonstrate resilience at a level that matters enormously — and the chart comparison that we put together may be the most important technical reference point in the market right now.
Trading at $80,602 on May 13, 2026, BTC is holding its ground near the $80K zone despite macro headwinds — but the 200-day SMA sitting just above at $82,333 is the line that will decide whether the current recovery is the beginning of a new trend or a textbook repeat of 2022’s most painful sequence.
Bitcoin Holds Through Hot CPI — But the Sell-Off Tells a Story
The latest U.S. CPI data for April delivered an unwelcome surprise — annual inflation rising to 3.8% against a forecast of 3.7%, with core inflation holding near 2.8%. The figures briefly pressured risk assets and pushed Federal Reserve rate-cut expectations further into the future — not the environment bulls were hoping for heading into the second half of May.
Yet Bitcoin held near $80K through the data release — and the composition of the subsequent sell-off matters significantly. On-chain data from CryptoQuant shows the hot CPI print triggered approximately $1.25 billion in Bitcoin derivatives de-risking — a decline in open interest consistent with leveraged positions being unwound rather than spot holders selling. This distinction is critical:
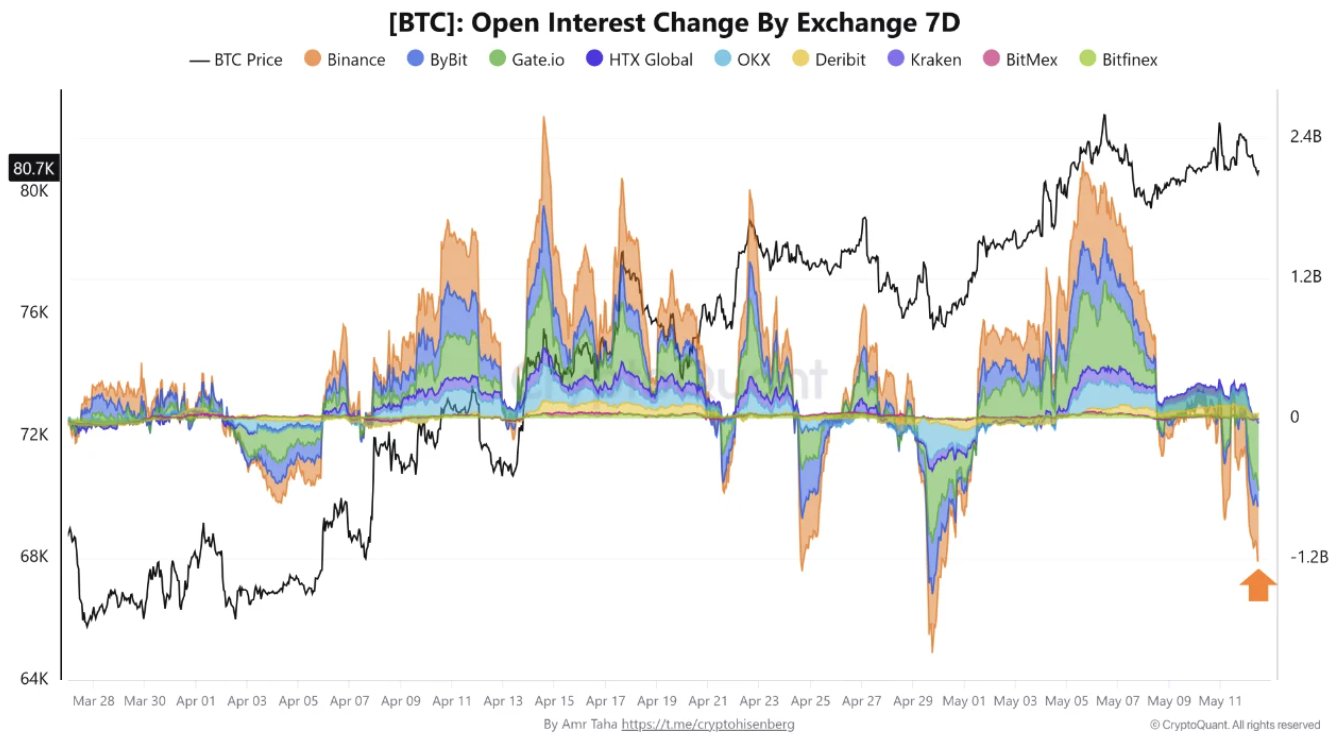
Leveraged unwind = traders reducing risk on borrowed positions — temporary and mechanical Spot selling = genuine holders exiting — a much more bearish structural signal
The fact that BTC absorbed a macro miss and a $1.25 billion derivatives flush while holding $80,000 is a meaningful sign of underlying demand — not weakness. As we covered in our Bitcoin ascending triangle and channel breakout analysis, the structural recovery from the $60,061 February low remains intact — and today’s price action is consistent with that broader thesis.
The CoinsProbe $BTC Bearish Fractal — 2022 vs 2026
The most important technical observation of the current market sits in the side-by-side comparison of Bitcoin’s 2022 cycle and the current 2026 structure. The similarity is not approximate — it is striking.
2022 Cycle — The Template
- ATH: $69,198
- Correction: -52.52% — dropping to a low near $32,853
- Relief bounce — price recovered and rallied back to test the 200-day SMA
- Rejected at 200 SMA in March 2022 — buyers failed to reclaim the level
- Breakdown below 100 SMA — confirmed the bear market was intact
- Eventual bottom: $16,520 — a further -50%+ decline from the 200 SMA rejection
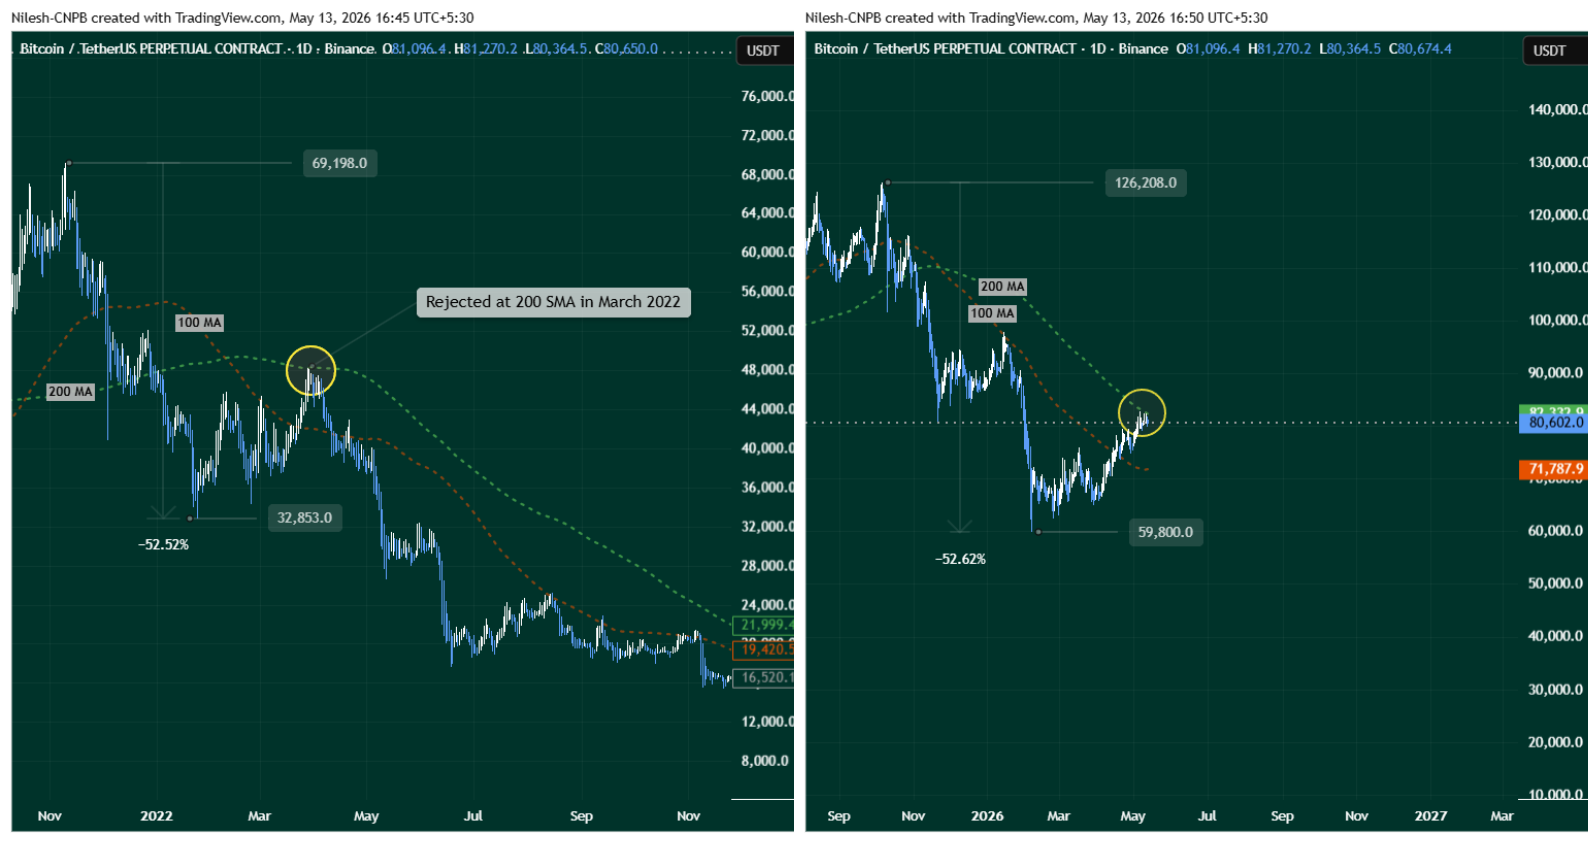
2026 Cycle — The Mirror
- ATH: $126,208
- Correction: -52.62% — an almost identical percentage decline — dropping to a low near $59,800
- Relief bounce — price has recovered and rallied back to test the 200-day SMA at approximately $82,333
- Currently testing the 200 SMA — buyers are fighting to reclaim the level but have not decisively broken above it yet
The two corrections are separated by four years and a factor of roughly 2x in price — but the percentage structure, the moving average sequence, and the pattern of action are nearly identical. The yellow circles on both charts mark the same moment: the 200 SMA retest that decided the 2022 bear market’s continuation — and is now deciding the 2026 outcome.
The 200 SMA — The Most Critical Level in the Market Right Now
The 200-day Simple Moving Average at approximately $82,333 is not just another technical indicator. It is the most widely watched trend-defining level in all of financial markets — used by institutional traders, algorithmic systems, and traditional finance participants as the definitive separator between a bullish and bearish macro trend.
In 2022, Bitcoin tested this level and was rejected. What followed was one of the most devastating crypto bear markets in history — taking BTC from the 200 SMA rejection zone all the way to $16,520.
In 2026, Bitcoin is testing this level again — from almost exactly the same structural position, following almost exactly the same percentage correction. The question the market is answering right now is whether the outcome will be the same.
Buyers are clearly present — the hold at $80,000 through the CPI miss and the derivatives flush is evidence of that. But presence is not the same as dominance. Until BTC closes a weekly candle decisively above $82,333, the bearish fractal remains the more structurally supported scenario.
What’s Next for Bitcoin — Two Scenarios
Bullish Scenario — Fractal Invalidated
A weekly close above the 200 SMA at $82,333 would be the decisive signal that the 2022 fractal comparison has broken down — that 2026’s structure is fundamentally different and the recovery is genuine rather than a relief bounce into overhead resistance.
In this scenario the first major target is the $98,000 area — a level that would represent a full reclaim of the prior cycle’s mid-range and set up a potential challenge of the $126,208 all-time high if macro conditions improve. As we detailed in our Bitcoin $85K Fibonacci barrier analysis, a weekly MACD crossover signal has historically preceded multi-month rallies of 35–146% — and that signal is already active from the April 13 crossover.
Bearish Scenario — Fractal Confirmed
If buyers fail to reclaim the 200 SMA and price breaks below the 100 SMA at approximately $71,783 on a sustained daily or weekly close, the bearish fractal is confirmed. This would signal that the current relief bounce — like March 2022’s — was a distribution opportunity rather than a genuine trend reversal.
In this scenario the fractal points toward a significantly deeper correction — potentially targeting the $30,000 region as the full bear market plays out in structural parallel to 2022’s path from the 200 SMA rejection to the $16,520 cycle low.
Bottom Line
Bitcoin has once again demonstrated resilience against hotter-than-expected inflation data — absorbing a $1.25 billion derivatives flush while holding $80,000. But the CoinsProbe bearish fractal chart makes the stakes of the current 200 SMA battle impossible to ignore.
In 2022, BTC corrected -52.52% from its ATH, rallied to test the 200 SMA, was rejected, and then dropped to $16,520. In 2026, BTC has corrected -52.62% from its ATH and is now rallying to test the same 200 SMA from almost exactly the same structural position.
The fractal does not guarantee the same outcome — but it defines exactly what the market needs to see to invalidate it. A weekly close above $82,333 changes everything. Failure to hold the 100 SMA at $71,783 confirms it.
The coming weeks are critical. Watch the weekly candles at the 200 SMA — that is the signal that will define Bitcoin’s direction for the rest of 2026.
Frequently Asked Questions (FAQ)
What is the 2022 vs 2026 Bitcoin bearish fractal?
It compares Bitcoin’s current correction with the 2022 bear market, where both declines reached roughly 52% from their all-time highs before testing key resistance levels.
Why is the 200-day SMA important for Bitcoin?
The 200-day SMA is a major long-term trend indicator. Reclaiming it could signal a bullish reversal, while rejection may strengthen bearish momentum.
Why did Bitcoin remain above $80K after hot CPI data?
Most of the selling came from leveraged derivatives liquidations rather than large spot-market selling by long-term holders.
What is the bullish target if BTC reclaims the 200 SMA?
A confirmed move above the 200-day SMA could open the path toward the $98,000 resistance zone.
What could confirm the bearish fractal?
A sustained break below the 100-day SMA near $71,783 would strengthen the bearish outlook.
The opinions and market insights shared on CoinsProbe represent the views of individual authors based on prevailing market conditions at the time of publication. Cryptocurrency investments carry significant risk and volatility. Readers are encouraged to conduct their own research and seek professional financial advice before making investment decisions. CoinsProbe and its contributors do not accept responsibility for financial losses or decisions made based on published content.
CoinsProbe may publish sponsored articles, affiliate links, or promotional collaborations. All sponsored material is clearly labeled to maintain transparency with our audience. Our editorial decisions remain fully independent, and advertising partnerships do not influence reviews, rankings, or published opinions.
Since 2023, CoinsProbe has delivered reliable insights on cryptocurrency, blockchain, and digital assets. Our content is created by experienced researchers and analysts who follow strict editorial standards focused on accuracy, transparency, and credibility. Every article is carefully reviewed and verified using trusted sources and current market data. We provide unbiased analysis and timely updates covering everything from emerging crypto projects to major industry developments.