
- Bitcoin's Short-Term Holder (STH) inflows to Binance have collapsed to just 25,000 BTC (7-day sum) — the lowest level in years — a pattern that has historically preceded every major Bitcoin recovery since 2018.
- The 2022 fractal identified by analyst @quantum_ascend shows striking structural similarities between BTC's current price action and the 2022 bear market consolidation zone — the same setup that preceded BTC's eventual recovery and bull run.
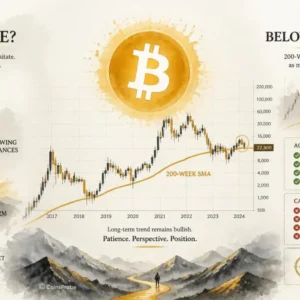
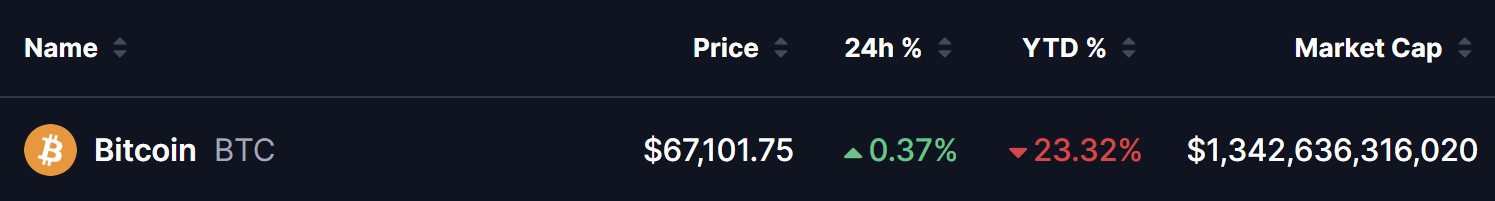
- BTC is trading at $67,101.75 — down 23.32% YTD amid persistent geopolitical tensions and broader market weakness — but the on-chain and technical signals suggest the worst of the reactive selling may already be behind us.
- Bullish confirmation requires a daily close above $76K — while a breakdown below $60K would invalidate the recovery thesis entirely.
Bitcoin is showing early signs of stabilization in late March 2026 — with a critical on-chain bottom signal flashing for the first time in years and a technical fractal aligning almost perfectly with the 2022 bear market structure that preceded one of BTC’s most powerful recoveries. While the year-to-date performance remains deeply negative, the convergence of these two independent signals is drawing serious attention from analysts and long-term investors heading into Q2 2026.
As of March 28, 2026, Bitcoin is trading at $67,101.75, up a modest +0.37% in the past 24 hours but down 23.32% year-to-date, with a market capitalization of approximately $1.34 trillion.
Despite a modest +0.37% recovery in the past 24 hours, Bitcoin’s 23.32% year-to-date decline reflects the sustained pressure created by escalating geopolitical tensions — particularly the ongoing US-Israel-Iran conflict — and broader risk-off sentiment across global markets.
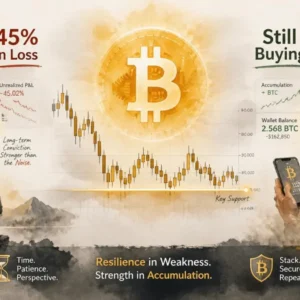
As we covered in our Bitcoin whale accumulation analysis, large wallets have been quietly accumulating 61,568 BTC over the past month even as price remains under pressure — a divergence that adds further context to the on-chain bottom signals now emerging from short-term holder data.
On-Chain Signal — STH Inflows on Binance Hit Multi-Year Lows
One of Bitcoin’s most historically reliable bottom indicators is now flashing — and it has captured the attention of the on-chain analytics community.
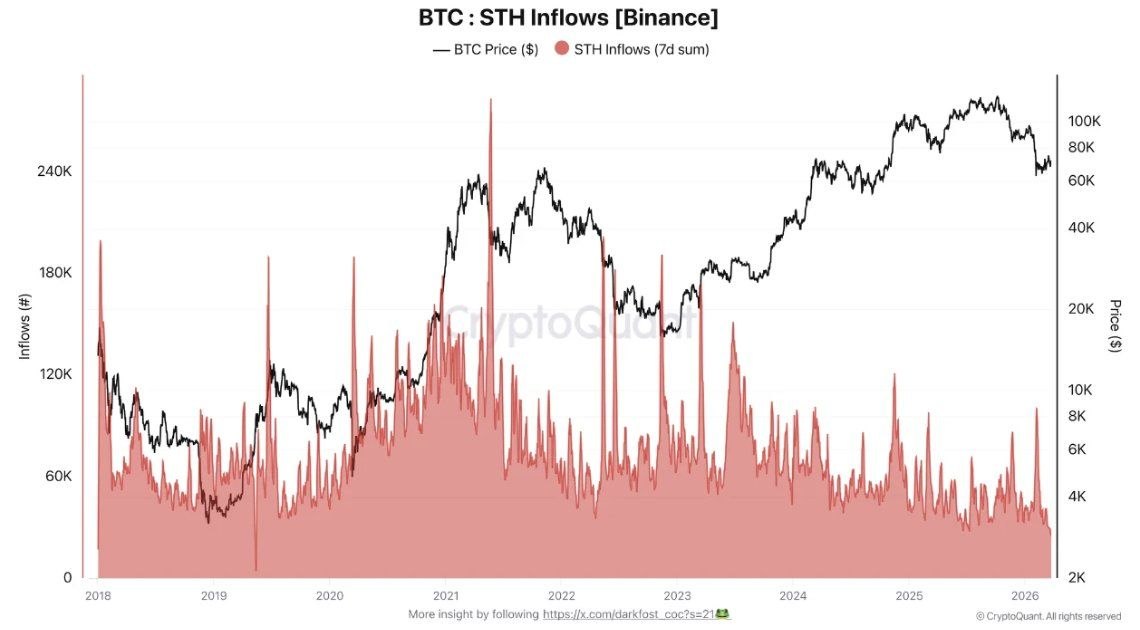
According to data shared by prominent analyst @AltCryptoGems via CryptoQuant, Short-Term Holder (STH) inflows to Binance have collapsed to just 25,000 BTC on a 7-day sum basis — the lowest reading in years across the entire dataset stretching back to 2018.
What Are Short-Term Holders and Why Do They Matter?
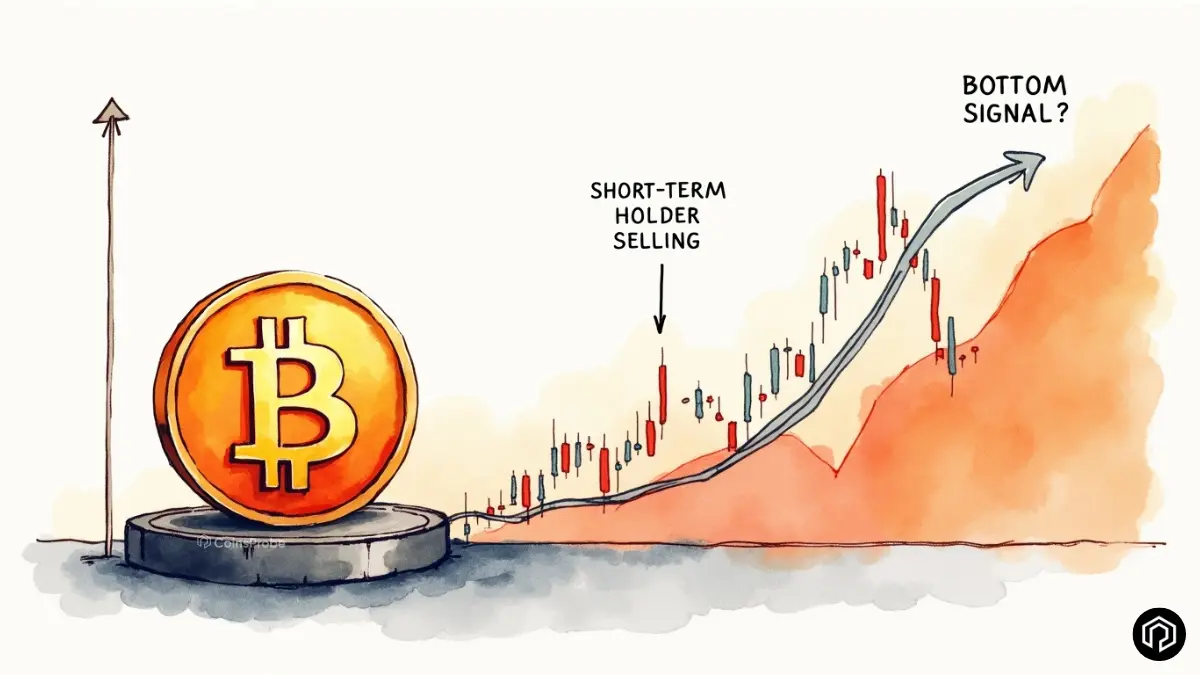
Short-Term Holders are defined as wallets that have held Bitcoin for less than 155 days — the most reactive and sentiment-driven segment of the Bitcoin market. This cohort is characterized by:
- Being the first to panic-sell during sharp price declines
- Being the most sensitive to local price action and negative news cycles
- Historically driving the majority of exchange inflows during capitulation events
When STH inflows to exchanges spike sharply — as seen during the 2021 and 2022 bear market peaks — it signals mass panic selling as short-term holders rush to exit positions. Conversely, when STH inflows collapse to multi-year lows — as they are now — it signals that the most reactive sellers have already exited the market.
What the Chart Shows:
Looking at the BTC: STH Inflows [Binance] chart from CryptoQuant covering 2018 to 2026:
- 2018–2019: STH inflows spiked dramatically as BTC crashed from $20K to $3,156 — then collapsed to multi-year lows precisely at the cycle bottom before the 300% recovery
- 2021–2022: STH inflows hit extreme highs during the bull market peak and subsequent crash — before collapsing ahead of the eventual 2023 recovery
- March 2026: STH inflows have now collapsed to 25,000 BTC (7-day sum) — matching the low-inflow environment that preceded every major Bitcoin recovery in the dataset
The historical pattern is consistent across every cycle — when STH inflows drop to these levels while price remains near lows, it has preceded every significant Bitcoin recovery since 2018 without exception.
As analyst @AltCryptoGems summarizes: the most likely sellers have already exited. Panic selling is fading — and historically, this is precisely the environment where major cycle bottoms form.
Important caveat: This is a probabilistic signal — not a guaranteed buy indicator. The STH inflow collapse signals that reactive selling is exhausting, but it does not pinpoint the exact timing or price level of the bottom.
BTC Fractal — Is 2026 Repeating the 2022 Setup?
Independently of the on-chain data, a compelling technical fractal identified by analyst @quantum_ascend — who has been tracking this pattern publicly for over a month — adds a second layer of confluence to the current Bitcoin bottom thesis.
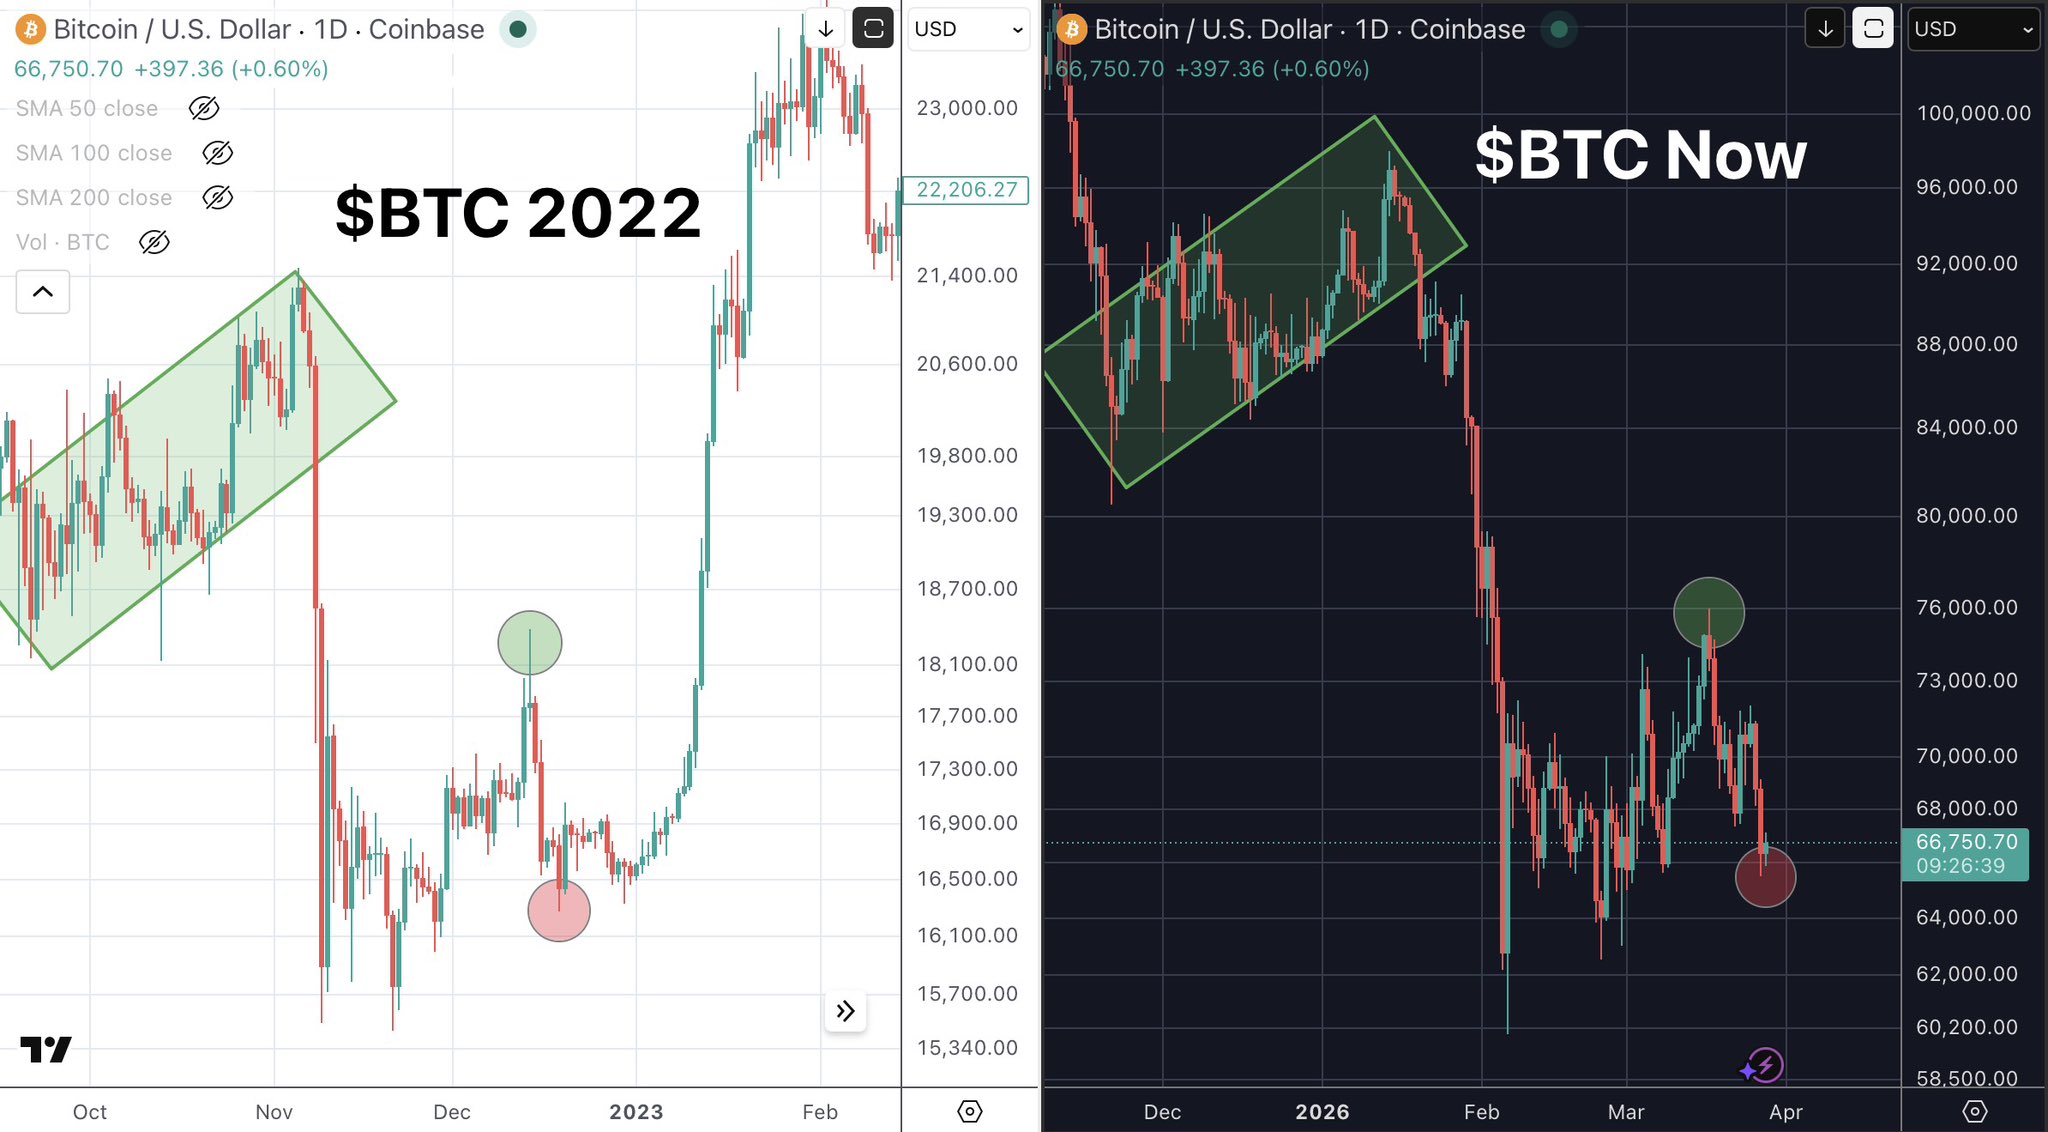
The side-by-side chart comparison overlays Bitcoin’s current 2026 daily price action with the 2022 bear market structure on Coinbase — revealing striking structural similarities that are difficult to dismiss.
The 2022 Reference (Left Chart)
Between October and November 2022, Bitcoin formed a clearly defined consolidation structure within a descending parallel channel — highlighted in green on the chart — before ultimately breaking out to the upside in early 2023. Key characteristics of the 2022 structure:
- Price consolidated in a tight descending channel between approximately $19,800 and $15,700
- Multiple failed breakdown attempts below the channel’s lower boundary — trapping short sellers who anticipated continuation lower
- A decisive breakout above the upper channel boundary triggered the recovery that eventually carried BTC to new all-time highs in 2024–2025
- The green circle on the 2022 chart marks the local bounce point — followed by the pink circle marking the final low before the recovery
The Current 2026 Setup (Right Chart)
BTC’s current daily chart shows a nearly identical structural setup:
- Price has formed the same descending parallel channel — highlighted in green — between approximately $96,000 and $62,000
- The channel’s consolidation behavior mirrors the 2022 structure in both angle and duration
- Current price near $66,750 is sitting at the equivalent position to where BTC was in late 2022 before the recovery began
- The green circle on the current chart marks a local bounce — with the red circle indicating the most recent test of the lower boundary near $63,000–$64,000
As @quantum_ascend notes — many market participants are prematurely celebrating a bearish flag pattern that “everyone is posting” — a crowded trade that historically fails to deliver the expected downside when sentiment is this uniformly bearish. His assessment: “I wouldn’t fade crypto here.”
The fractal does not guarantee an immediate rally — but it suggests the current structure could resolve similarly to 2022’s eventual recovery phase if the key channel support levels hold on a daily closing basis.
What’s Next for Bitcoin?
The convergence of the STH inflow multi-year low and the 2022 fractal alignment — occurring simultaneously at the same price level — creates one of the more compelling bottom setups Bitcoin has presented since the 2022–2023 cycle recovery.
As we also covered in our Bitcoin six-month red streak and BARR pattern analysis, the historical context is adding further weight to the current setup — with March 2026 potentially completing the longest losing streak in Bitcoin’s entire recorded history before a significant reversal.
Bullish Confirmation
- A daily close above $76,000 — the first meaningful confirmation that the recovery is underway and the descending channel structure is resolving to the upside
- STH inflows remain suppressed — confirming that panic selling has not returned and the bottom formation is holding
- The 2022 fractal continues to play out — with price breaking above the upper channel boundary as BTC did in early 2023
- Broader geopolitical de-escalation — any credible resolution to the US-Israel-Iran conflict reduces the risk-off pressure that has been the primary macro headwind for BTC in 2026
- Whale accumulation continues — building on the 61,568 BTC already accumulated by large wallets as identified in our Bitcoin whale analysis
Bearish Invalidation
- A daily close below $60,000 invalidates the recovery thesis entirely — breaking the lower boundary of the descending channel and signaling that the 2022 fractal has failed to repeat
- STH inflows spike higher — indicating fresh panic selling has returned and the bottom formation is not holding
- Continued geopolitical escalation maintains persistent risk-off pressure — delaying any recovery regardless of the technical and on-chain signals
- The 2022 fractal diverges — if BTC fails to hold the channel’s lower boundary as the 2022 structure did, the next meaningful support would be near the $55,000–$58,000 zone
Frequently Asked Questions
What are Short-Term Holders (STH) and why do their Binance inflows matter?
Short-Term Holders are Bitcoin wallets that have held BTC for less than 155 days — the most reactive and sentiment-driven market segment. Their inflows to exchanges like Binance are a leading indicator of panic selling — when inflows spike, it signals mass capitulation; when they collapse to multi-year lows as they are now, it signals that reactive selling is exhausting and a potential bottom is forming.
Why are STH inflows at 25,000 BTC significant?
The 25,000 BTC 7-day sum represents the lowest STH inflow reading on Binance in years — matching the low-inflow environment that preceded every major Bitcoin recovery since 2018 including the 2019 recovery, the 2020 COVID bottom, and the 2022–2023 cycle bottom. The historical consistency of this pattern makes it one of the most watched on-chain bottom indicators in the Bitcoin market.
What is the 2022 fractal and how does it apply to BTC’s current setup?
The 2022 fractal refers to the descending parallel channel structure Bitcoin formed between October and November 2022 — before breaking out to the upside in early 2023. Analyst @quantum_ascend has identified an almost identical channel structure in BTC’s current 2026 daily chart — with the same angle, consolidation behavior, and position within the channel suggesting a similar resolution could be approaching.
What price level confirms the bullish scenario for Bitcoin?
A decisive daily close above $76,000 is the first meaningful confirmation that the recovery is underway and the descending channel is resolving to the upside. This level represents the upper boundary of the current consolidation structure — equivalent to the breakout level in the 2022 fractal comparison.
What price level invalidates the recovery thesis?
A daily close below $60,000 invalidates the recovery thesis — breaking the lower boundary of the descending channel and signaling that the current structure has failed to repeat the 2022 recovery setup. In this scenario the next meaningful support would be in the $55,000–$58,000 zone based on prior consolidation levels visible on the longer-term chart.
How does the STH inflow signal combine with the 2022 fractal?
The most significant aspect of the current Bitcoin setup is that both signals — the STH inflow multi-year low and the 2022 fractal alignment — are converging simultaneously at the same price level. When independent on-chain and technical signals point in the same direction at the same time, the confluence adds significant weight to the thesis compared to either signal appearing in isolation
The opinions and market insights shared on CoinsProbe represent the views of individual authors based on prevailing market conditions at the time of publication. Cryptocurrency investments carry significant risk and volatility. Readers are encouraged to conduct their own research and seek professional financial advice before making investment decisions. CoinsProbe and its contributors do not accept responsibility for financial losses or decisions made based on published content.
CoinsProbe may publish sponsored articles, affiliate links, or promotional collaborations. All sponsored material is clearly labeled to maintain transparency with our audience. Our editorial decisions remain fully independent, and advertising partnerships do not influence reviews, rankings, or published opinions.
Since 2023, CoinsProbe has delivered reliable insights on cryptocurrency, blockchain, and digital assets. Our content is created by experienced researchers and analysts who follow strict editorial standards focused on accuracy, transparency, and credibility. Every article is carefully reviewed and verified using trusted sources and current market data. We provide unbiased analysis and timely updates covering everything from emerging crypto projects to major industry developments.