
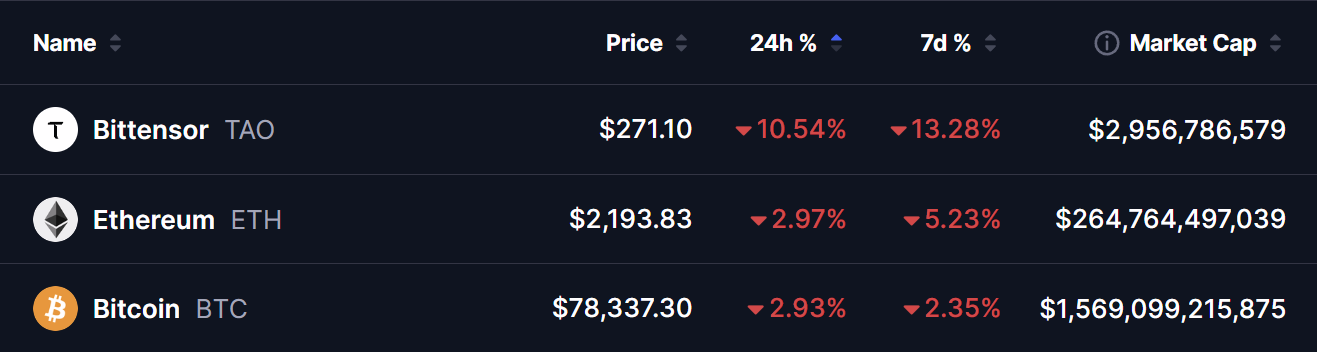
- Bittensor (TAO) is trading at $271.10 — down -10.54% in 24 hours and -13.28% over 7 days — with a market cap of $2.96 billion.
- The weekend sell-off has completely erased recent weekly gains — occurring against a broader market pullback with BTC down -2.93% and ETH down -2.97% over the same period.
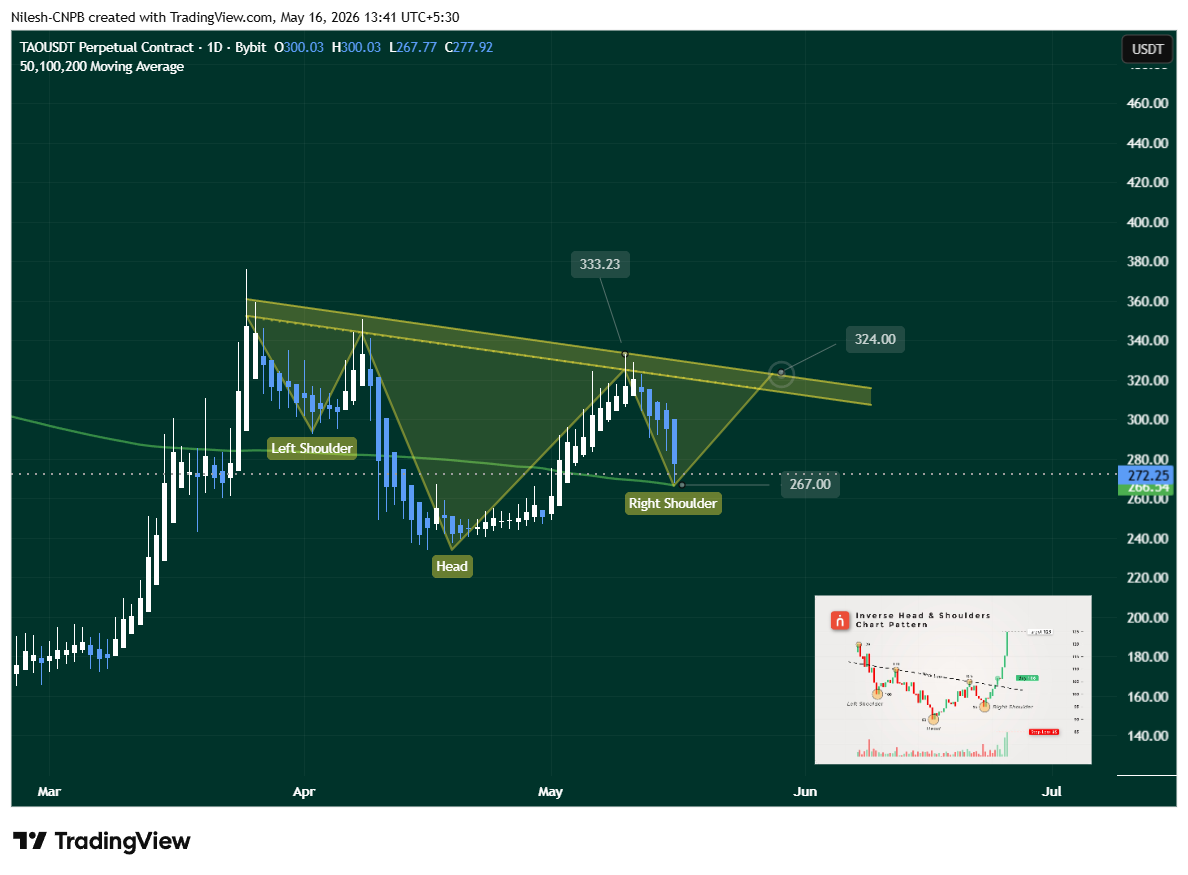
- Despite the sharp decline, a classic Inverse Head and Shoulders pattern is forming on the daily chart — with the right shoulder holding just above the 200-day MA at $266 as critical support.
- A confirmed breakout above the neckline at $324 would validate the pattern. A break below $266 invalidates the setup entirely.
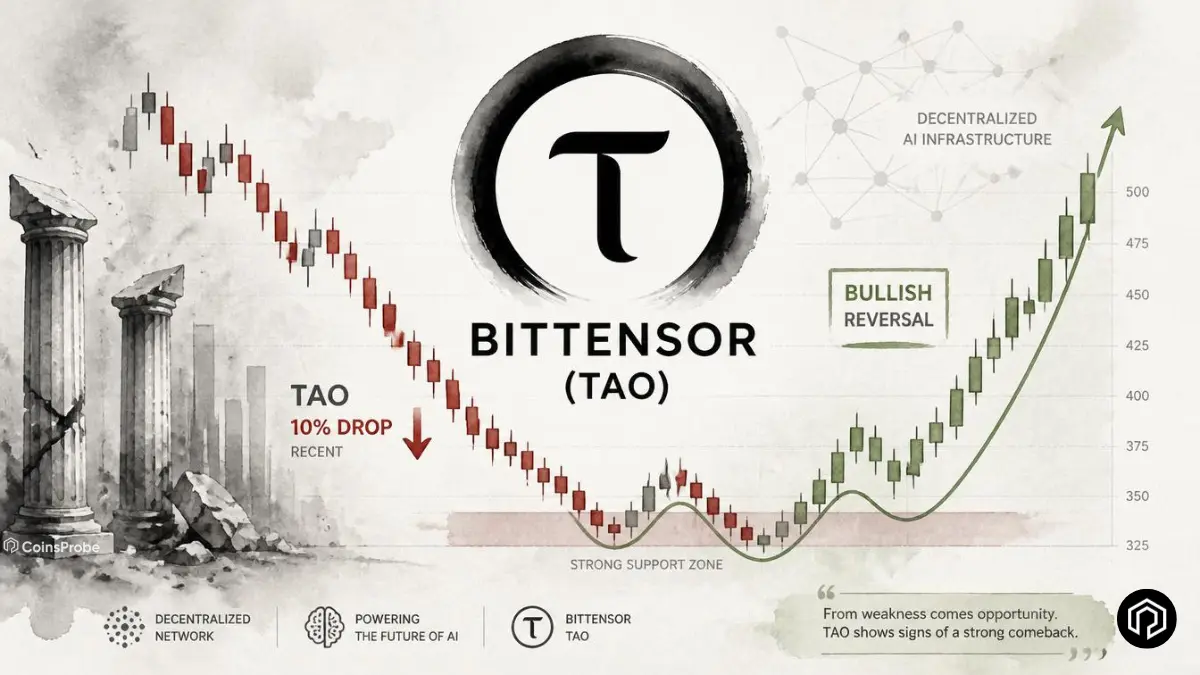
Bittensor has endured a punishing weekend — TAO is down more than 10% in 24 hours and over 13% on the week, completely reversing the gains that had built through earlier in the month. The broader crypto market has also cooled, with Bitcoin pulling back to $78,337 and Ethereum to $2,193 — but TAO’s decline has been significantly more severe than the market average.
As we covered in our Bittensor and Solana AI convergence article, TAO’s price action has been closely tied to the AI infrastructure narrative — and weekend volatility in that narrative has amplified the selling. Despite the short-term pain, however, the daily chart is now building a technical structure that analysts are watching closely as a potential reversal signal.
The Pattern — Inverse Head and Shoulders on the Daily Chart
Despite the selling pressure, the daily TAO chart is forming a classic Inverse Head and Shoulders — one of the most widely recognised and statistically reliable bullish reversal patterns in technical analysis. The pattern signals that selling momentum is exhausting and buyers are beginning to establish a higher floor with each successive low.
The three components:
Left Shoulder — Formed in early April after TAO failed to break the $360 resistance level — price pulled back and found support near $292, creating the first trough of the pattern.
Head — The deepest point of the structure — mid-April bears drove TAO to a low of $234 — the absolute bottom of the current cycle and the most extreme level of selling pressure in the pattern.
Right Shoulder — TAO’s most recent dip to $267 — critically, this low is significantly higher than the $234 head — demonstrating that sellers are losing the ability to push price to new lows. The right shoulder is currently sitting just above the 200-day moving average at $266 — making this level a dual technical support: pattern right shoulder plus a major dynamic moving average.
The neckline — Connecting the peaks between the left shoulder, head, and right shoulder — resistance sits near $324 — approximately +18–19% above the current price. A clean daily close above this level confirms the pattern and activates the measured move.
Why the $266–$267 Zone Is Critical
The right shoulder low at $267 and the 200-day MA at $266 have converged into a single critical support cluster. This is the level that determines whether the Inverse Head and Shoulders plays out or collapses.
The 200-day MA is one of the most watched indicators in all of financial markets — a sustained hold above it signals that the longer-term trend remains constructive, while a daily close below it signals structural weakness. For TAO, the 200 MA has transitioned into dynamic support precisely at the right shoulder low — creating a situation where both pattern structure and a major technical indicator are defending the same price zone simultaneously.
This confluence makes $266–$267 significantly more robust as support than either level would be in isolation — and makes a break below it significantly more bearish for the same reason.
What’s Next for TAO — Two Scenarios
Bullish Scenario
TAO defends the $266–$267 support zone — the 200-day MA holds and the right shoulder low remains intact. Buyers build a base above this level and the broader market stabilises — providing the recovery environment the pattern needs. A push back toward and through the $324 neckline confirms the Inverse Head and Shoulders and activates the measured move:
Bearish Scenario
If TAO breaks and closes below $266 on a sustained daily basis — the right shoulder is violated and the 200-day MA loses as support simultaneously. This double invalidation would signal the Inverse Head and Shoulders has failed — likely triggering a further leg lower as pattern traders exit and the 200 MA provides no floor. In this scenario lower support levels would need to be identified before any recovery thesis becomes viable.
Bottom Line
TAO’s double-digit weekly loss is painful — but the daily chart is building a recovery case that deserves serious attention. The Inverse Head and Shoulders forming at the 200-day MA confluence is a textbook pattern in a historically reliable location — and the right shoulder holding above $266 through the weekend sell-off is a constructive signal about underlying demand.
The coming sessions are decisive. If $266 holds — the pattern remains intact and $324 becomes the target. If $266 breaks — the thesis fails and a deeper correction follows.
Watch that level. It is the only one that matters right now.
Frequently Asked Questions (FAQ)
What is the Inverse Head and Shoulders pattern on TAO?
It’s a bullish reversal setup showing weakening selling pressure and potential upside after a neckline breakout.
Why is the $266–$267 level important for TAO?
This zone acts as major support, combining the right shoulder level and the 200-day moving average.
The opinions and market insights shared on CoinsProbe represent the views of individual authors based on prevailing market conditions at the time of publication. Cryptocurrency investments carry significant risk and volatility. Readers are encouraged to conduct their own research and seek professional financial advice before making investment decisions. CoinsProbe and its contributors do not accept responsibility for financial losses or decisions made based on published content.
CoinsProbe may publish sponsored articles, affiliate links, or promotional collaborations. All sponsored material is clearly labeled to maintain transparency with our audience. Our editorial decisions remain fully independent, and advertising partnerships do not influence reviews, rankings, or published opinions.
Since 2023, CoinsProbe has delivered reliable insights on cryptocurrency, blockchain, and digital assets. Our content is created by experienced researchers and analysts who follow strict editorial standards focused on accuracy, transparency, and credibility. Every article is carefully reviewed and verified using trusted sources and current market data. We provide unbiased analysis and timely updates covering everything from emerging crypto projects to major industry developments.