Date: Thu, Dec 11, 2025 | 08:40 AM GMT
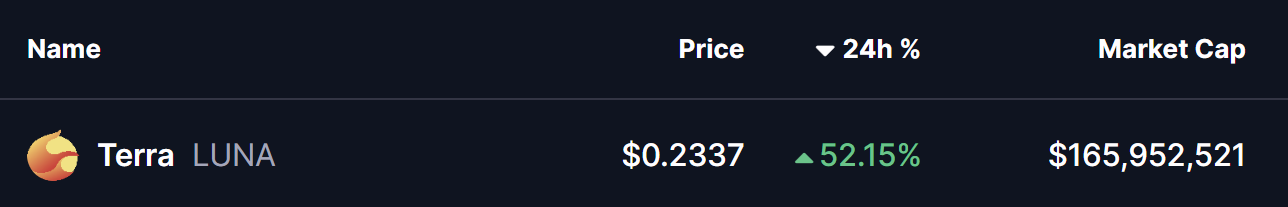
The broader cryptocurrency market is witnessing notable retracement today, with both Bitcoin (BTC) and Ethereum (ETH) slipping by more than 2% and 4% respectively. Amid this weakness, Terra (LUNA) has managed to steal the spotlight after a sharp and decisive surge.
LUNA exploded with an impressive 52% single-day jump, but what makes this move even more interesting is the emerging fractal structure on its daily chart — a structure that strongly resembles a recent breakout model seen in another altcoin.
LUNA Mirrors ICP’s Breakout Pattern
A side-by-side comparison of LUNA and ICP on the daily timeframe reveals an almost identical structural development, hinting that a stronger trend reversal may already be underway.
In its previous cycle, ICP spent several weeks inside a right-angled ascending broadening wedge, gradually grinding lower and eventually tapping the wedge’s base. The rebound from that level sparked a recovery back toward the 100-day moving average. Once ICP reclaimed this moving average and approached its upper wedge boundary, momentum flipped sharply. The result was a clean breakout and a 54% explosive rally from the breakout trigger.
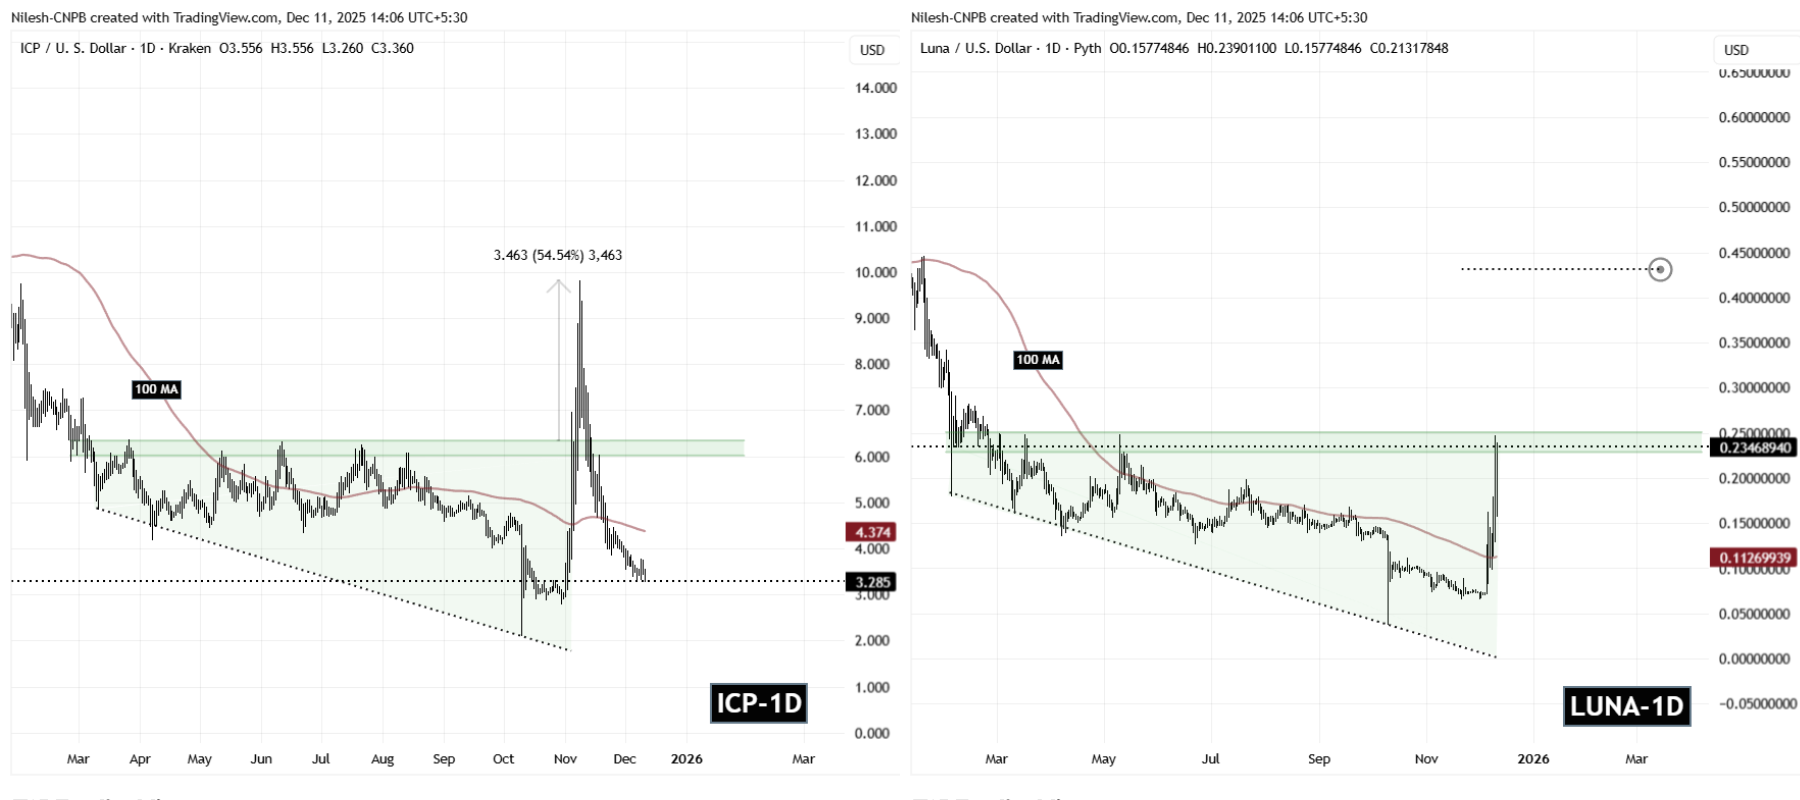
LUNA now appears to be mirroring the same multi-stage behavior.
After revisiting the lower boundary of its own broadening wedge, LUNA generated a strong reaction and pushed aggressively upward. The reclaim of the 100-day moving average is a critical technical milestone and has now brought price directly into the upper resistance band at $0.2278–$0.2520 — the same structural zone that acted as the ignition point for ICP’s breakout.
What’s Next for LUNA?
If LUNA continues to respect the fractal and the wedge dynamics, a breakout above the upper boundary could serve as the trigger for the next major extension. The projected move marked on the chart points toward $0.4312, representing an approximate 81% upside from current levels.
Fractal setups do not guarantee identical outcomes, but they often provide early directional clues based on recurring market behavior. And right now, LUNA’s chart is delivering a very clear message — structure is improving, buyers are stepping in with conviction, and the breakout zone is now firmly in sight.
Disclaimer: The views and analysis presented in this article are for informational purposes only and reflect the author’s perspective, not financial advice. Technical patterns and indicators discussed are subject to market volatility and may or may not yield the anticipated results. Investors should exercise caution, conduct independent research, and make decisions aligned with their individual risk tolerance.
The opinions and market insights shared on CoinsProbe represent the views of individual authors based on prevailing market conditions at the time of publication. Cryptocurrency investments carry significant risk and volatility. Readers are encouraged to conduct their own research and seek professional financial advice before making investment decisions. CoinsProbe and its contributors do not accept responsibility for financial losses or decisions made based on published content.
CoinsProbe may publish sponsored articles, affiliate links, or promotional collaborations. All sponsored material is clearly labeled to maintain transparency with our audience. Our editorial decisions remain fully independent, and advertising partnerships do not influence reviews, rankings, or published opinions.
Since 2023, CoinsProbe has delivered reliable insights on cryptocurrency, blockchain, and digital assets. Our content is created by experienced researchers and analysts who follow strict editorial standards focused on accuracy, transparency, and credibility. Every article is carefully reviewed and verified using trusted sources and current market data. We provide unbiased analysis and timely updates covering everything from emerging crypto projects to major industry developments.