
Date: Fri, February 28, 2025 | 04:10 AM GMT
In the cryptocurrency market, the wave of correction that started after the November rally has created panic among investors, bringing Bitcoin (BTC) down to $80K from its all-time high (ATH) of $110K, while Ethereum (ETH) has dropped to $2,100 today.
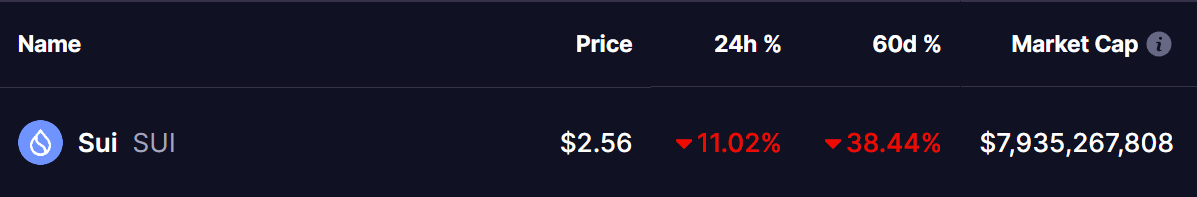
Along with this, the layer-1 token Sui (SUI), which made impressive gains in late 2024, has faced a 38% correction in the last 60 days, plummeting from its ATH of $5.36 to its current price of $2.56.
However, with its ongoing price action, analysis hints that SUI could be mirroring Solana’s bullish rally during the 2021 bull run, which could be a relief sign for investors in this panic phase.
Is Sui (SUI) Following the Solana (SOL) Path?
The chart highlights a key similarity between SUI (Sui) and SOL (Solana) on the 1-day timeframe, suggesting that SUI might be replicating the bullish breakout pattern that previously led to a major rally in SOL.
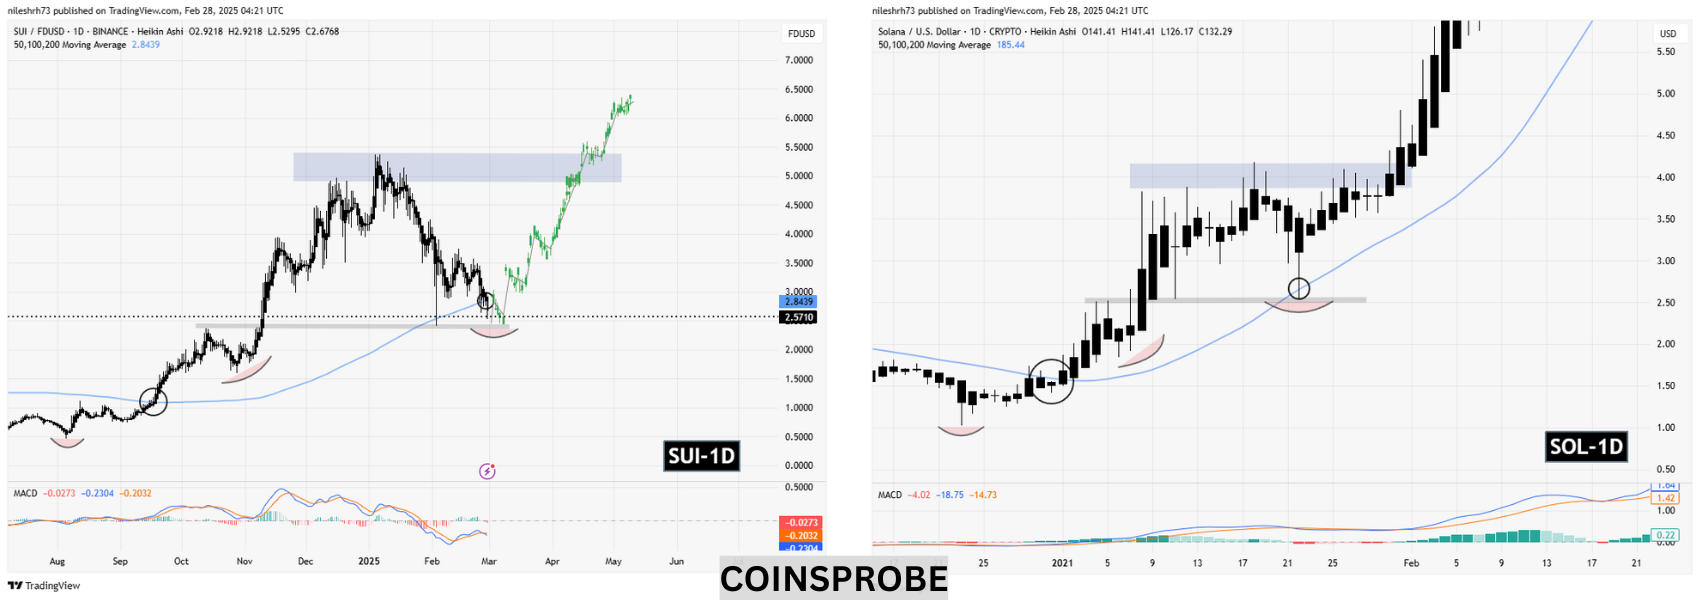
Looking at SOL’s price history during the early phase of the 2021 bull run, the chart reveals a strong initial uptrend followed by a deep correction, where SOL pulled back to its key support zone (marked in gray) as well as its moving average (MA) support. This retracement served as a critical accumulation phase, allowing buyers to step in before SOL rebounded and broke through the resistance zone, ultimately triggering a parabolic rally.
Similarly, SUI is making a comparable correction now, having crossed the moving average (MA) marked in a circle—just like SOL did before its explosive move during the same period, around January to February. This mirrors SOL’s price action in early 2021. SUI still has some room for further correction, as its support (gray zone) sits at $2.41, just below the current price of $2.55—the same type of support level where SOL found stability before its breakout.

If SUI follows the same pattern, it could be gearing up for a major upward move. The $4.91–$5.37 resistance zone is a critical level to watch—just as SOL experienced, a successful breakout past this zone could trigger a massive rally.
If this SOL-like pattern plays out, SUI could see a major upside rally, potentially aiming for the $9–$10+ range in the coming months.
Final Thoughts
SUI’s current price action closely mirrors SOL’s 2021 breakout, hinting at a potential major rally. If it holds key support at $2.41 and pushes past the $4.91–$5.37 resistance zone, we could see a strong upward move, possibly toward $9–$10. However, if SUI breaks below support, the bullish setup could fail.

Disclaimer: This article is for informational purposes only and not financial advice. Always conduct your own research before investing in cryptocurrencies.
The opinions and market insights shared on CoinsProbe represent the views of individual authors based on prevailing market conditions at the time of publication. Cryptocurrency investments carry significant risk and volatility. Readers are encouraged to conduct their own research and seek professional financial advice before making investment decisions. CoinsProbe and its contributors do not accept responsibility for financial losses or decisions made based on published content.
CoinsProbe may publish sponsored articles, affiliate links, or promotional collaborations. All sponsored material is clearly labeled to maintain transparency with our audience. Our editorial decisions remain fully independent, and advertising partnerships do not influence reviews, rankings, or published opinions.
Since 2023, CoinsProbe has delivered reliable insights on cryptocurrency, blockchain, and digital assets. Our content is created by experienced researchers and analysts who follow strict editorial standards focused on accuracy, transparency, and credibility. Every article is carefully reviewed and verified using trusted sources and current market data. We provide unbiased analysis and timely updates covering everything from emerging crypto projects to major industry developments.