- ONDO breaks above upper trendline of 123-day Elliott Wave ending diagonal on 3-day Bybit chart at $0.4135 (+3.69%)
- Analyst @CryptoBullet1 flags breakout with measured move targeting $0.60–$0.65 resistance zone — 45–55% upside.
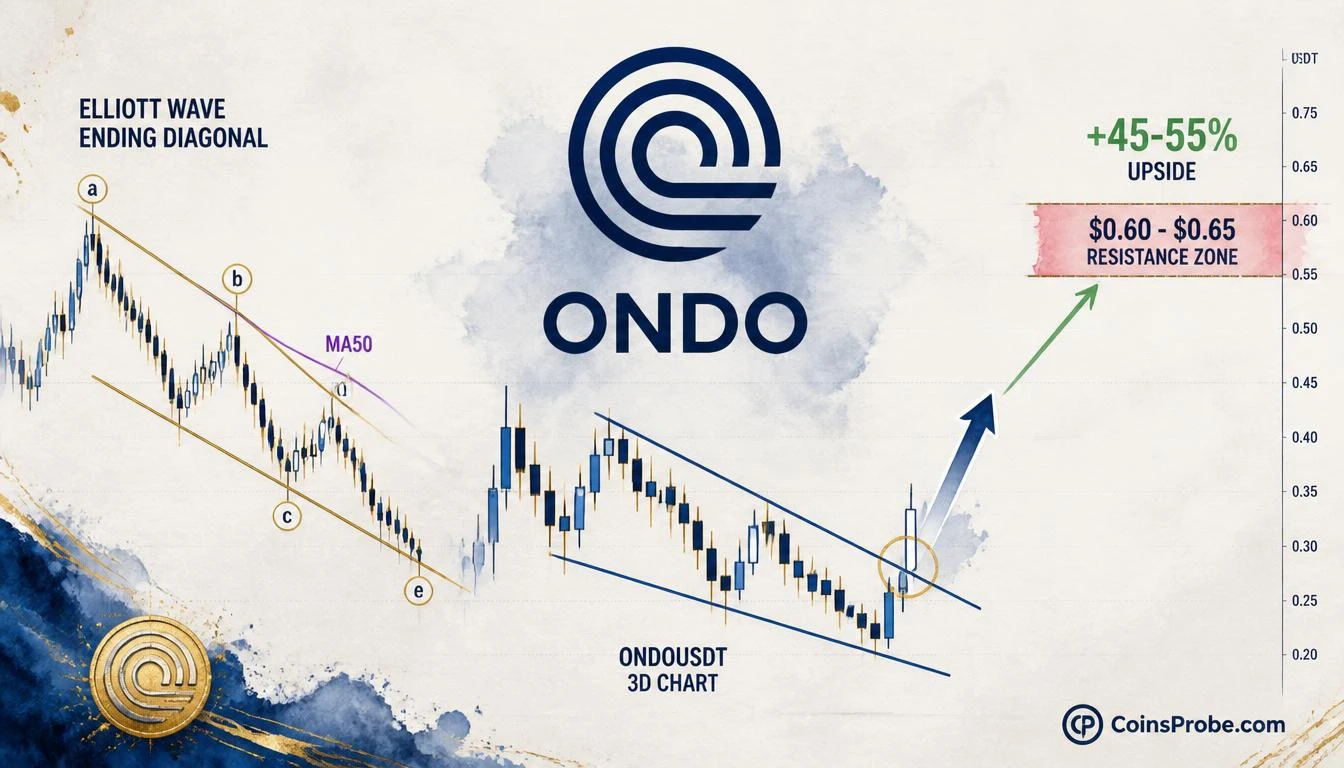
ONDO is printing a structural breakout on its 3-day chart — completing a textbook Elliott Wave ending diagonal that has been compressing price for approximately 123 days. The breakout from point “e” of the pattern flags a potential bullish reversal targeting the $0.60–$0.65 resistance zone, representing 45–55% upside from the breakout level near $0.4135.
The signal was identified by analyst @CryptoBullet1, who flagged the move on X (formerly Twitter) with the caption: “$ONDO is breaking out.” The chart shared is a Bybit ONDO/USDT spot pair on a 3-day candlestick timeframe — a higher-order view that filters out intraday noise and focuses on multi-week structural patterns.
Signal — Elliott Wave Ending Diagonal Breakout
The Elliott Wave ending diagonal is a five-wave terminal pattern — labeled a-b-c-d-e — that appears at the conclusion of a corrective sequence. Unlike a standard impulse, both the support and resistance trendlines in an ending diagonal converge toward a point, creating a wedge structure. The final wave (“e”) completes the pattern with a thrust above the upper trendline — a move that, when confirmed, signals the corrective sequence is exhausted and a directional reversal is underway.
On ONDO’s 3-day Bybit chart, the ending diagonal spans 41 bars, equivalent to approximately 123 calendar days. This is a significant duration — not a micro-pattern on a 15-minute chart. A 123-day corrective structure resolving upward carries meaningful structural weight.
Price has broken above the upper wedge trendline near point “e” at approximately $0.4135, up 3.69% on the 3-day candle at the time of chart capture. The measured move target from an ending diagonal breakout aligns with the origin of wave “a” — in this case, the $0.60–$0.65 resistance zone highlighted in the chart.
The 3-Day Chart — What @CryptoBullet1’s Analysis Reveals
The 3-day ONDO/USDT chart shared by @CryptoBullet1 reveals several important structural elements:
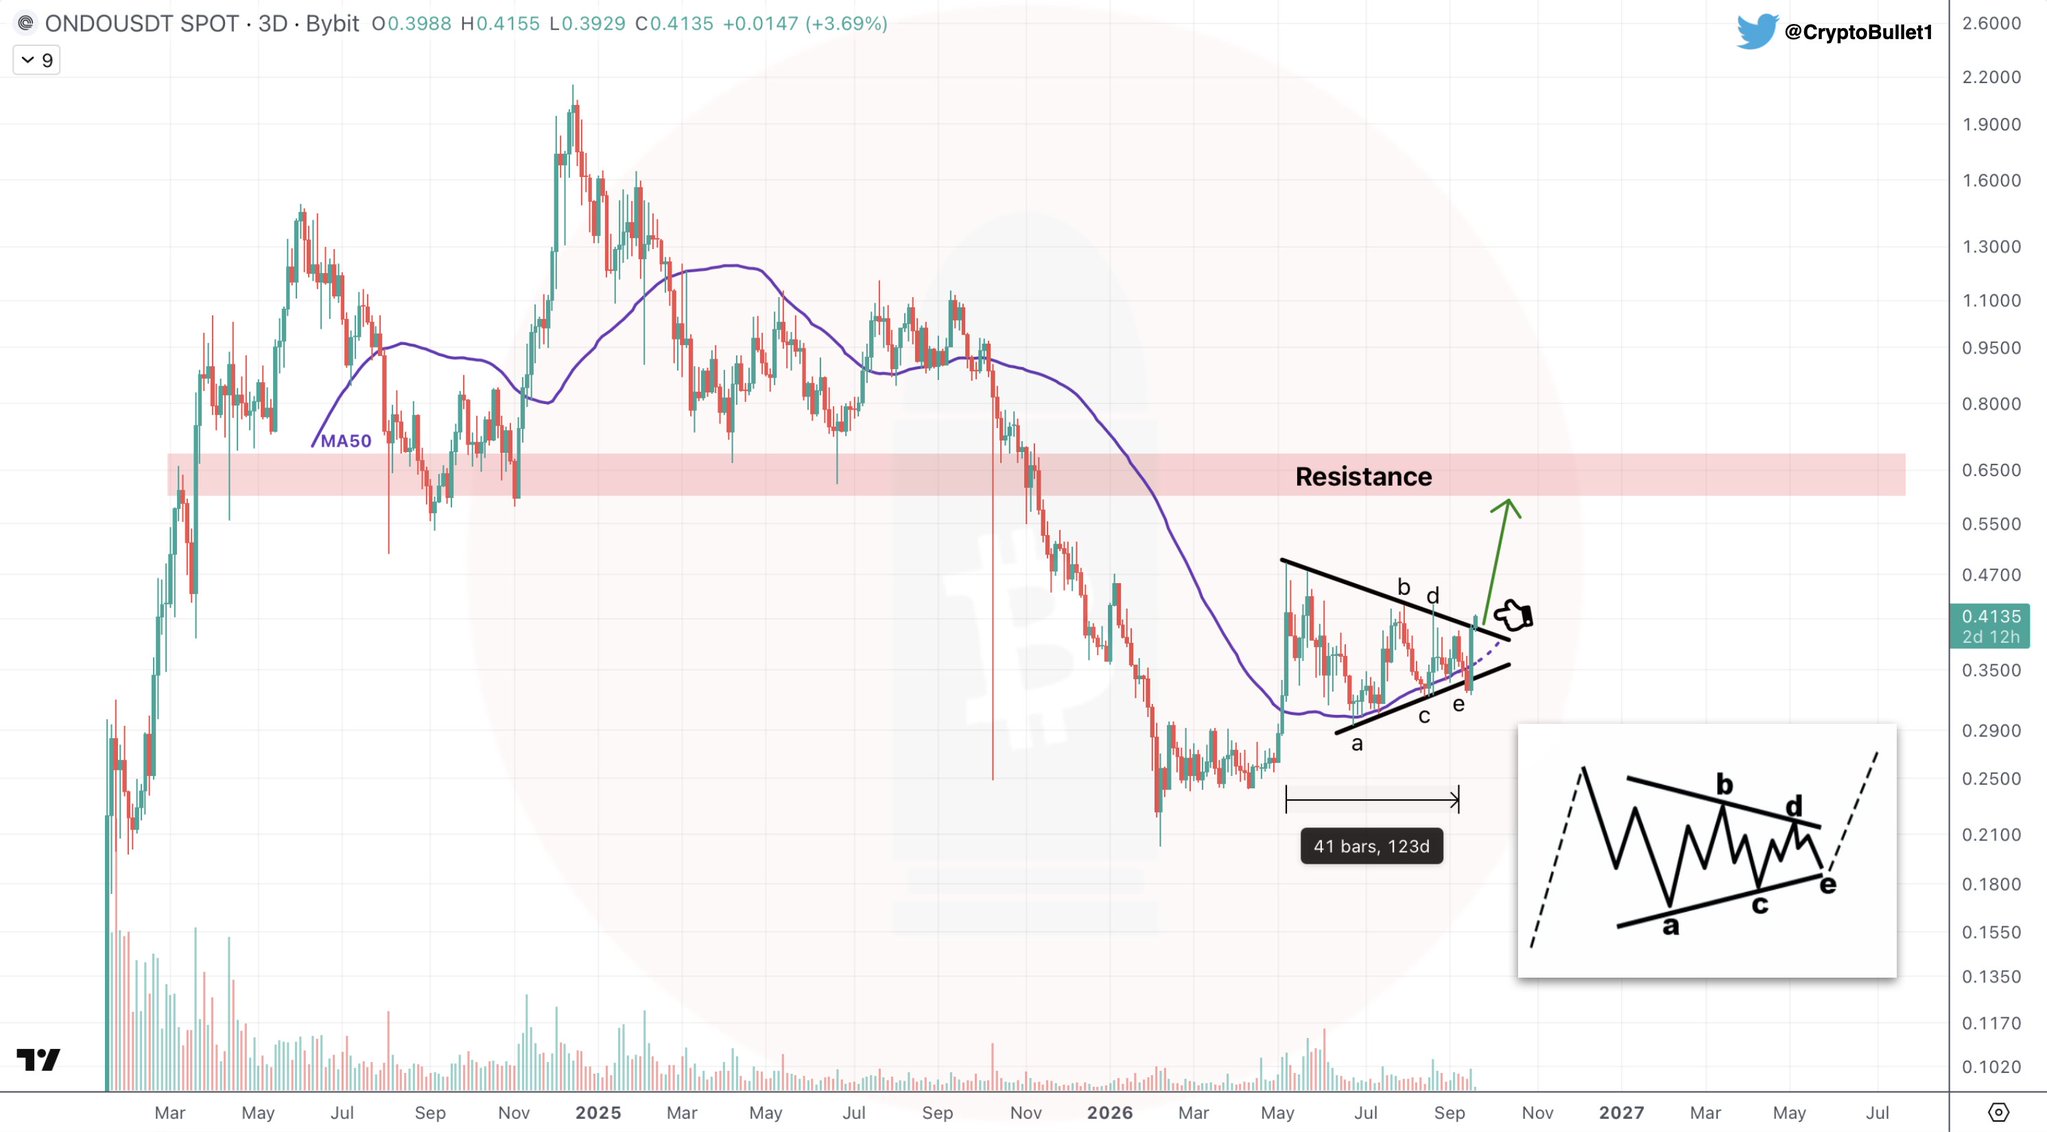
- Recent low: ~$0.28–$0.30 — the base from which the corrective ending diagonal formed
- Breakout level: Upper wedge trendline near ~$0.38–$0.40
- Current price at chart capture: $0.4135 (+3.69%)
- Resistance zone: $0.60–$0.65 (pink highlighted band on chart)
- Green arrow projection: Targets $0.55–$0.60 as the initial breakout objective
The inset diagram in the bottom-right of the chart illustrates the a-b-c-d-e wave labeling explicitly — confirming this is a named pattern, not a generic trendline draw. The analyst’s target aligns directly with the measured move from the corrective structure’s origin.
What the Pattern Says — and What It Doesn’t
A 123-day Elliott Wave ending diagonal has completed on ONDO’s 3-day chart. Price has broken above the upper wedge trendline at point “e.” The structural measured move targets $0.60–$0.65, representing 45–55% upside from the $0.4135 breakout level.
What to watch for continuation: A sustained 3-day close above $0.4135 significantly strengthen the case for the $0.60–$0.65 target. Volume expansion on the breakout candle provides additional confirmation — declining volume on the breakout would be a caution flag.
ONDO in Context — RWA Sector Momentum
ONDO Finance is a leading tokenized real-world asset (RWA) protocol. The broader RWA sector has attracted significant institutional attention through 2025 and into 2026 — a trend tracked across multiple on-chain data points. A structural breakout in ONDO aligns with sustained growth in the RWA narrative, which has also been reflected in on-chain metrics for projects across adjacent sectors. For broader context on accumulation dynamics in the current cycle, see our recent coverage of XRP Whales Accumulate $2.2B in 96 Hours — Supply Shock Building.
The timing of ONDO’s ending diagonal resolution — emerging from a 123-day corrective structure — places this breakout in a broader market context where multiple assets are resolving multi-month patterns simultaneously. For comparison, the setup methodology is similar to how analysts have approached Solana’s bull flag at $101, where the breakout target was derived from a measured move off the consolidation structure.
Bullish Scenario — Sustained Hold Above $0.4135
If ONDO maintains 3-day closes above the upper wedge trendline (~$0.4135), the measured move from the 123-day ending diagonal opens a path to $0.55–$0.60 as the initial objective and $0.60–$0.65 as the primary resistance zone — representing 45–55% upside from the current breakout level. This scenario is reinforced if the breakout candle closes with expanding volume.
Bearish Scenario — Rejection and Close Back Inside the Wedge
A 3-day closing price below $0.38 — back inside the wedge — invalidates the ending diagonal breakout. This outcome would indicate a false breakout or a continuation of the corrective structure, with the next structural support at the $0.28–$0.30 base. Under this scenario, the pattern resets and no directional target applies.
Bottom Line
ONDO has broken above the upper trendline of a 123-day Elliott Wave ending diagonal on the 3-day Bybit chart — a terminal corrective pattern whose resolution targets the $0.60–$0.65 resistance zone, 45–55% above the $0.4135 breakout level flagged by @CryptoBullet1.
The structural case is valid as long as 3-day candles hold above $0.38 — a close below that level invalidates the breakout and returns price to corrective mode.
Frequently Asked Questions
What is an Elliott Wave ending diagonal and why does it matter for ONDO?
What is ONDO’s price target from this breakout?
At what price does the ONDO breakout thesis become invalid?
Source: Cryptobullet1 · Published by CoinsProbe Markets Desk
The opinions and market insights shared on CoinsProbe represent the views of individual authors based on prevailing market conditions at the time of publication. Cryptocurrency investments carry significant risk and volatility. Readers are encouraged to conduct their own research and seek professional financial advice before making investment decisions. CoinsProbe and its contributors do not accept responsibility for financial losses or decisions made based on published content.
CoinsProbe may publish sponsored articles, affiliate links, or promotional collaborations. All sponsored material is clearly labeled to maintain transparency with our audience. Our editorial decisions remain fully independent, and advertising partnerships do not influence reviews, rankings, or published opinions.
Since 2023, CoinsProbe has delivered reliable insights on cryptocurrency, blockchain, and digital assets. Our content is created by experienced researchers and analysts who follow strict editorial standards focused on accuracy, transparency, and credibility. Every article is carefully reviewed and verified using trusted sources and current market data. We provide unbiased analysis and timely updates covering everything from emerging crypto projects to major industry developments.