
Key Takeaways
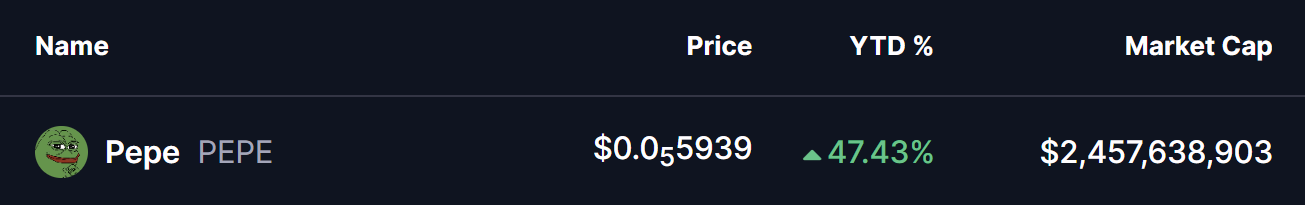
- Pepe (PEPE) is up nearly 47% year-to-date, benefiting from improving sentiment across the broader crypto and memecoin market.
- Bitcoin’s 9% YTD rise and Ethereum reclaiming $3,300 have helped fuel renewed risk appetite among traders.
- PEPE’s daily chart is forming a bullish fractal that closely mirrors the October–November 2024 setup, which previously led to a 160% rally.
As 2026 kicks off, the broader memecoin market is showing renewed upside momentum, and Pepe (PEPE) is once again finding itself in the spotlight. With Bitcoin already up around 9% year-to-date and Ethereum reclaiming the $3,300 level with an 11% YTD rise, overall crypto sentiment has clearly improved. Riding this wave, PEPE has surged nearly 47% so far this year.
While the short-term price action looks encouraging on its own, the bigger story appears to be unfolding on the charts. A familiar bullish fractal structure is starting to take shape, one that previously led to an explosive upside move.
Fractal Setup Hints at a Bullish Breakout
On the daily timeframe, PEPE’s current price behavior closely resembles a structure seen during the October–November 2024 period, as highlighted in the chart comparison. Back then, PEPE bounced from its downtrend lows and began forming a falling wedge pattern. After a period of consolidation, price eventually broke out and reclaimed the 200-day moving average.
That reclaim proved to be the key trigger. Once PEPE moved back above the 200-day MA, bullish momentum accelerated sharply, resulting in a powerful rally of roughly 160% in a relatively short span.
Fast forward to the present, and a similar setup appears to be developing again. PEPE recently rebounded from its range lows and pushed to a local high near $0.0000072. Since then, price has entered a consolidation phase that is shaping into another falling wedge, closely mirroring the pre-breakout behavior seen late last year.
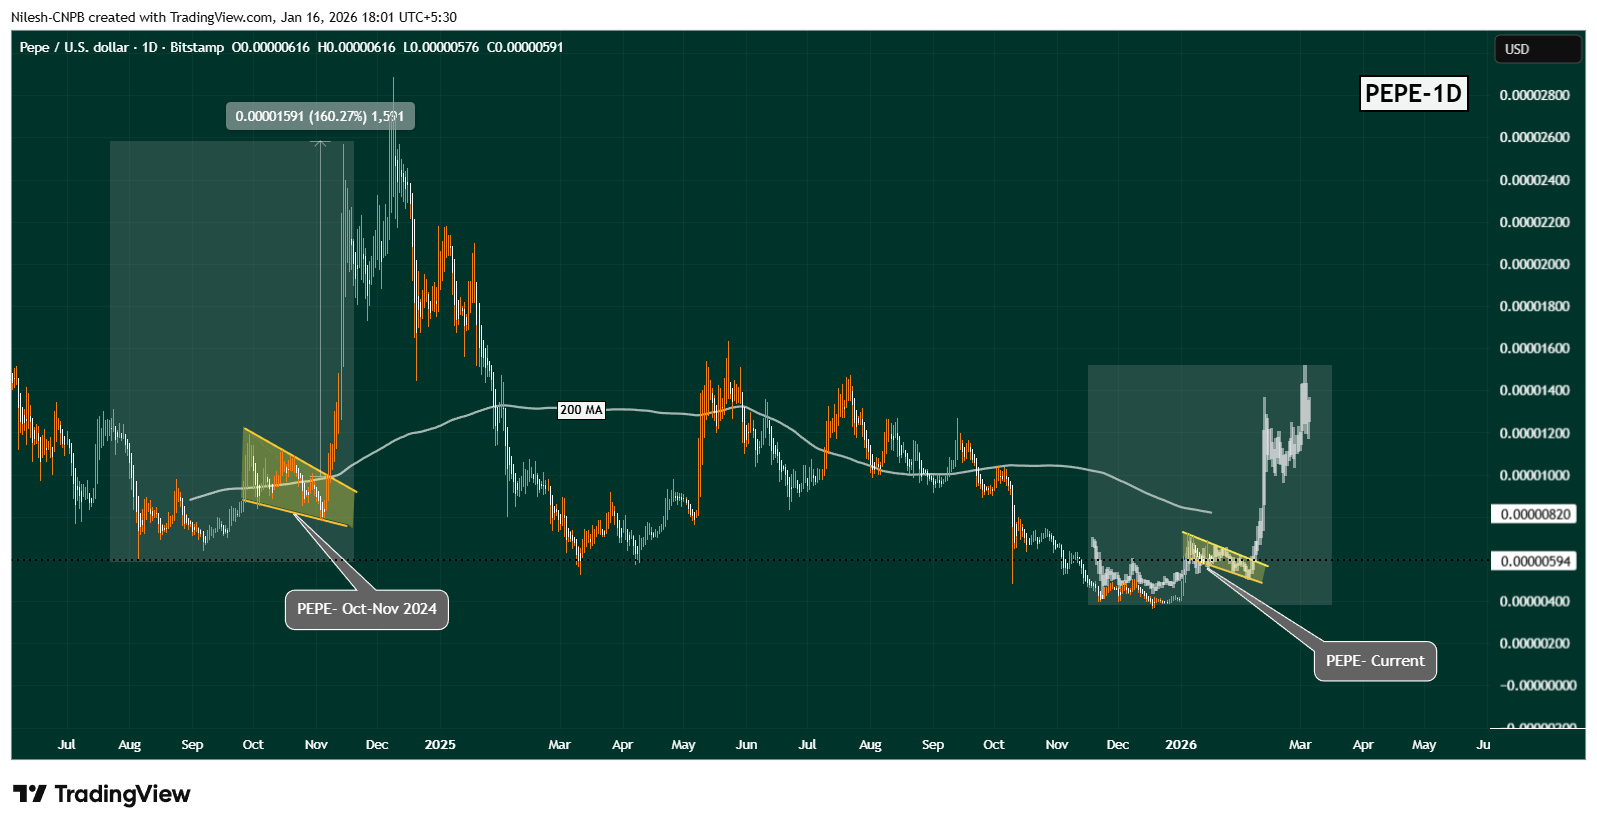
What strengthens this comparison is not just the pattern itself, but the overall structure. The bounce from the bottom, the measured consolidation, and the positioning just below the 200-day moving average all align well with the previous bullish fractal. This alignment suggests that PEPE may be quietly building energy for its next move higher.
What’s Next for PEPE?
If this bullish fractal continues to play out, PEPE could see a bit more sideways to slightly downward consolidation within the falling wedge. A temporary dip toward the $0.0000052 area would still fit the broader setup before a more decisive move emerges.
A confirmed breakout followed by a reclaim of the 200-day moving average around $0.0000082 would be a major technical shift. Should that happen, the fractal projection points toward a potential move into the $0.000015 zone, implying a possible upside of around 150% from the breakout base, similar to the November rally.
Of course, fractal patterns are not guarantees. Broader market conditions, liquidity flows, and overall sentiment will continue to play a role. While the similarities on the chart are compelling, traders should watch for strong volume expansion and sustained follow-through above resistance before expecting a full repeat of the previous move.
Bottom Line
PEPE is showing early signs of a familiar bullish setup that has delivered strong gains in the past. With market sentiment improving and a well-defined fractal forming on the daily chart, the coming weeks could be crucial. If history even partially rhymes, PEPE may be setting the stage for another meaningful upside run, making it a memecoin worth watching closely as 2026 unfolds.
Disclaimer: The views and analysis presented in this article are for informational purposes only and reflect the author’s perspective, not financial advice. Technical patterns and indicators discussed are subject to market volatility and may or may not yield the anticipated results. Investors are advised to exercise caution, conduct independent research, and make decisions aligned with their individual risk tolerance.
About Author: Nilesh Hembade is the Founder and Lead Author of Coinsprobe, with over 5 years of experience in the cryptocurrency and blockchain industry. Since launching Coinsprobe in 2023, he has been providing daily, research-driven insights through in-depth market analysis, on-chain data, and technical research.

The opinions and market insights shared on CoinsProbe represent the views of individual authors based on prevailing market conditions at the time of publication. Cryptocurrency investments carry significant risk and volatility. Readers are encouraged to conduct their own research and seek professional financial advice before making investment decisions. CoinsProbe and its contributors do not accept responsibility for financial losses or decisions made based on published content.
CoinsProbe may publish sponsored articles, affiliate links, or promotional collaborations. All sponsored material is clearly labeled to maintain transparency with our audience. Our editorial decisions remain fully independent, and advertising partnerships do not influence reviews, rankings, or published opinions.
Since 2023, CoinsProbe has delivered reliable insights on cryptocurrency, blockchain, and digital assets. Our content is created by experienced researchers and analysts who follow strict editorial standards focused on accuracy, transparency, and credibility. Every article is carefully reviewed and verified using trusted sources and current market data. We provide unbiased analysis and timely updates covering everything from emerging crypto projects to major industry developments.