
- Bitcoin trades at $85,803, range-bound between $83,000 and $86,700 for two consecutive weeks
- URPD data shows 1.59 million BTC accumulated between $83,307–$84,569 — the densest supply cluster on the distribution chart
- Whales added 14,335 BTC (~$1.22B) since October 1, per Santiment data cited by @alicharts
- $86,700 is the confirmed breakout trigger; loss of $83,000 opens path to $76,996
Bitcoin is trading at $85,803 — down 0.62% over the past 24 hours — but the two-week sideways grind between $83,000 and $86,700 is beginning to look less like indecision and more like accumulation. Three independent on-chain signals are converging to suggest the next directional move may be higher.
Crypto analyst Ali Martinez (@alicharts) published a five-part thread on October 6, 2026, asking directly: “Bitcoin: Another Attempt at $100,000?” His answer isn’t speculative — it’s grounded in URPD distribution data, whale accumulation figures, and price structure analysis pointing to a technically defined breakout level.
Signal 1 — Price Structure: Two Weeks Inside a Defined Range
The 4-hour chart shared by @alicharts reveals a horizontal consolidation that has now persisted for approximately two weeks. Bitcoin has oscillated repeatedly between $83,000 support and $86,700 resistance, with candles rejecting at both extremes without establishing a sustained breakout in either direction. A dotted reference line near $85,800 sits just below current price, marking the midpoint of the range’s upper half.
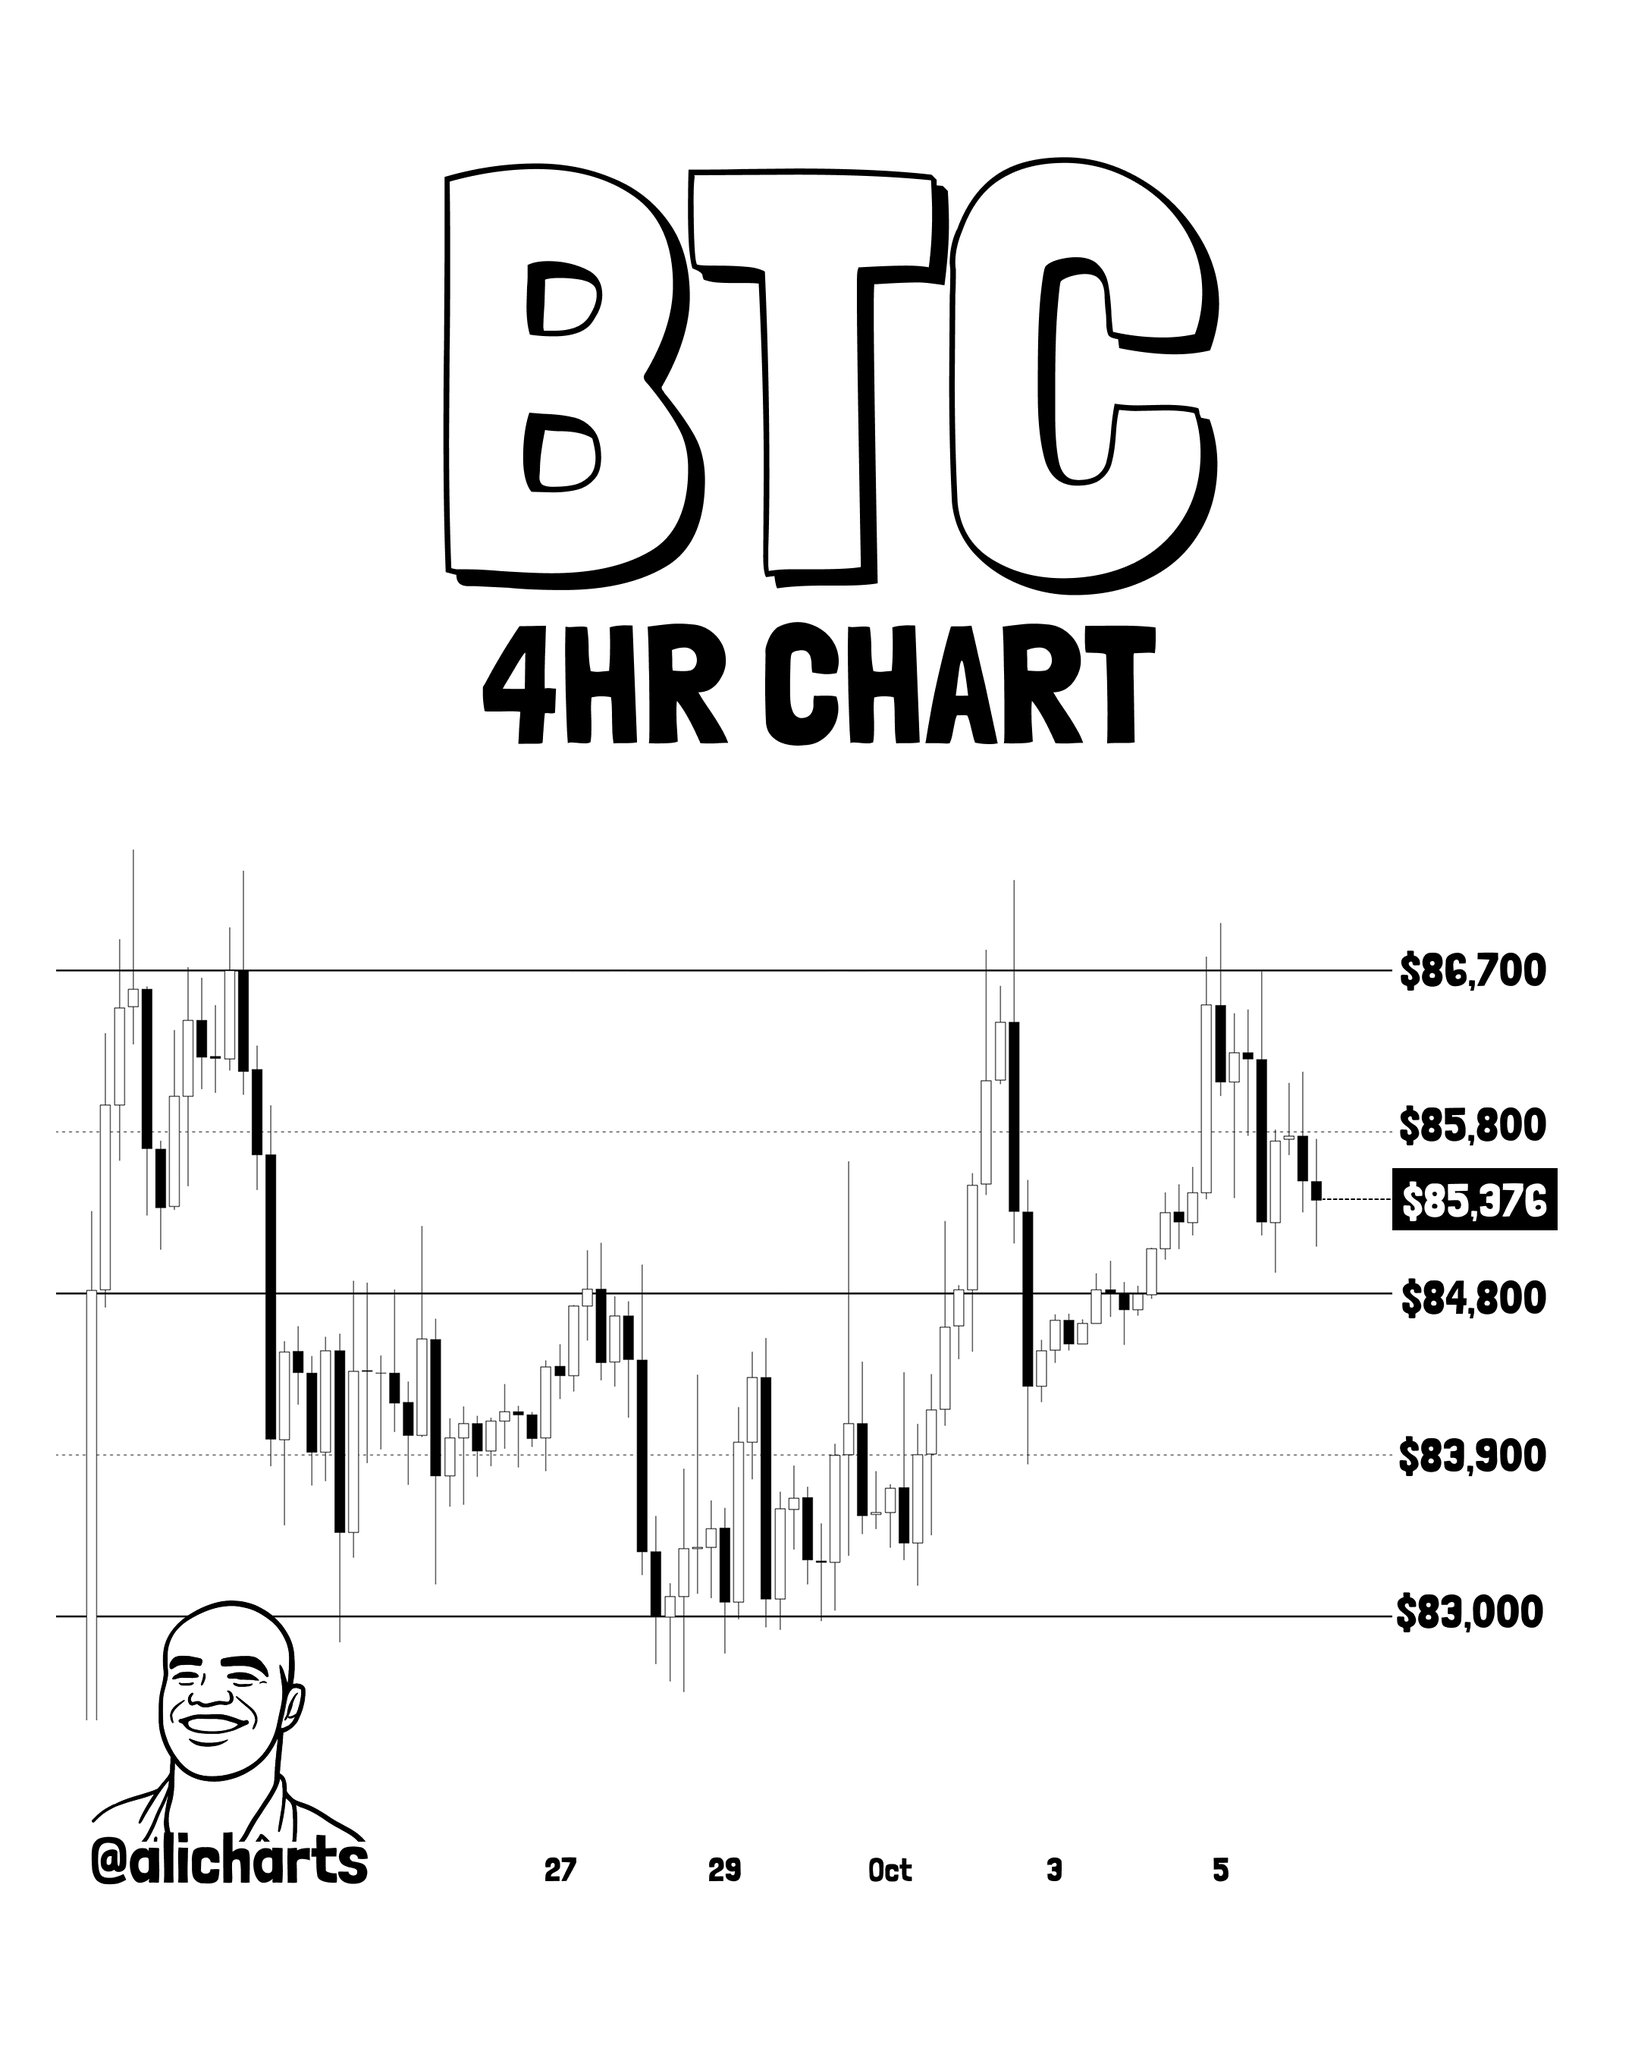
What the range itself communicates is straightforward: neither bulls nor bears have achieved decisive control. What makes the range relevant now is what’s happening underneath it on-chain — which is where Martinez’s next two signals carry the analytical weight.
Signal 2 — URPD: 1.59 Million BTC Traded Between $83,300 and $84,600
The UTXO Realized Price Distribution (URPD) maps the price at which existing Bitcoin supply last changed hands. It answers a specific question: where do current holders have their cost basis? The concentration at any level indicates how many coins were acquired there — and consequently, how motivated holders at that level are to defend it.
Martinez’s URPD chart shows the two longest bars in the entire distribution sitting between $83,307 and $84,569, each approaching 600,000 BTC. Combined, this zone represents approximately 1.59 million BTC traded within a $1,300 price band — the densest supply cluster visible on the chart. A hollow bar at $85,831 marks the approximate current price level, sitting just above the cluster. Bars above $92,143 thin out considerably, indicating comparatively sparse supply in that zone.
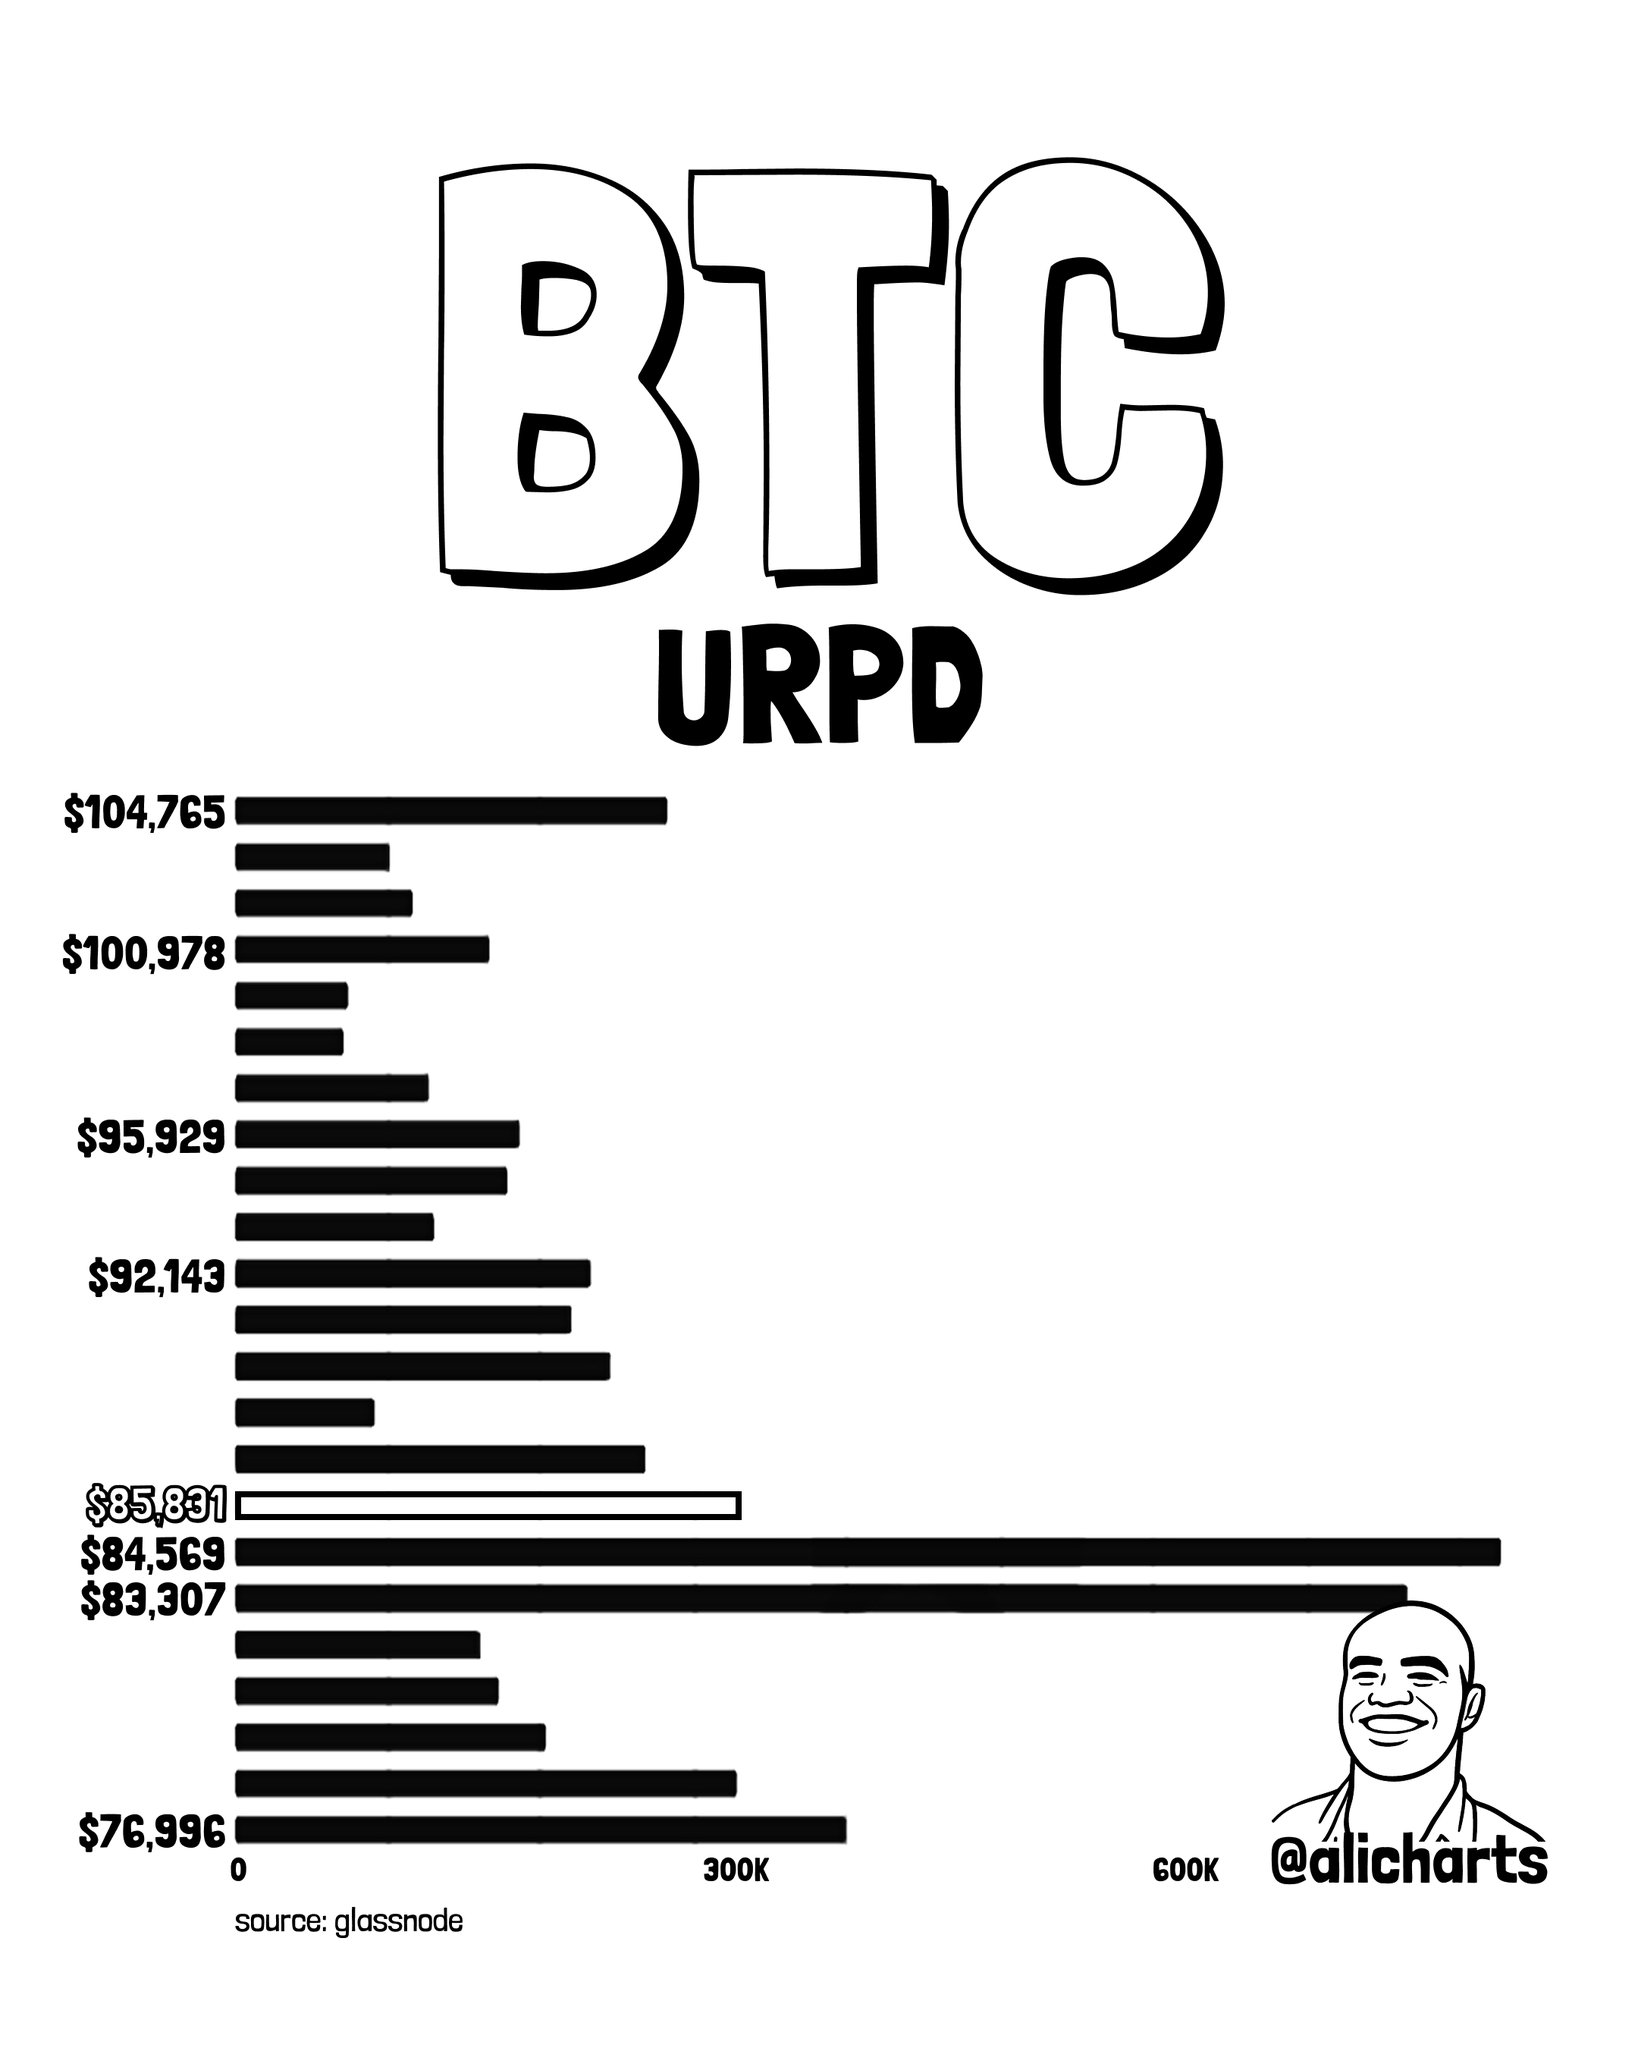
The mechanism is direct: the larger the coin volume accumulated at a price band, the stronger the collective incentive for those holders to defend that band. With 1.59 million BTC having last traded between $83,300 and $84,600, a pullback into that zone would confront one of the heaviest demand concentrations in Bitcoin’s current supply distribution. That is not a soft floor — it is a structurally defined support zone with identifiable on-chain depth.
Signal 3 — Whale Accumulation: 14,335 BTC Added Since October 1
The third signal operates at the participant level. Santiment data cited by Martinez shows Bitcoin whales — large-balance holders tracked by on-chain monitoring — added 14,335 BTC since October 1, 2026, equivalent to approximately $1.22 billion at current prices. The whale holdings bar chart shows an ascending staircase pattern across October 3 through October 5, with holdings reaching the tallest bar on day 5 before a slight pullback on day 6 — while remaining elevated relative to the start of the tracked period.
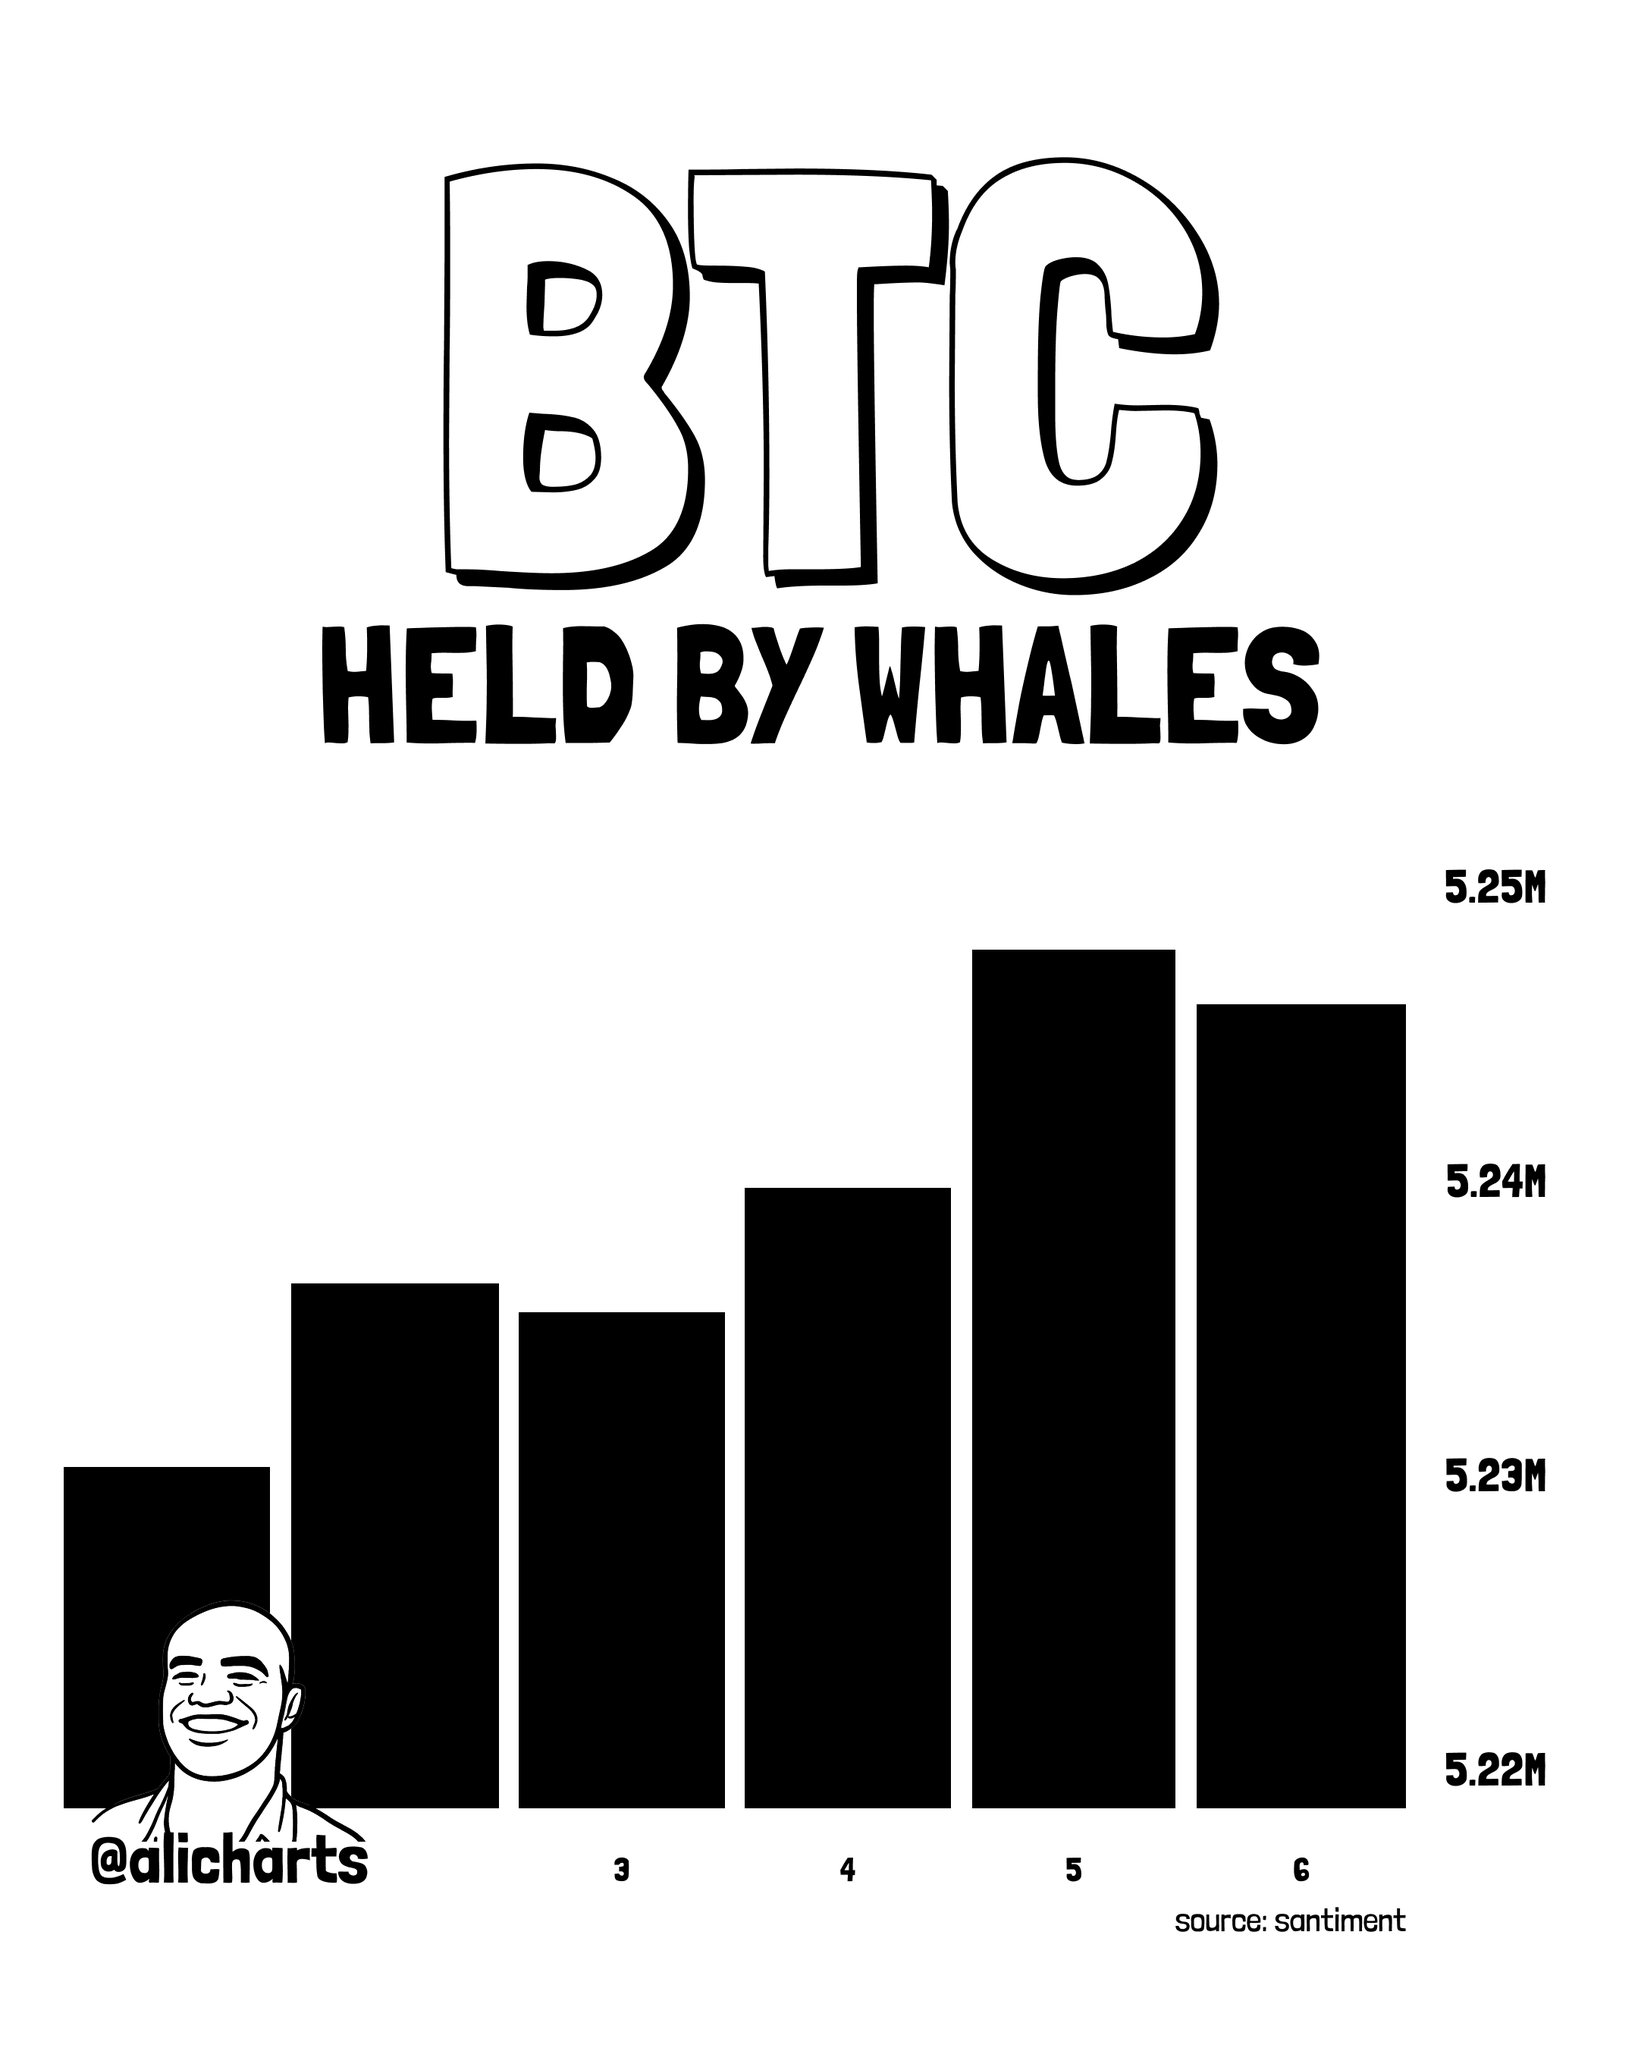
Whale accumulation during a sideways range carries a specific interpretation: large holders are not waiting for confirmation of a breakout before positioning. They are building exposure while retail sentiment remains neutral and price is range-bound. This behavior — accumulation without a visible catalyst — is consistent with pre-breakout positioning rather than reactive buying. As Martinez frames it, whales are “positioning for that possibility” of a move toward $100,000. For further context on Bitcoin’s broader cycle positioning, see Bitcoin Fractal Cycle Flags Distribution Phase — Oct 2026 Bottom Projected.
The Breakout Level and What Opens Above It
Martinez’s thread identifies $86,700 as the specific level Bitcoin must clear for the on-chain accumulation thesis to translate into price action. That is not a round number or a speculative target — it is the upper boundary of the two-week range that has repeatedly rejected upward attempts. A confirmed break above $86,700 would mean escaping the consolidation that has contained Bitcoin since late September.
The URPD data above $92,143 shows significantly thinner supply, which means fewer holders with cost bases in that zone and therefore less structural overhead resistance between $86,700 and the $92,000–$95,000 region. The absence of dense supply clusters in that range is itself a factor — thin overhead supply is a prerequisite for rapid price moves, not a guarantee of them.
For a broader view of Bitcoin’s upside structure across this cycle, CoinsProbe has previously mapped the Bitcoin Rising Channel targeting $190K alongside ETH, XRP, and SOL projections.
Bullish Scenario
Bitcoin holds the $83,300–$84,600 URPD support zone on any pullback, and subsequently breaks above $86,700 with sustained closing price action above that level. This would exit the two-week consolidation range, confirm that whale accumulation was correctly anticipatory, and open a path through the thin supply zone above $92,143 toward $100,000.
Bearish Scenario
Bitcoin loses the $83,000 range floor. A confirmed break below $83,000 invalidates the support zone thesis — 1.59 million BTC in the $83,300–$84,600 cluster would shift from a defended support to a source of realized-loss selling pressure. The next meaningful URPD cluster visible on the chart sits near $76,996, which would become the reference level for the subsequent support structure.
Three Signals, One Conclusion
The three signals Martinez identifies are not independent bullish claims stacked together — they are a coherent structural picture. The range ($83,000–$86,700) defines the battlefield. The URPD cluster (1.59 million BTC at $83,300–$84,600) establishes what is being defended. The whale accumulation (14,335 BTC, ~$1.22B since October 1) identifies who is doing the defending. Together, they describe a market where large holders are absorbing supply inside a defined range, with on-chain data suggesting the range resolves upward rather than downward — conditional on $86,700 breaking.
The on-chain setup is in place. The price has not yet confirmed it. Bitcoin at $85,803 sits $897 below the breakout trigger at $86,700 and $17,197 above the structural floor at $83,000. Whether the next $100,000 attempt begins here will be answered at $86,700 — and, if it fails, retested at $83,300.
Frequently Asked Questions
What is URPD and why does it matter for Bitcoin’s support at $83,300–$84,600?
How much Bitcoin did whales accumulate since October 1, 2026?
What is the specific price level Bitcoin must break for the bullish thesis to activate?
What happens if Bitcoin loses the $83,000 support level?
Source: Ali Charts · Published by CoinsProbe Markets Desk
The opinions and market insights shared on CoinsProbe represent the views of individual authors based on prevailing market conditions at the time of publication. Cryptocurrency investments carry significant risk and volatility. Readers are encouraged to conduct their own research and seek professional financial advice before making investment decisions. CoinsProbe and its contributors do not accept responsibility for financial losses or decisions made based on published content.
CoinsProbe may publish sponsored articles, affiliate links, or promotional collaborations. All sponsored material is clearly labeled to maintain transparency with our audience. Our editorial decisions remain fully independent, and advertising partnerships do not influence reviews, rankings, or published opinions.
Since 2023, CoinsProbe has delivered reliable insights on cryptocurrency, blockchain, and digital assets. Our content is created by experienced researchers and analysts who follow strict editorial standards focused on accuracy, transparency, and credibility. Every article is carefully reviewed and verified using trusted sources and current market data. We provide unbiased analysis and timely updates covering everything from emerging crypto projects to major industry developments.