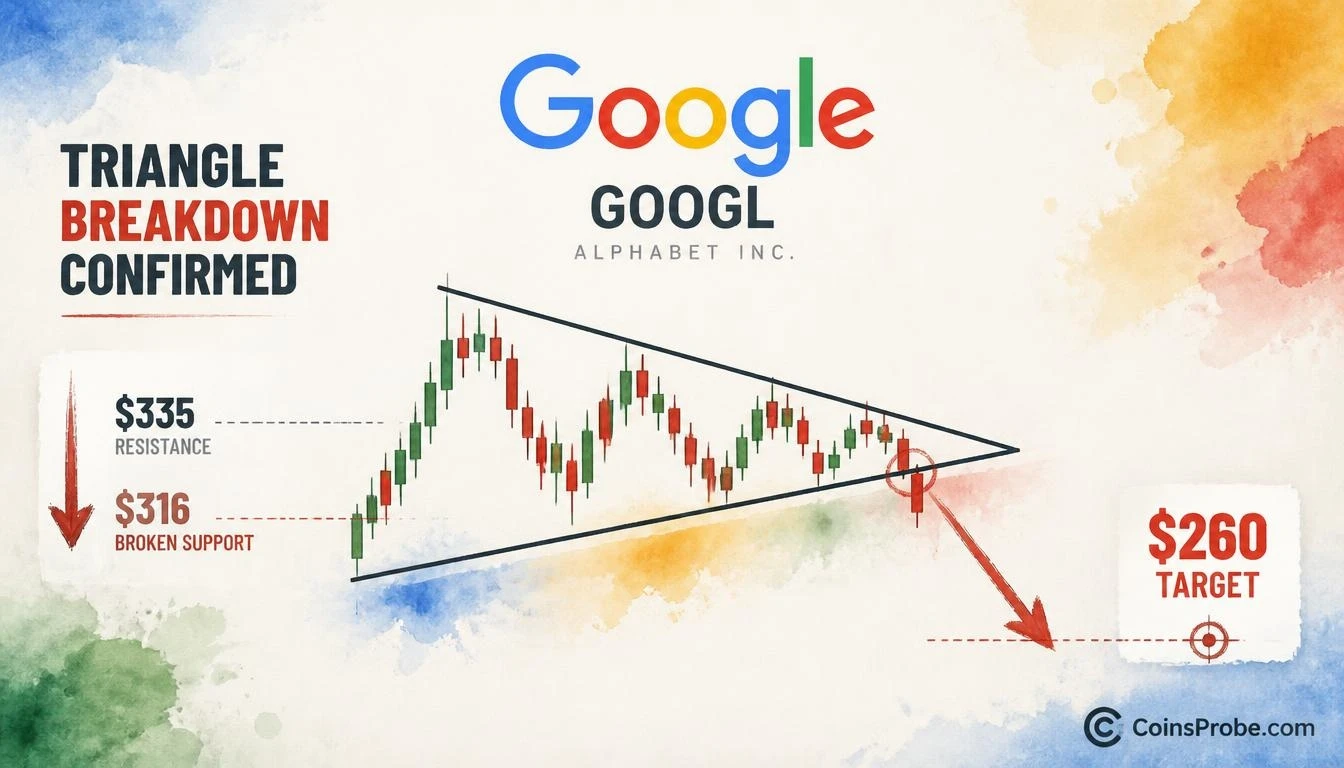
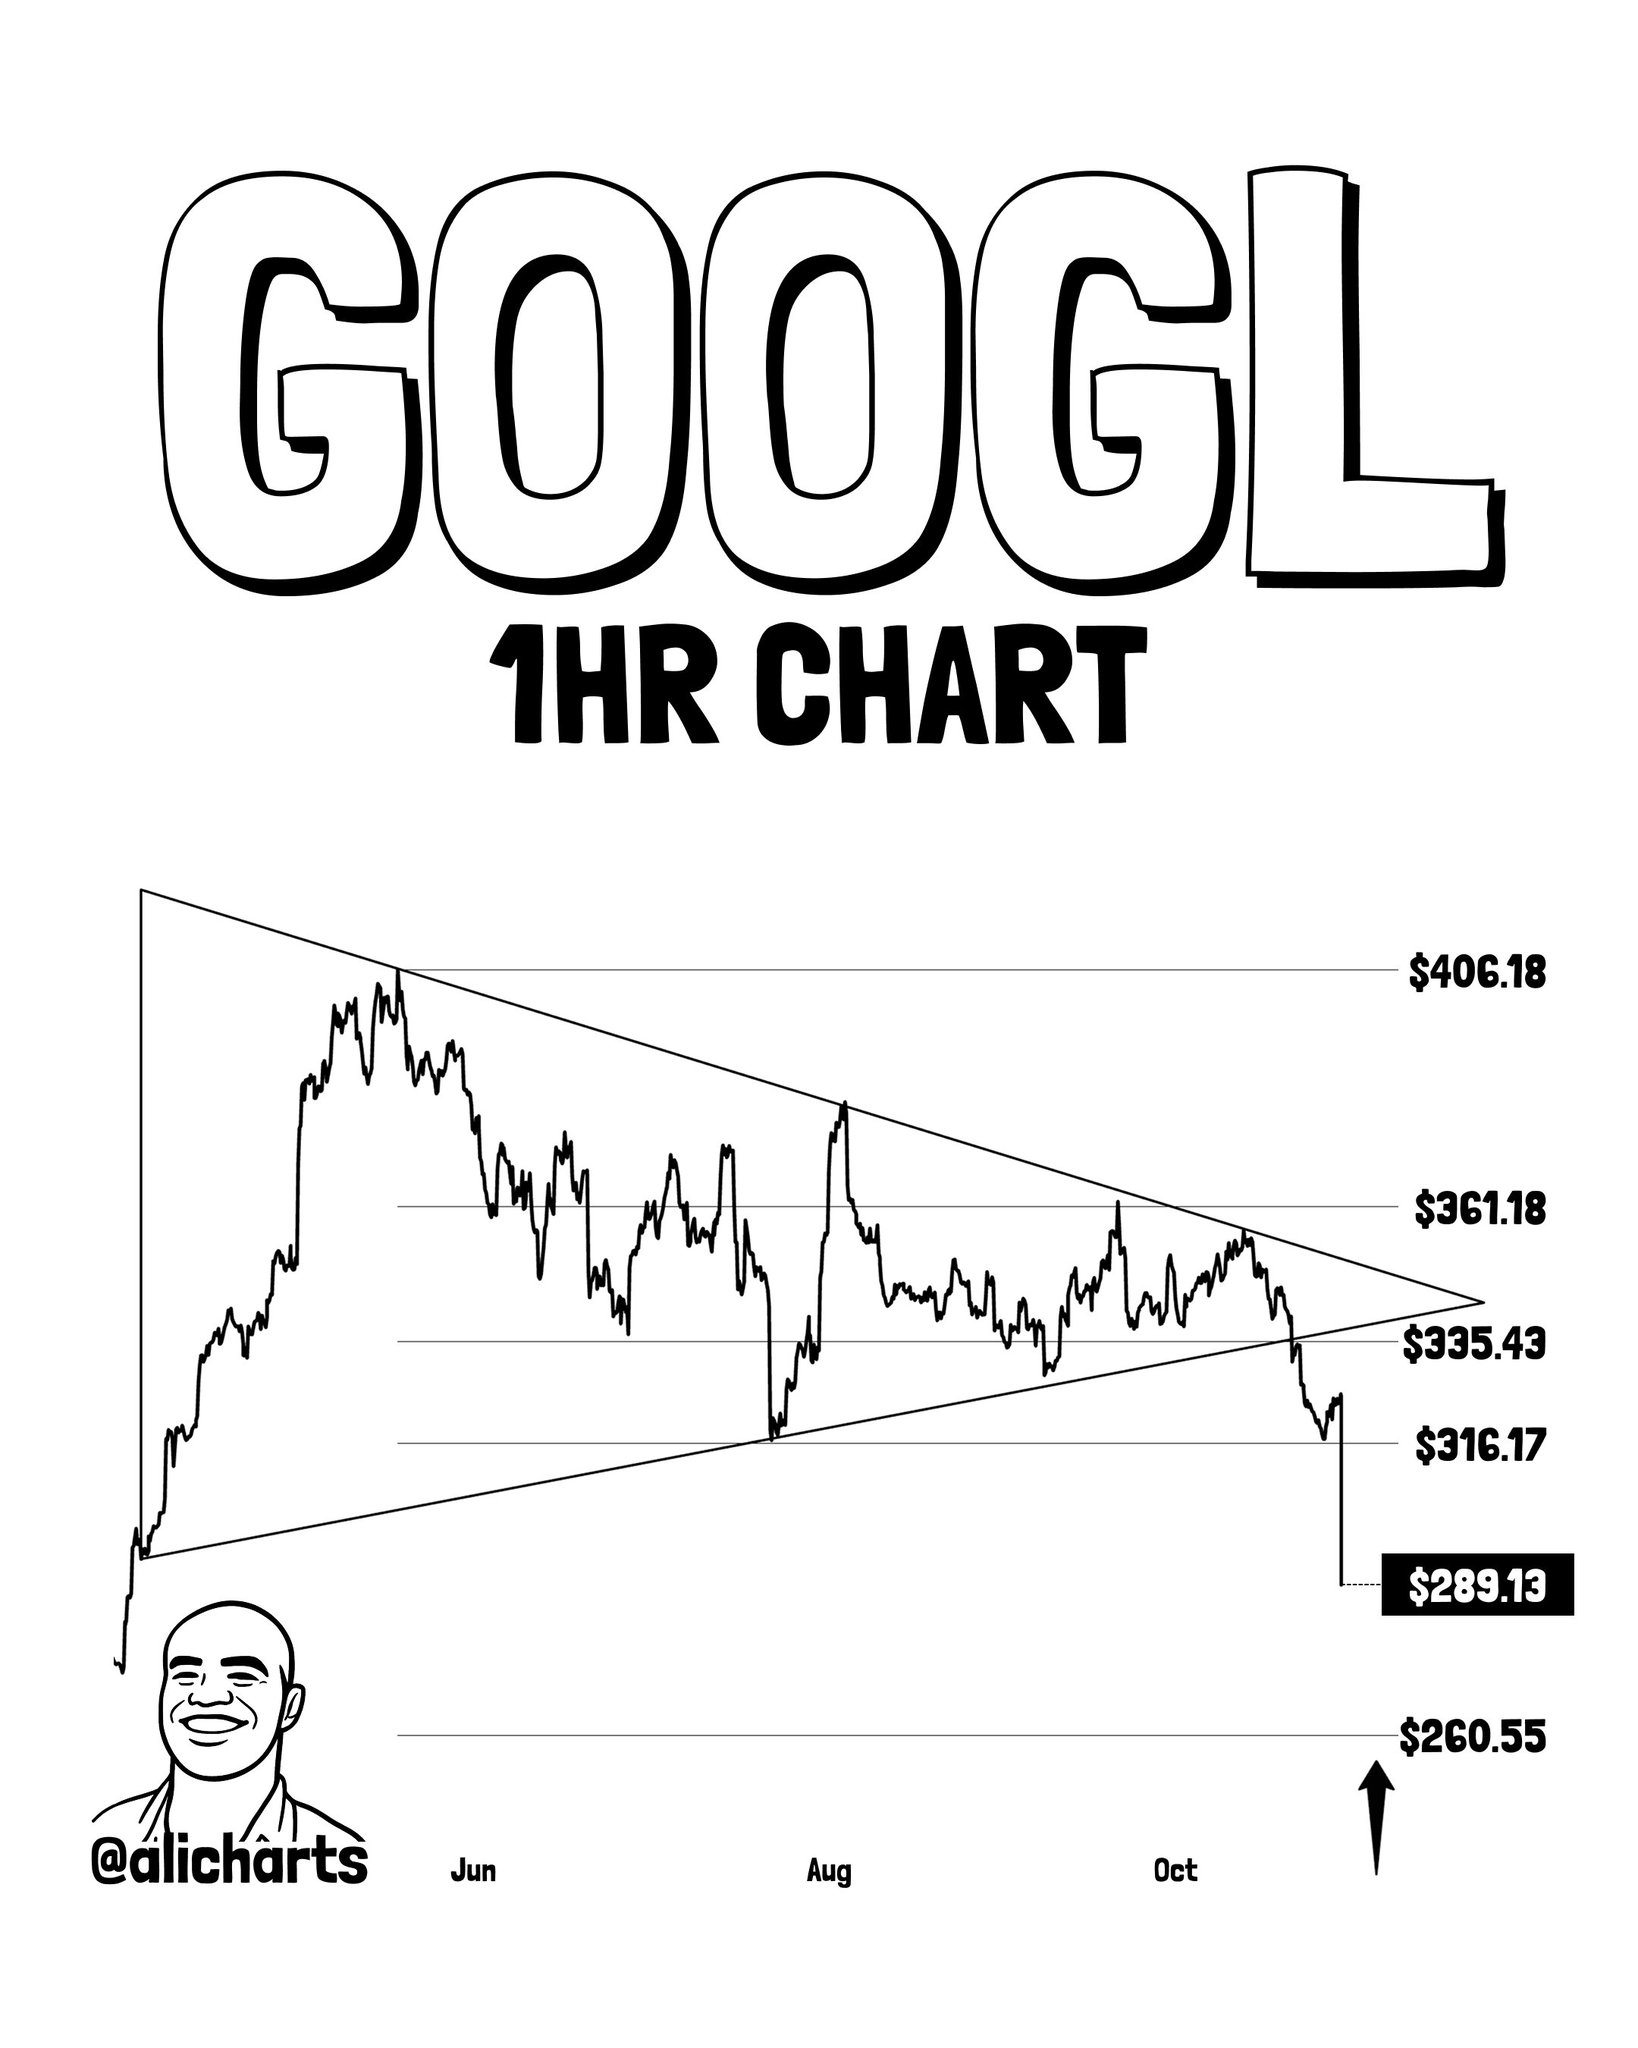
- GOOGL breaks down from a 6-month symmetrical triangle — price at ~$289, confirming breach of $335 and $316 support levels
- Analyst @alicharts called the breakdown on Oct 22 — Q3 revenue miss confirmed on Oct 29 accelerated the move
- Measured pattern target: $260 — approximately 10% below current $289 level per @alicharts hourly chart
Alphabet (GOOGL) is executing a textbook symmetrical triangle breakdown — and a Q3 revenue miss has turned a technical setup into a fundamental-driven collapse. The stock, currently trading near the $289 level highlighted by analyst Ali Martinez (@alicharts), has already breached multiple support levels and is now tracking directly toward a measured pattern target of $260.
Martinez flagged this breakdown on October 22, 2026 — six days before the Q3 earnings report landed. In his original call, he identified the symmetrical triangle forming on GOOGL’s hourly chart since April, noted the breach of the $335 support level, and projected a 20% correction to $260. On October 29, with the earnings catalyst confirmed, Martinez posted a direct follow-up: “I TOLD YOU! Google broke out of a symmetrical triangle, and today’s news that it missed Q3 revenue expectations has only accelerated the move. $GOOGL is now moving closer to the pattern’s target of $260. The breakout is playing out as predicted.”
The Breakdown — Six Months of Compression, Then a Catalyst
A symmetrical triangle is a pattern of converging indecision — price compresses between a descending upper trendline and an ascending lower trendline, building energy toward an eventual resolution. The pattern Martinez identified had been forming on GOOGL’s hourly chart since approximately April 2026, spanning roughly six months of tightening price action between resistance around $406 and a rising floor that ultimately failed.
The critical sequence of levels confirms the breakdown’s severity. Price has already broken through $335.43 and $316.17 — both of which represented interim support zones within the triangle structure. The stock is now trading at approximately $289.13, the level highlighted in the analyst’s chart. The measured move target, derived from the triangle’s widest point projected downward from the breakdown level, sits at $260.55 per the chart annotation — consistent with Martinez’s stated $260 target.
Why the Q3 Revenue Miss Matters Beyond the Headlines
Technical breakdowns from multi-month patterns require a catalyst to accelerate beyond the initial breach. GOOGL’s Q3 revenue miss provided exactly that. When a stock breaks a long-duration consolidation pattern and then reports fundamental underperformance, two things happen simultaneously: technically-motivated sellers who were watching the triangle breakdown add to pressure, and fundamental investors reassess position sizing based on revised revenue expectations. The result is compounded selling that moves price faster toward the measured target than the pattern alone would suggest.
Martinez called the pre-earnings setup correctly on October 22 — before the revenue miss was known. The confirmation six days later, with earnings as the accelerant, validates the underlying pattern read. This is a signal worth tracking in the context of broader market positioning. Readers following similar macro-driven technical setups may also find relevant context in our analysis of Bitcoin Whales Sold $2.52B While ETH Whales Bought — What It Means, which covers how institutional positioning can precede major moves.
The Level Map — Where GOOGL Stands
The chart provides a clear sequence of price levels that define this breakdown’s structure:
| Level | Status | Role |
|---|---|---|
| $406.18 | Broken | Triangle upper resistance origin |
| $361.18 | Broken | Interim resistance zone |
| $335.43 | Broken | Key support, breach confirmed breakdown |
| $316.17 | Broken | Secondary support level |
| $289.13 | Current | Present trading zone (chart labeled) |
| $260.55 | Target | Measured move downside objective |
Level sequence per @alicharts hourly chart | Source: TradingView
The pattern from $335 to $260 represents the 20% correction Martinez projected in his original October 22 note. From the current $289 level, the remaining move to target is approximately 10%.
Scenarios From Here
#### Bullish Scenario — Reclaim of $316A sustained close back above $316.17 would challenge the breakdown thesis and suggest the Q3 miss was already partially priced into the triangle compression. That level must be reclaimed on a closing basis — not an intraday spike — to meaningfully alter the bearish structure. Even in this scenario, the $335 level would represent significant overhead resistance from the prior breakdown zone.
#### Bearish Scenario — Continuation to $260Price continuing below $289 without reclaiming $316 keeps the measured move intact. Martinez’s stated target of $260 remains the primary objective for the pattern. The $260.55 level on the chart represents the full symmetrical triangle projected move and is the level the analyst has explicitly named as the destination.
The breakdown from a six-month symmetrical triangle, confirmed with a fundamental catalyst, is one of the more reliable technical setups in equity analysis. Martinez identified it before the earnings report — the Q3 miss has simply removed any ambiguity about direction. Price is currently at $289, the stated target is $260, and every level between the breakdown point at $335 and the current price has already been breached. The question now is whether $260 absorbs the move or acts as the next level to be tested through.
Watch $316 as the line that, if reclaimed on a close, forces a reassessment. Until then, $260 is the target.
Frequently Asked Questions
What is the measured move target for GOOGL’s symmetrical triangle breakdown?
When did @alicharts first call the GOOGL breakdown, and was it before the Q3 earnings miss?
What level must GOOGL reclaim to invalidate the bearish breakdown thesis?
How far does GOOGL need to fall to reach the pattern’s stated target from current levels?
Source: Ali Charts · Published by CoinsProbe Markets Desk
The opinions and market insights shared on CoinsProbe represent the views of individual authors based on prevailing market conditions at the time of publication. Cryptocurrency investments carry significant risk and volatility. Readers are encouraged to conduct their own research and seek professional financial advice before making investment decisions. CoinsProbe and its contributors do not accept responsibility for financial losses or decisions made based on published content.
CoinsProbe may publish sponsored articles, affiliate links, or promotional collaborations. All sponsored material is clearly labeled to maintain transparency with our audience. Our editorial decisions remain fully independent, and advertising partnerships do not influence reviews, rankings, or published opinions.
Since 2023, CoinsProbe has delivered reliable insights on cryptocurrency, blockchain, and digital assets. Our content is created by experienced researchers and analysts who follow strict editorial standards focused on accuracy, transparency, and credibility. Every article is carefully reviewed and verified using trusted sources and current market data. We provide unbiased analysis and timely updates covering everything from emerging crypto projects to major industry developments.