
- GME prints a TD Sequential 9 buy signal on the daily chart — flagged by analyst Ali Martinez (@alicharts) on October 29, 2026
- Signal validity requires GME to defend $22.60, where the 50-day and 200-day moving averages converge — loss of this level voids the setup
- Martinez targets a rebound to $25 or higher if $22.60 holds — representing ~7% upside from the chart-marked price of $23.33
- Netflix ($61.99, support $60.40) and META ($612.49, trendline near $604) print identical TD Sequential buy signals simultaneously
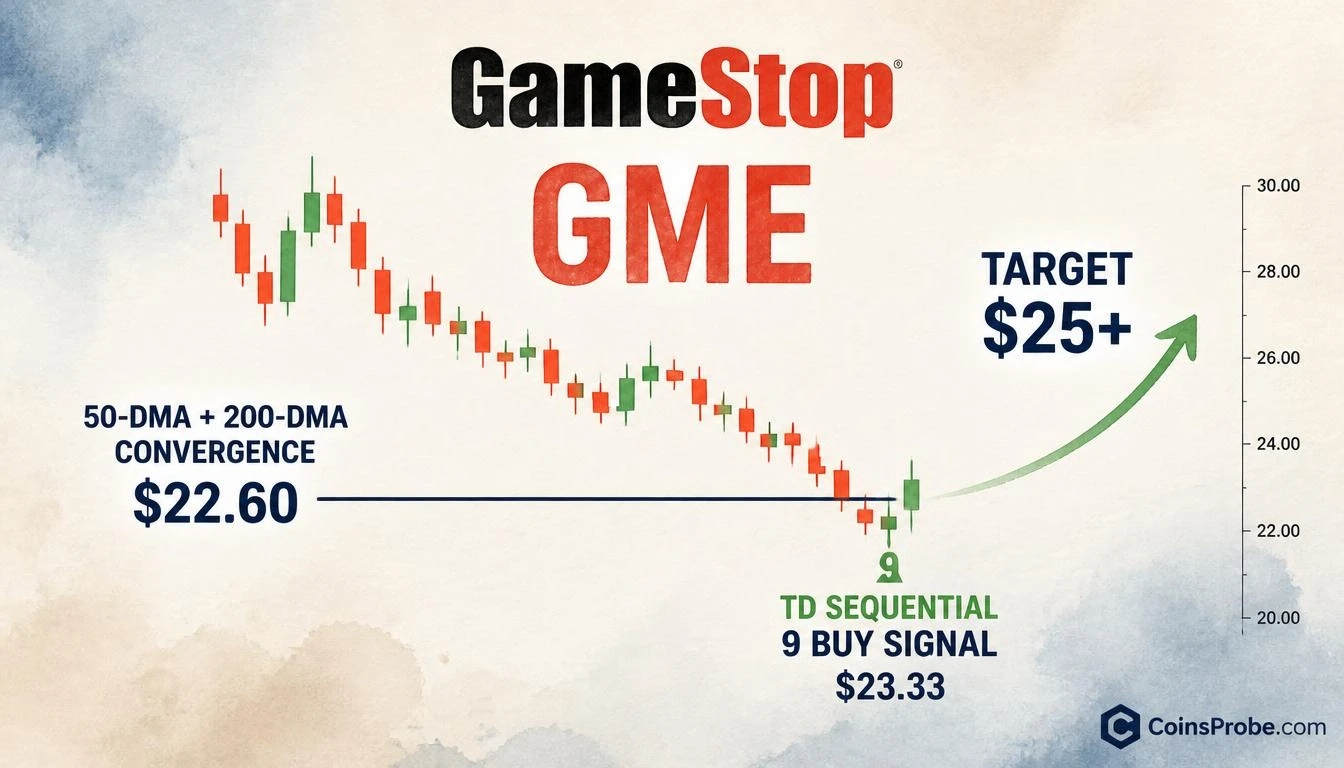
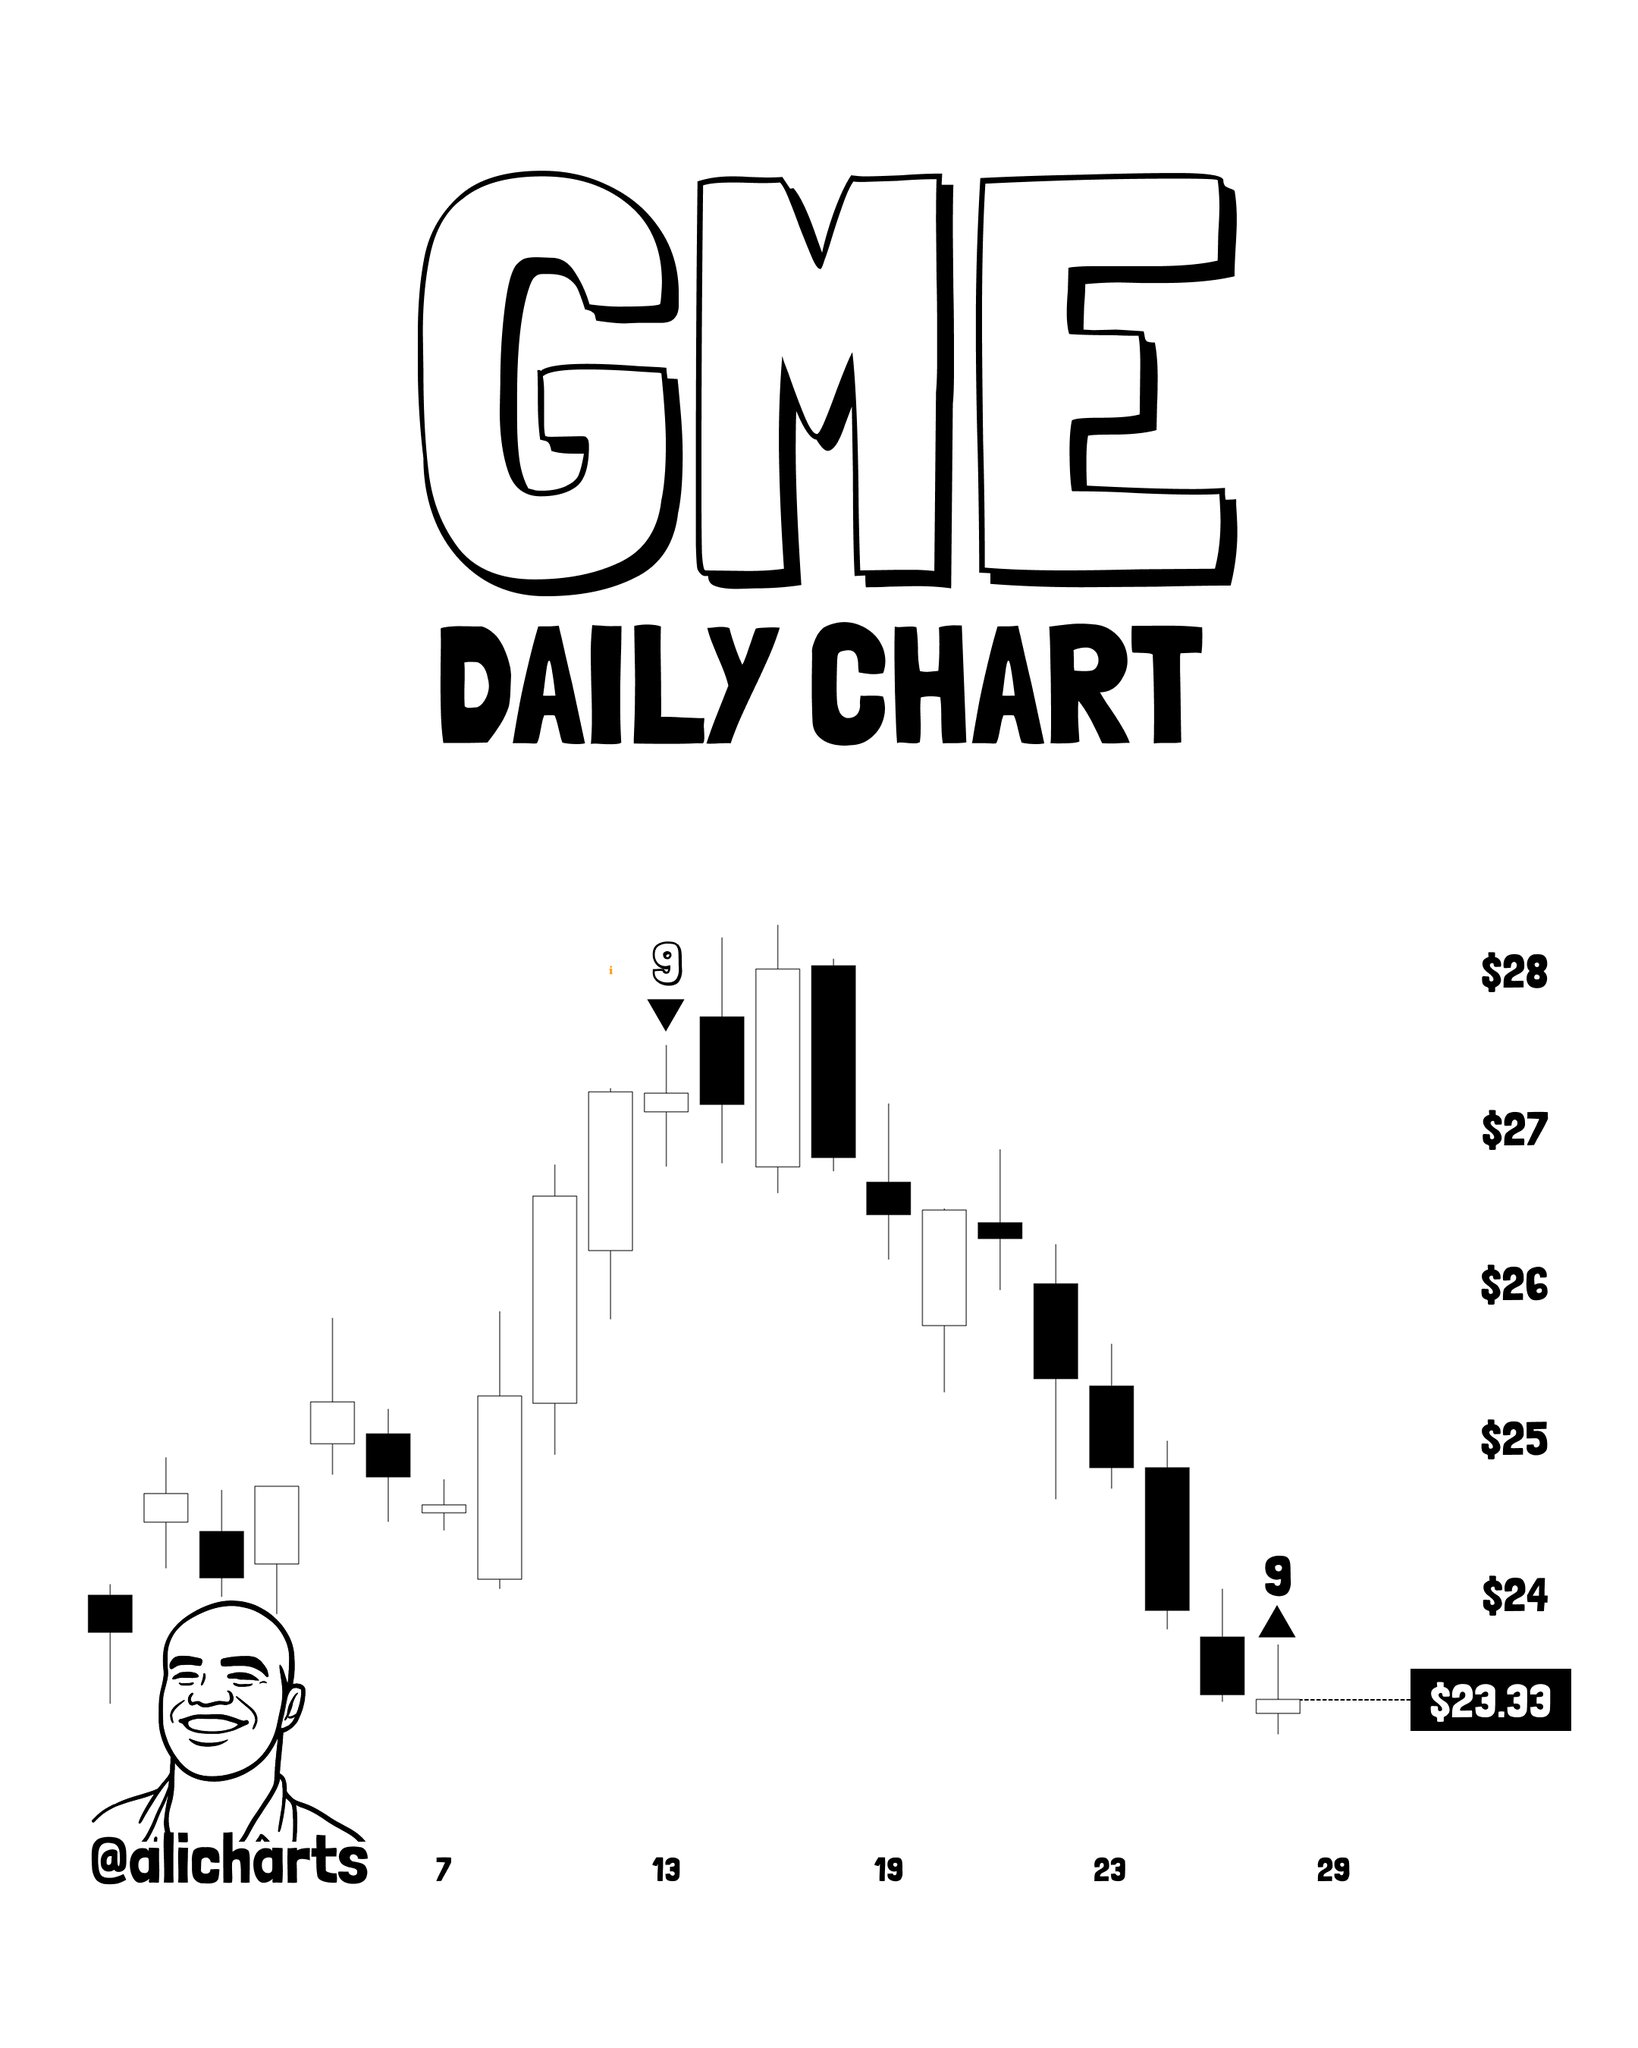
GameStop (GME) has printed a TD Sequential buy signal on the daily chart — a technical exhaustion marker that analyst Ali Martinez (@alicharts) identifies as pointing to a possible one-to-four-candle rebound or the start of a new upward countdown. The signal arrives after a sustained bearish sequence that brought price down to a current chart-marked level of $23.33 on the daily timeframe.
In a five-part thread published October 29, 2026, Martinez was direct: “GameStop is flashing a TD Sequential buy signal on the daily chart. It points to a possible one-to-four-candle rebound or the start of a new upward countdown. For that signal to hold up, $GME needs to defend $22.60, where its 50-day and 200-day moving averages converge. If it does, I’m watching for a rebound toward $25 or higher.”
What the TD Sequential Actually Measures
The TD Sequential is not a price-level indicator — it is a momentum exhaustion counter. It counts nine consecutive daily closes in the same direction. When the ninth close prints after a sustained decline, it signals that selling pressure may be statistically exhausted, opening the possibility of a one-to-four candle counter-move or the beginning of a fresh directional countdown in the opposite direction. It does not predict direction with certainty — it identifies where momentum is running out of statistical fuel.
The daily GME chart flagged by Martinez shows exactly this structure: a bearish TD Sequential “9” printed near the peak around mid-month (annotated with a downward triangle at roughly the $27–$28 zone), followed by a sustained decline to current levels at $23.33. A bullish TD Sequential “9” has now printed at the recent low, marked with an upward triangle — the mirror signal of the earlier sell-side exhaustion. The setup is symmetrical: the same counter that flagged the top is now flagging the bottom of the sequence.
$22.60 — The Convergence Level That Decides Everything
Martinez places the signal’s validity condition at a single, structurally significant level: $22.60. This is where GME’s 50-day moving average and 200-day moving average currently converge. A moving average convergence of this type is not arbitrary support — it represents both medium-term and long-term price equilibrium simultaneously. When both averages align at the same price, they create a compounded demand zone that historically attracts institutional interest and programmatic buying from momentum-based strategies.
The critical point is that the TD Sequential signal is conditional on this defense. If GME holds $22.60, Martinez is targeting a rebound to $25 or higher. That represents approximately 7% upside from the chart-marked price of $23.33. If $22.60 fails, the TD9 buy signal loses its structural anchor — the double moving average floor collapses and the exhaustion reading becomes void without a technical base to support it.
Netflix and META Print the Same Signal
GME is not the only chart Martinez flagged in the October 29 thread. The full five-post sequence identifies three stocks simultaneously printing TD Sequential buy signals — a pattern that suggests the exhaustion is sector-wide rather than isolated to one name.
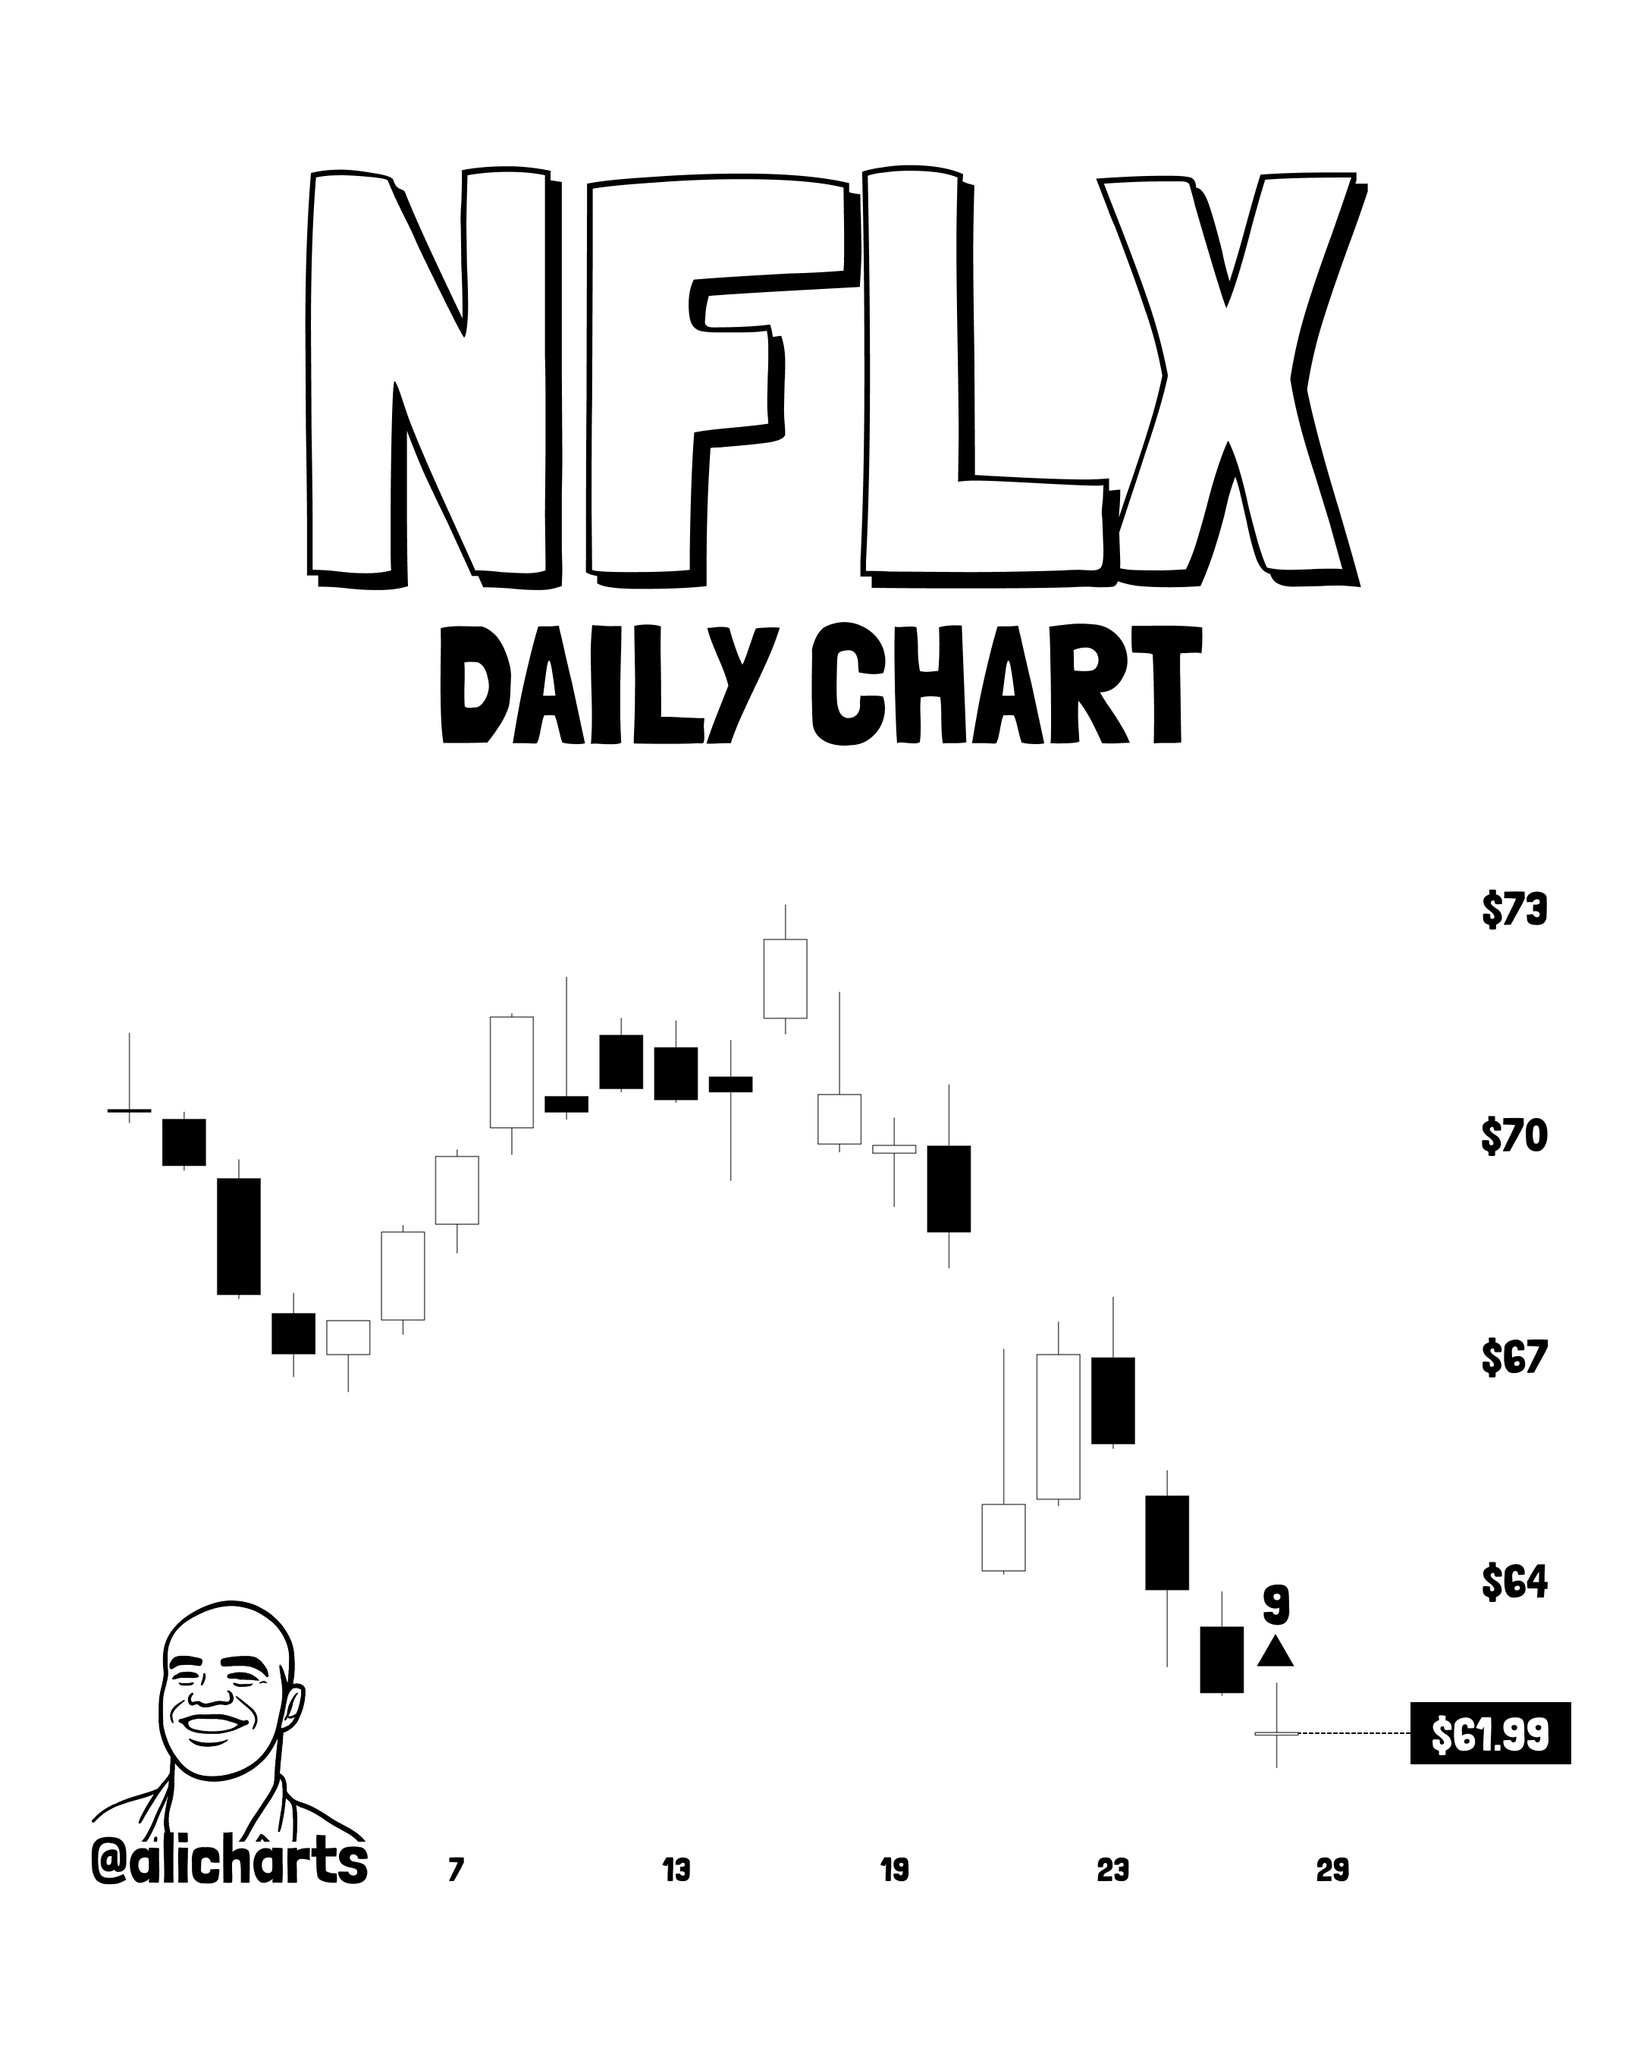
Netflix (NFLX) is showing a parallel setup after its own pullback, with price at $61.99 on the daily chart — below the $64 and $67 levels — and a TD Sequential 9 buy signal printed at the recent low. Martinez identifies $60.40 as the support level NFLX must defend for the signal to remain valid.
META (Meta Platforms) completes the trio. The daily chart shows a TD Sequential sell signal (S13) that appeared mid-month, followed now by a TD Sequential “9” buy signal at the recent low of $612.49. Martinez notes a rising support trendline near $604 as the reference level, representing the floor beneath which the buy signal would lose structural context. The decline into this signal was approximately 21% from the highs, per the tweet commentary.
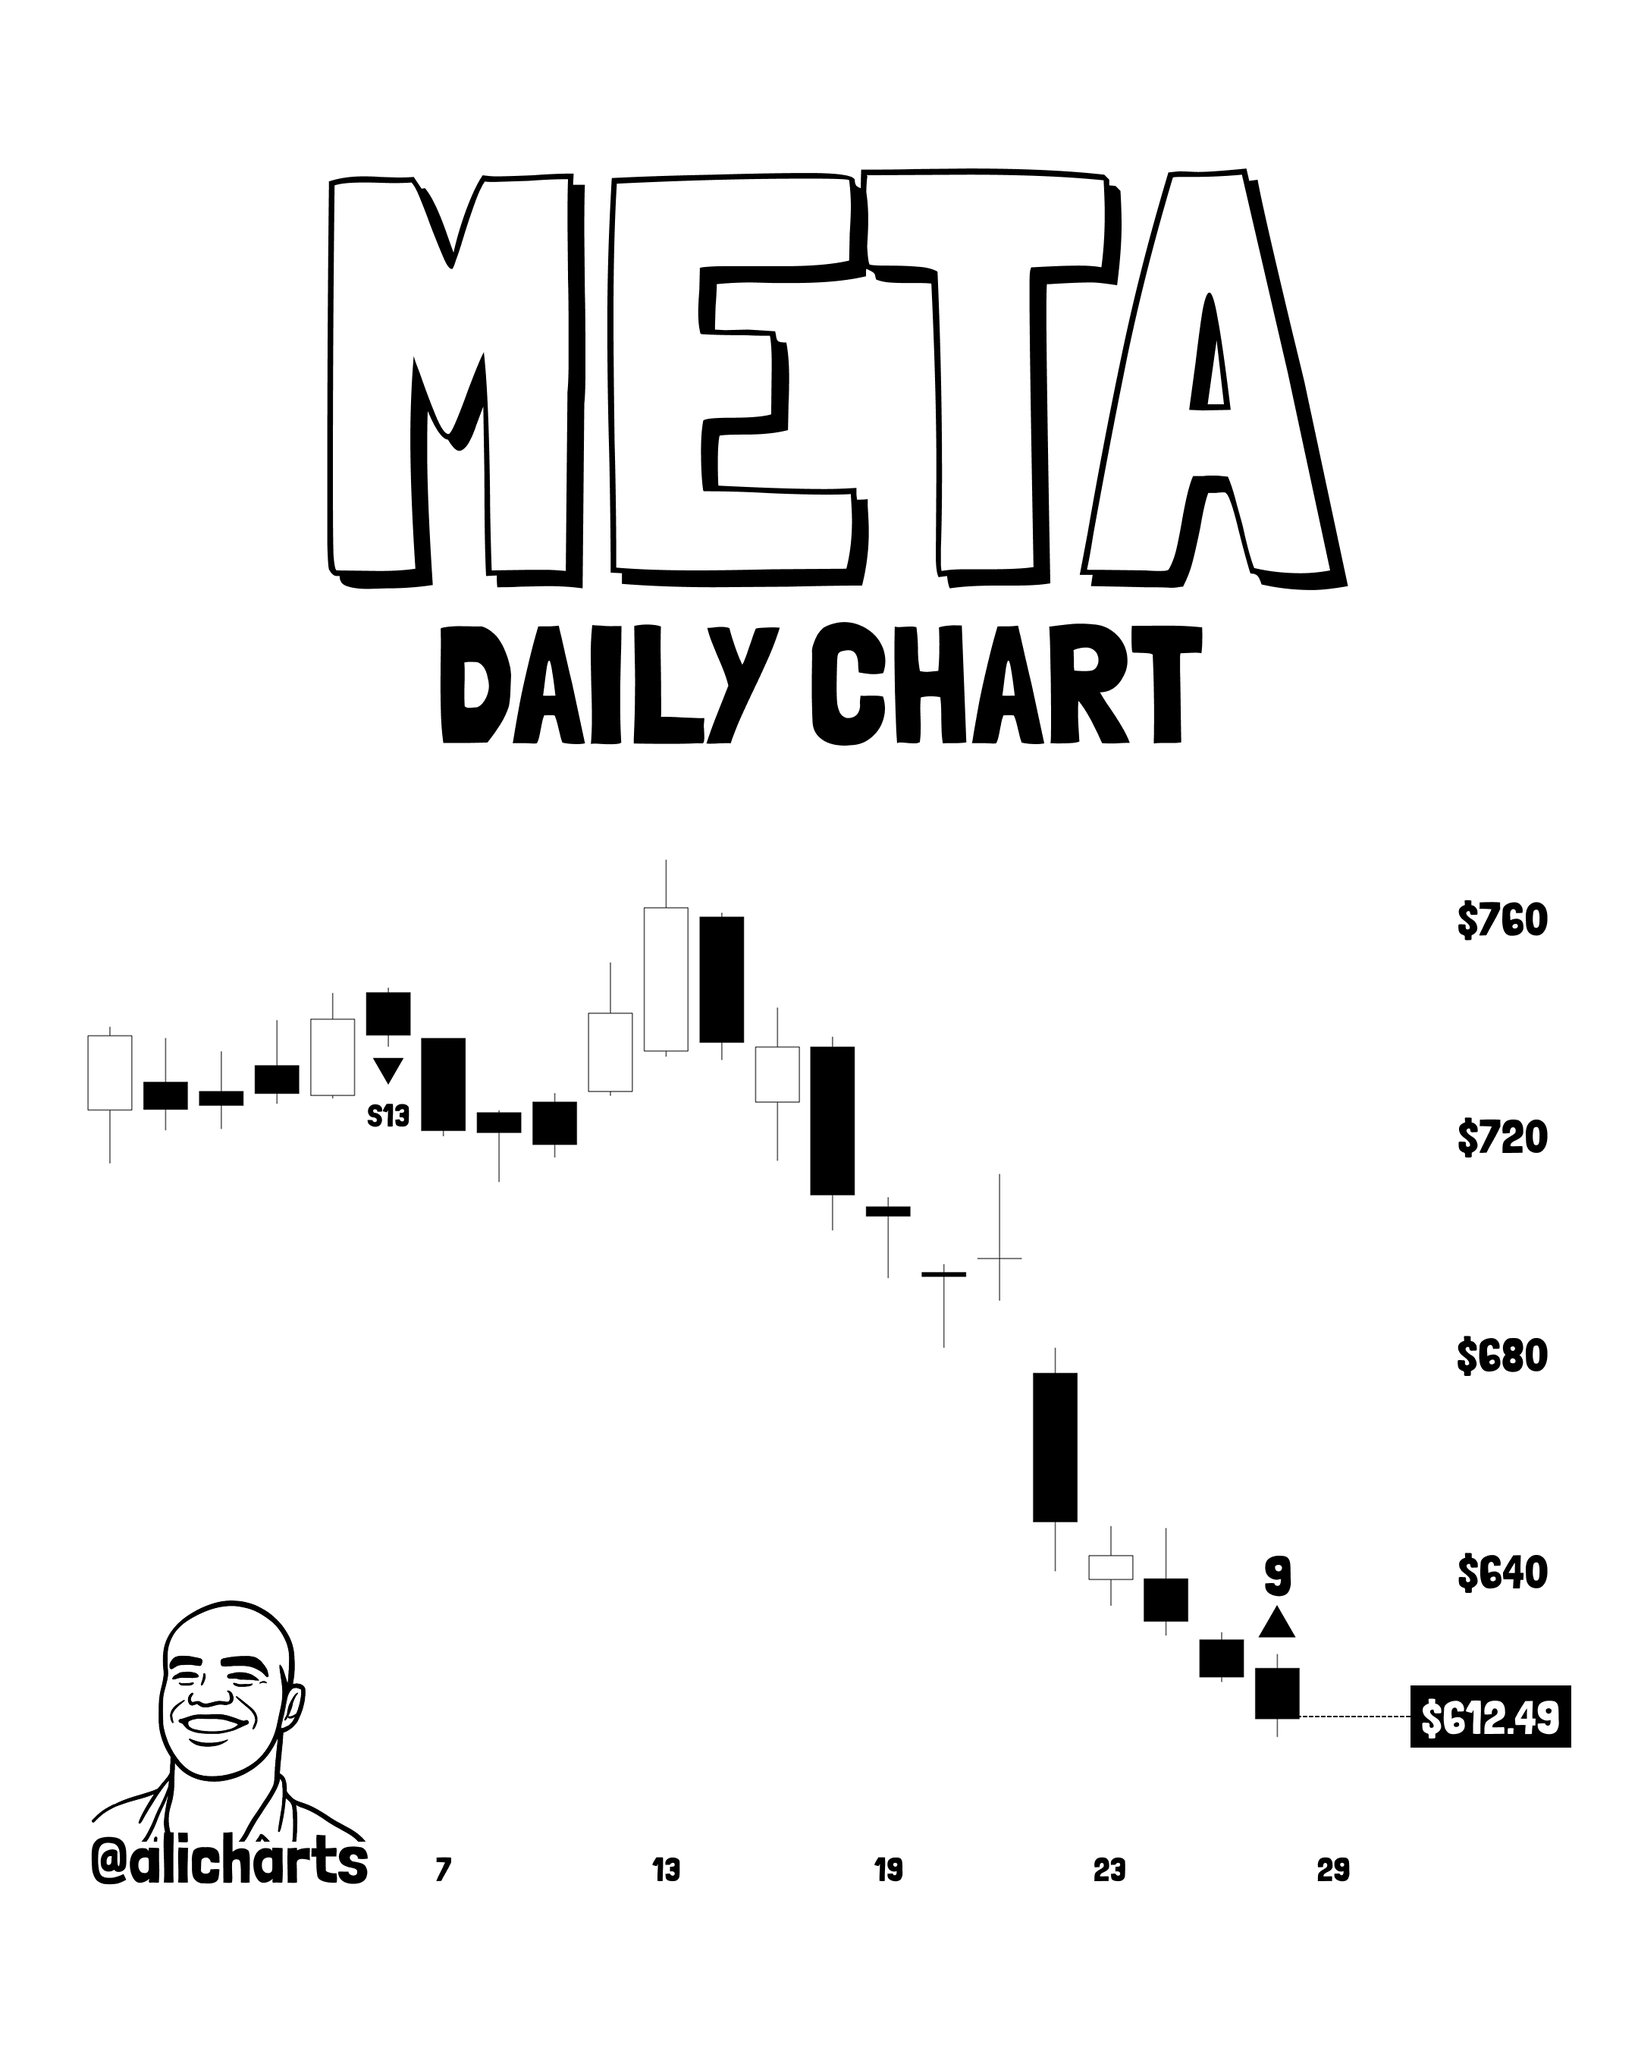
The three simultaneous TD9 buy signals across GME, NFLX, and META form a cluster that Martinez treats as a coherent thesis: broad-based selling exhaustion across growth and retail-sentiment equities, with momentum potentially turning at each respective support zone.
Signal Integrity — What This Says and What It Doesn’t
The TD Sequential buy signal is a non-directional exhaustion marker, not a purchase order. What Martinez’s analysis confirms: nine consecutive daily closes lower have been logged, meeting the statistical threshold for momentum exhaustion. What it does not confirm: that price will reverse, that the reversal will be sustained, or that $25 will be reached within any specific timeframe. The one-to-four candle rebound language is deliberately narrow — this is a short-duration setup, not a macro trend reversal call.
The signal also carries a clear invalidation level. Martinez states explicitly that the entire thesis requires GME to defend $22.60. A daily close below that convergence zone would mark a breakdown through both major moving averages simultaneously — a structurally bearish event that would override the TD Sequential read.
For readers tracking similar setups in crypto, the same TD Sequential logic has been applied across digital assets — including PENGU’s TD Sequential buy signal, where the last three instances led to +78% and +67% rallies. The indicator’s mechanism is identical across asset classes.
Bullish Scenario
GME defends $22.60 on a daily closing basis — the 50-day and 200-day MA convergence holds as support. The TD Sequential one-to-four candle rebound triggers, with Martinez’s first target at $25 or higher. A sustained hold above $22.60 opens the possibility of a new upward TD Sequential countdown beginning, which would shift the signal from short-term bounce to potential trend reversal setup.
Bearish Scenario
A daily close below $22.60 collapses both moving averages simultaneously and voids the TD Sequential signal’s structural foundation. With no remaining named support level below $22.60 in the analysis, the setup becomes directionally open to the downside. Martinez does not specify a secondary target below this level — the signal framework simply breaks.
The TD Sequential buy signal on GME’s daily chart is a textbook exhaustion read after a sustained nine-bar decline — symmetrical with the sell signal that printed at the month’s highs. Martinez has named the exact level that determines whether this signal becomes a tradeable bounce: $22.60, where the 50-day and 200-day moving averages currently converge. Above that level, the path to $25 remains open. Below it, the signal is invalidated. Every session until that level is tested or the rebound triggers is a confirmation window. Watch $22.60.
Source: x.comFrequently Asked Questions
What is a TD Sequential buy signal and how reliable is it for GME?
Why is $22.60 the critical level for the GME buy signal?
What is Martinez’s price target if GME holds $22.60?
Are Netflix and META showing the same buy signal as GameStop right now?
Source: Ali Charts · Published by CoinsProbe Markets Desk
The opinions and market insights shared on CoinsProbe represent the views of individual authors based on prevailing market conditions at the time of publication. Cryptocurrency investments carry significant risk and volatility. Readers are encouraged to conduct their own research and seek professional financial advice before making investment decisions. CoinsProbe and its contributors do not accept responsibility for financial losses or decisions made based on published content.
CoinsProbe may publish sponsored articles, affiliate links, or promotional collaborations. All sponsored material is clearly labeled to maintain transparency with our audience. Our editorial decisions remain fully independent, and advertising partnerships do not influence reviews, rankings, or published opinions.
Since 2023, CoinsProbe has delivered reliable insights on cryptocurrency, blockchain, and digital assets. Our content is created by experienced researchers and analysts who follow strict editorial standards focused on accuracy, transparency, and credibility. Every article is carefully reviewed and verified using trusted sources and current market data. We provide unbiased analysis and timely updates covering everything from emerging crypto projects to major industry developments.