
- ETH trades at $2,512.24 (+0.43% 24h) as October spot data shows a sell-side tilt on Binance
- Selling exceeded buying by 251.7M USDT (51.50% vs 48.50%) across 8.379B USDT total Oct 1–14 volume per CryptoQuant/@Woo_Minkyu
- Oct 14's nine-hour session flipped buying to 52.86%, trimming the sell lead from 259.1M to 251.7M USDT
- Coinbase Premium Index was negative all 13 completed days through Oct 13; cumulative Binance inflows hit 182,614 ETH
Ethereum is trading at $2,512.24 — up 0.43% in the past 24 hours — with a market cap of $306.8 billion. Beneath that flat surface, CryptoQuant’s cumulative Binance spot flow data for October tells a more specific story: sellers have held a consistent, if modest, structural edge over buyers for the first two weeks of the month.
CryptoQuant analyst Woo Minkyu (@Woo_Minkyu) published the full breakdown on October 14, 2026. His conclusion: “The broader picture is therefore one of recent buying support within a period that still shows slightly stronger selling.” The note is careful to resist extrapolation — Minkyu explicitly flags that “sustained buying across further completed periods would strengthen the case for a recovery,” but that case is not yet confirmed.
The October Spot Flow Breakdown — $8.38 Billion in 14 Days
From October 1 through October 14 at 09:00 UTC, Binance ETH/USDT spot trading accumulated a total volume of 8.379 billion USDT. Of that, 4.315 billion USDT — or 51.50% — was classified as selling. Buying accounted for 4.064 billion USDT, or 48.50%. The net difference: selling exceeded buying by 251.7 million USDT — what Minkyu characterizes as a “modest sell-side bias.”
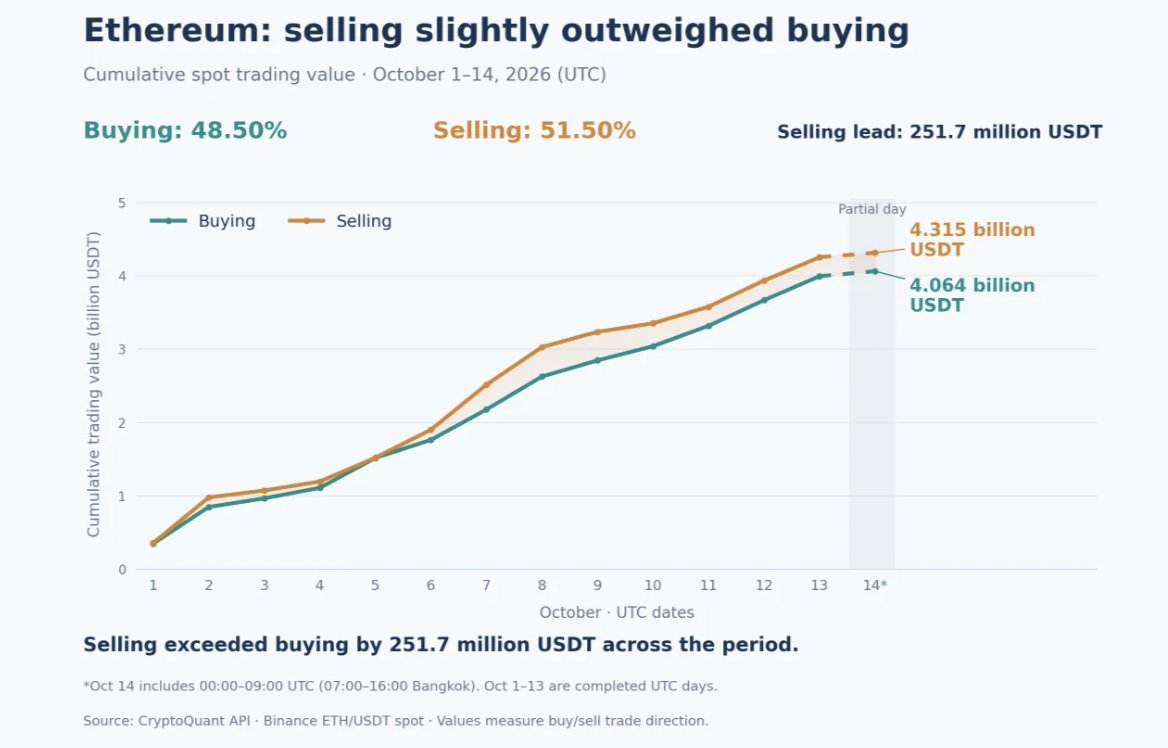
The gap was not static. On October 14’s nine-hour completed window alone, buying flipped to 52.86% of trading value — generating a 7.4 million USDT buying surplus for that session. That intraday reversal trimmed the accumulated selling lead from 259.1 million USDT down to 251.7 million USDT. It is directionally meaningful, but Minkyu’s note is explicit: one session’s surplus does not cancel thirteen days of structural sell-side dominance.
| Metric | Value | Share of Total |
|---|---|---|
| Total Spot Volume (Oct 1–14) | 8.379B USDT | 100% |
| Buying Volume | 4.064B USDT | 48.50% |
| Selling Volume | 4.315B USDT | 51.50% |
| Net Sell Lead | 251.7M USDT | — |
| Oct 14 (9hr) Buying Share | 52.86% | Buying surplus: 7.4M USDT |
Source: CryptoQuant / @Woo_Minkyu, October 14, 2026
Supporting Indicators Remain Cautious
Minkyu pairs the spot flow data with two supporting metrics, and both reinforce the cautious framing rather than contradict it.
First, cumulative exchange net inflows to Binance since October 1 reached 182,614 ETH through October 13. Sustained net inflows to a centralized exchange indicate that more ETH is moving onto the platform — a pattern historically associated with increased selling availability rather than accumulation.
Second, the Coinbase Premium Index — which measures the price difference between ETH on Coinbase Pro versus Binance — was negative on all 13 completed days through October 13. A persistently negative Coinbase Premium implies that US-based demand on Coinbase has been running consistently below Binance pricing throughout the month. Minkyu is careful here: “A negative reading does not necessarily imply that US investors are selling Ethereum on a large scale, nor does it confirm the future price direction. The gap can also be influenced by differences in liquidity and trading conditions across platforms.” That qualification matters — the indicator is a signal, not a verdict.
This stands in contrast to the recent CryptoQuant analyst consensus published separately, which placed ETH bullish consensus at 84.4% — a reminder that on-chain analyst positioning and short-term spot flow data can tell different stories on different timeframes. Readers tracking ETH’s near-term technical setup may also note that ETH recently printed a TD Sequential buy signal on the 4-hour chart, which measures momentum exhaustion rather than volume flow.
What the Data Says — And What It Doesn’t
The spot flow analysis measures one thing: the cumulative directional balance of completed spot transactions on Binance ETH/USDT between October 1 and 14. A 51.50%/48.50% split is not a collapse — it is a tilt. Minkyu’s own framing — “modest sell-side bias” and “slight lead” — reflects that the gap is real but not extreme.
What the data confirms: selling has structurally outpaced buying on the largest ETH/USDT spot venue for the first two weeks of October. What it does not confirm: future price direction, the scale of US investor selling intent, or whether the October 14 buying uptick marks a sustained shift. Minkyu’s stated condition for a stronger recovery case is explicit — “sustained buying across further completed periods” must materialize before the cautious reading resolves.
Bullish Scenario
If buying continues to outpace selling in subsequent completed daily periods — reducing the 251.7 million USDT cumulative sell lead toward neutral — the data would, per Minkyu’s own framework, “strengthen the case for a recovery.” The October 14 session’s 52.86% buying share and 7.4 million USDT surplus is the first data point consistent with that path.
Bearish Scenario
If selling reasserts its lead in October’s remaining sessions — particularly if the Coinbase Premium Index stays negative and exchange net inflows continue accumulating above 182,614 ETH — the current cautious reading deepens. In that scenario, the October 14 buying uptick reads as a temporary correction within an ongoing sell-dominated month, not a turning point.
The metric to track is straightforward: CryptoQuant’s daily ETH spot flow figures on Binance update in completed-period windows. Whether buying holds above 50% in the sessions that follow October 14 is the single variable Minkyu identifies as determinative. At $2,512.24, ETH is stable — but the October spot tape has not yet handed buyers a structural majority.
Frequently Asked Questions
What does a 51.50% sell share on Binance ETH/USDT actually mean for Ethereum’s price?
Why did the October 14 buying surge not reverse the overall sell-side lead?
What is the Coinbase Premium Index and why does a negative reading matter for ETH?
What specific condition does CryptoQuant’s analyst say is needed for ETH buying to confirm a recovery?
Source: CryptoQuant · Published by CoinsProbe Markets Desk
The opinions and market insights shared on CoinsProbe represent the views of individual authors based on prevailing market conditions at the time of publication. Cryptocurrency investments carry significant risk and volatility. Readers are encouraged to conduct their own research and seek professional financial advice before making investment decisions. CoinsProbe and its contributors do not accept responsibility for financial losses or decisions made based on published content.
CoinsProbe may publish sponsored articles, affiliate links, or promotional collaborations. All sponsored material is clearly labeled to maintain transparency with our audience. Our editorial decisions remain fully independent, and advertising partnerships do not influence reviews, rankings, or published opinions.
Since 2023, CoinsProbe has delivered reliable insights on cryptocurrency, blockchain, and digital assets. Our content is created by experienced researchers and analysts who follow strict editorial standards focused on accuracy, transparency, and credibility. Every article is carefully reviewed and verified using trusted sources and current market data. We provide unbiased analysis and timely updates covering everything from emerging crypto projects to major industry developments.