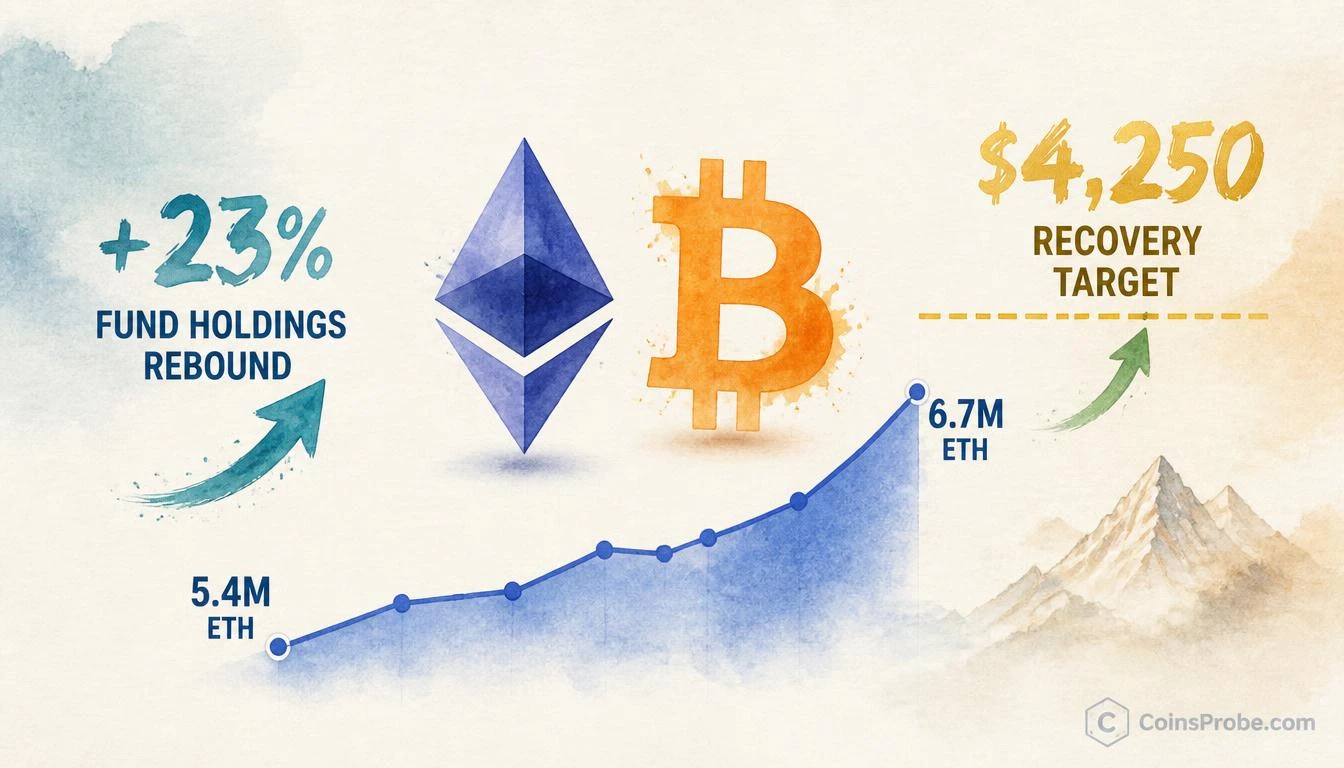

- ETH fund holdings rose from about 5.45M to 6.70–6.77M ETH, up 23–24% since July. Price on the chart is $2,680.
- That rebound is approaching the October 2025 holdings peak, not confirmed through it. A reclaim would strengthen the thesis.
- BTC fund holdings rose from about 1.235M to 1.31–1.32M BTC, up 6–7%, and remain below the October peak and the May high. Price on the chart is $83,500.
- Both are rising. The note does not call it a rotation out of Bitcoin. The risk it names is renewed redemptions.
Ethereum is leading institutional recovery across crypto fund exposure — with fund holdings rebounding 23–24% from their July 2026 lows even as the full recovery thesis remains one key confirmation away. At the time of writing, Bitcoin is trading at approximately $85,990, up 2.05% in the past 24 hours, with a market cap of $1.73 trillion. Ethereum’s price has already moved from roughly $1,500 to $2,680 — a completed +79% recovery — but the structural signal that would validate the next leg is still pending.
The analysis comes from CryptoQuant contributor @MorenoDV_, published via the official @cryptoquant_com channel. His exact conclusion: “A reclaim of previous holdings highs would strengthen the recovery thesis.” That is not a hedged observation — it is a precise, testable condition tied to a specific on-chain metric: whether holdings reclaim the October 2025 peak they are now approaching. The quicktake puts current holdings at 6.70–6.77M ETH.
Signal 1 — Ethereum Fund Holdings: +23% Rebound, But the Critical Level Remains
The chart shared by @cryptoquant_com tracks Ethereum fund holdings against price from September 2025 through October 2026. The data tells a two-part story: recovery already underway, but the defining confirmation not yet delivered.
Fund holdings bottomed alongside price in July 2026, at approximately 5.4M ETH. Since then, institutional positions have rebuilt to roughly 6.7M ETH — a gain of 23–24% in holdings volume. Price tracked that accumulation almost exactly, rising from $1,500 to the current $2,680. The correlation is not coincidental. When funds add ETH at this scale, they are expressing directional conviction through regulated, reportable vehicles — not speculative spot buying.
Holdings have climbed from about 5.45M to 6.70–6.77M ETH, an addition of roughly 1.25–1.32M. They are approaching the October 2025 peak, not sitting clearly through it. The $4,250–$4,750 area is the old price high on the chart. Current price is $2,680. Moreno does not set that zone as the measured target of a holdings break.
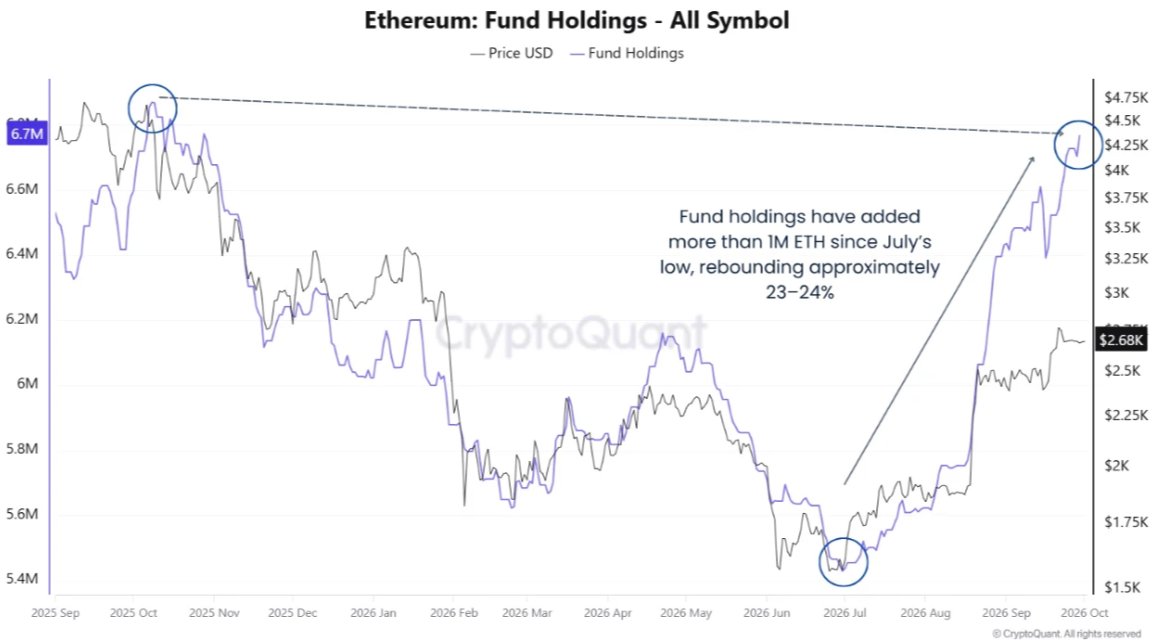
The note does not call a double top. The risk it names is renewed redemptions, which would weaken this source of support.
Signal 2 — Bitcoin Fund Holdings: Confirmed Accumulation, One Resistance Level Remaining
The second chart in @MorenoDV_’s analysis covers Bitcoin fund holdings across the same October 2025 to October 2026 window. The structure is different from Ethereum — and importantly, the confirmation level is closer.
Bitcoin fund holdings bottomed at approximately 1.235M BTC in July 2026, alongside price near $60,000. Since then, institutional positions have rebuilt by roughly 85,000 BTC — a 6–7% increase — bringing total fund holdings to approximately 1.31M BTC. Price has recovered from $60,000 to $83,500 in parallel, a completed +39% move. The pattern mirrors Ethereum’s recovery structure but at a more compressed scale.
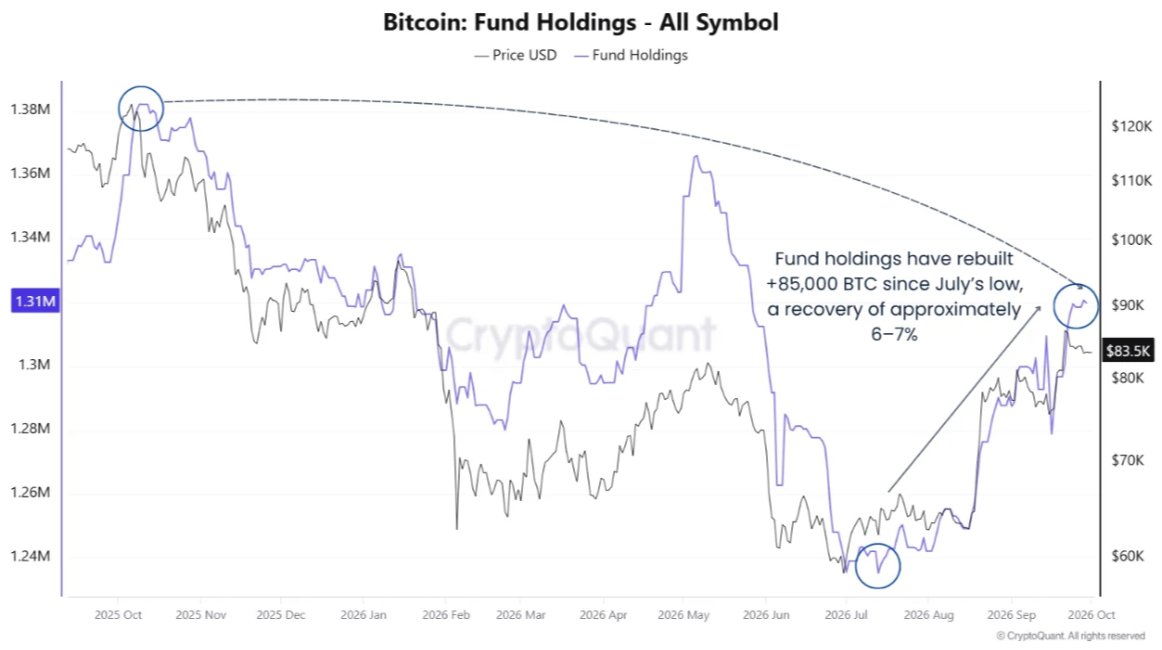
Bitcoin holdings have rebuilt by about 75,000–85,000 BTC, to 1.31–1.32M, and are still below the October 2025 peak and the May rebound high. Price on the chart is $83,500, against a July low near $60,000. The descending line from the old high runs toward the $90,000 gridline, but Moreno does not name $90,000 as the confirmation close, and he does not set $75,000–$80,000 as support.
Why Fund Holdings Are a Different Signal Than Price Alone
Fund holdings data — tracked via regulated investment vehicles — measure institutional conviction in a way that spot price cannot. Price reflects all market participants simultaneously: retail, algorithmic, leveraged. Fund holdings isolate a single cohort: institutions operating through reportable, custody-held structures that cannot easily unwind intraday.
When fund holdings rise +23% in ETH while price rises +79%, the holdings increase is the leading structural signal. It represents deliberate, sustained accumulation — not momentum chasing. The same logic applies to Bitcoin’s 85,000 BTC rebuild. That volume moved into custody over months, not hours. It does not reverse on a single bad week.
ETH has rebuilt a larger share of the exposure it lost. BTC holdings are rising too, but remain below both prior highs. The note says this does not show capital rotating out of Bitcoin. A reclaim of previous holdings highs would strengthen the thesis. Holdings alone do not confirm a durable bull market.
Bull and Bear Scenarios
Bullish Scenario
Ethereum fund holdings are already at 6.70–6.77 million ETH, approaching the October 2025 peak after a 23–24% rebound from about 5.45 million. Bitcoin holdings have risen from about 1.235 million to 1.31–1.32 million BTC and are still below both the October peak and the May rebound high. The condition Moreno sets is continued growth in those balances, including during price pullbacks, with positive fund flows and spot demand behind them. A reclaim of the previous holdings highs would strengthen the recovery thesis. Price has recovered with the balances — ETH to $2,680, BTC to $83,500 — but both remain well below earlier highs, so the note treats this as improving participation inside an incomplete recovery.
Bearish Scenario
The risk in the quicktake is renewed redemptions. That would cut the holdings rebuild and remove this source of support. Holdings alone do not show why the coins are held, and they do not confirm a durable bull market. The note does not set a $90,000 failure, a $75,000–$80,000 retest, or a double top as the invalidation.
Closing
Fund demand is rebuilding in both assets, and the rebound is larger in Ethereum relative to its July base: about +23–24% in ETH holdings versus +6–7% in BTC. ETH is approaching its October 2025 holdings peak. BTC is still short of its October peak and its May high. Both balances are rising, so this is not evidence of capital rotating out of Bitcoin. A reclaim of the previous holdings highs would strengthen the recovery thesis. Renewed redemptions would weaken it.
Frequently Asked Questions
Why does the note say Ethereum is leading?
ETH holdings rose about 23–24% from the July low, against about 6–7% for Bitcoin, and are closer to their October 2025 peak. BTC holdings are still below that peak and the May rebound high.
Does the rise in ETH holdings mean funds are selling Bitcoin?
No. The quicktake says both balances are rising, so it does not establish a rotation out of BTC into ETH.
What would strengthen the recovery thesis?
A reclaim of the previous holdings highs, with balances still growing during pullbacks and spot demand holding up.
The opinions and market insights shared on CoinsProbe represent the views of individual authors based on prevailing market conditions at the time of publication. Cryptocurrency investments carry significant risk and volatility. Readers are encouraged to conduct their own research and seek professional financial advice before making investment decisions. CoinsProbe and its contributors do not accept responsibility for financial losses or decisions made based on published content.
CoinsProbe may publish sponsored articles, affiliate links, or promotional collaborations. All sponsored material is clearly labeled to maintain transparency with our audience. Our editorial decisions remain fully independent, and advertising partnerships do not influence reviews, rankings, or published opinions.
Since 2023, CoinsProbe has delivered reliable insights on cryptocurrency, blockchain, and digital assets. Our content is created by experienced researchers and analysts who follow strict editorial standards focused on accuracy, transparency, and credibility. Every article is carefully reviewed and verified using trusted sources and current market data. We provide unbiased analysis and timely updates covering everything from emerging crypto projects to major industry developments.