
- Bitcoin trades at $80,308 (-1.00% 24h) with a $1.613T market cap as its M2 ratio pulls back from cycle highs
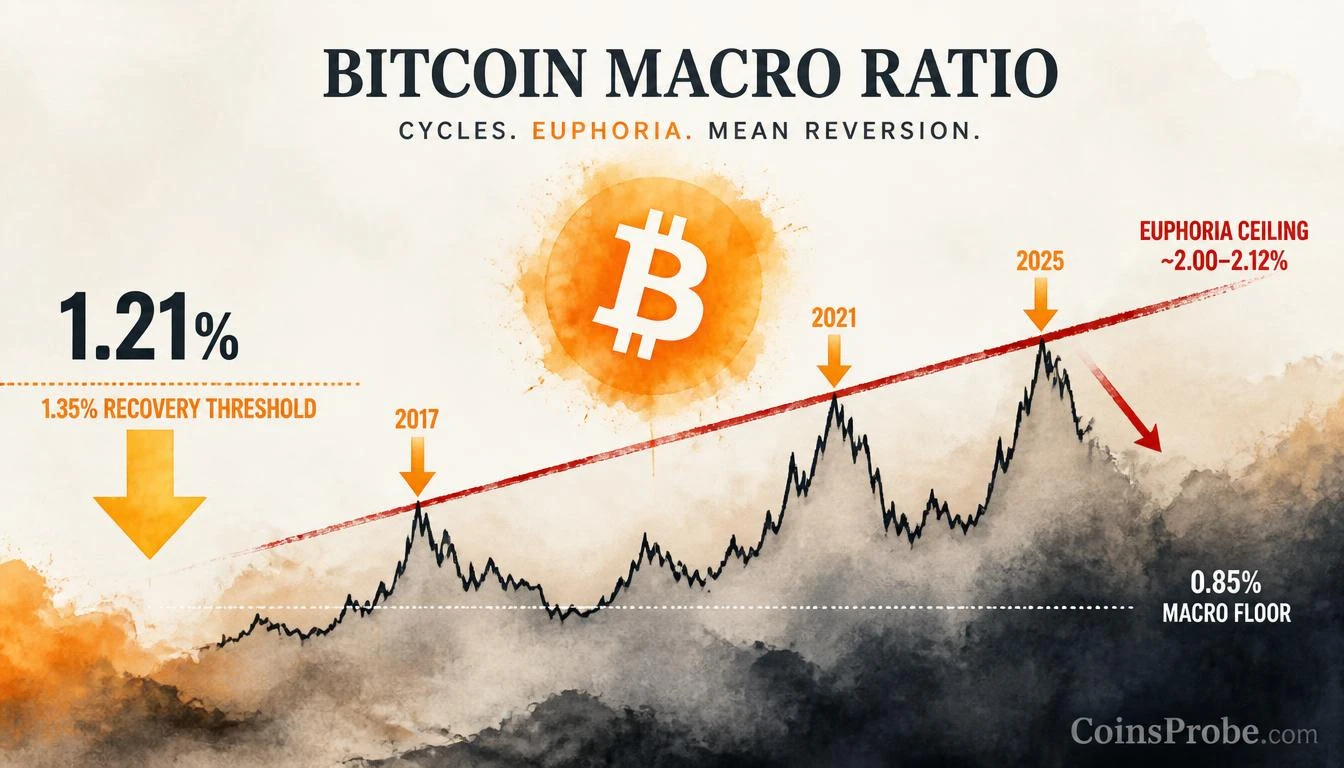
- BTC Market Cap / Global M2 ratio touched the red euphoria trendline in 2017, 2021, and 2025 — rejected all three times per Alphractal
- Current ratio reads 1.21% — below the critical 1.35% orange recovery threshold identified by Alphractal
- Bulls need a sustained ratio close above 1.35%; bears watch the 0.85% white base support as the macro floor
Bitcoin is trading at $80,308 — down 1.00% in the past 24 hours — with a market capitalization of approximately $1.613 trillion. Beneath that headline number, a macro liquidity ratio is telling a more precise story: Bitcoin’s market cap relative to Global M2 money supply has now pulled back from a zone that has marked a local top in every single cycle since 2017.
That is the conclusion from analytics firm Alphractal (@Alphractal), which published the ratio chart on September 20, 2026. Their signal text reads: “A particularly intriguing trend line emerges when we compare Bitcoin’s Market Cap to Global M2 in USD. The red line marked zones of euphoria in 2017, 2021, and 2025. In each of these cycles, the ratio encountered resistance near this trend line and failed to break above it.”
This is not a subjective read — it is a three-cycle empirical pattern with no exceptions on record.
What the BTC Market Cap / Global M2 Ratio Actually Measures
Before interpreting the current reading, the mechanics of this indicator demand a precise explanation.
Global M2 represents the total broad money supply across major economies — the United States, European Union, China, Japan, and others — expressed in USD. It is the single largest liquidity variable in global finance, expanding when central banks ease and contracting under tightening regimes.
When you divide Bitcoin’s market cap by Global M2, the resulting ratio answers one question: How large is Bitcoin’s market cap relative to the total pool of global liquidity? A rising ratio means Bitcoin is capturing a growing share of global money. A falling ratio means the opposite — even if Bitcoin’s price in USD is rising, it is rising slower than global liquidity is expanding.
This distinction is critical. A rising BTC price in nominal USD terms is not the same as Bitcoin gaining against global liquidity. The ratio strips out the money-printing effect and measures liquidity-adjusted Bitcoin performance — arguably the most honest long-cycle lens available.
The Red Trendline — Three Cycles, Zero Exceptions
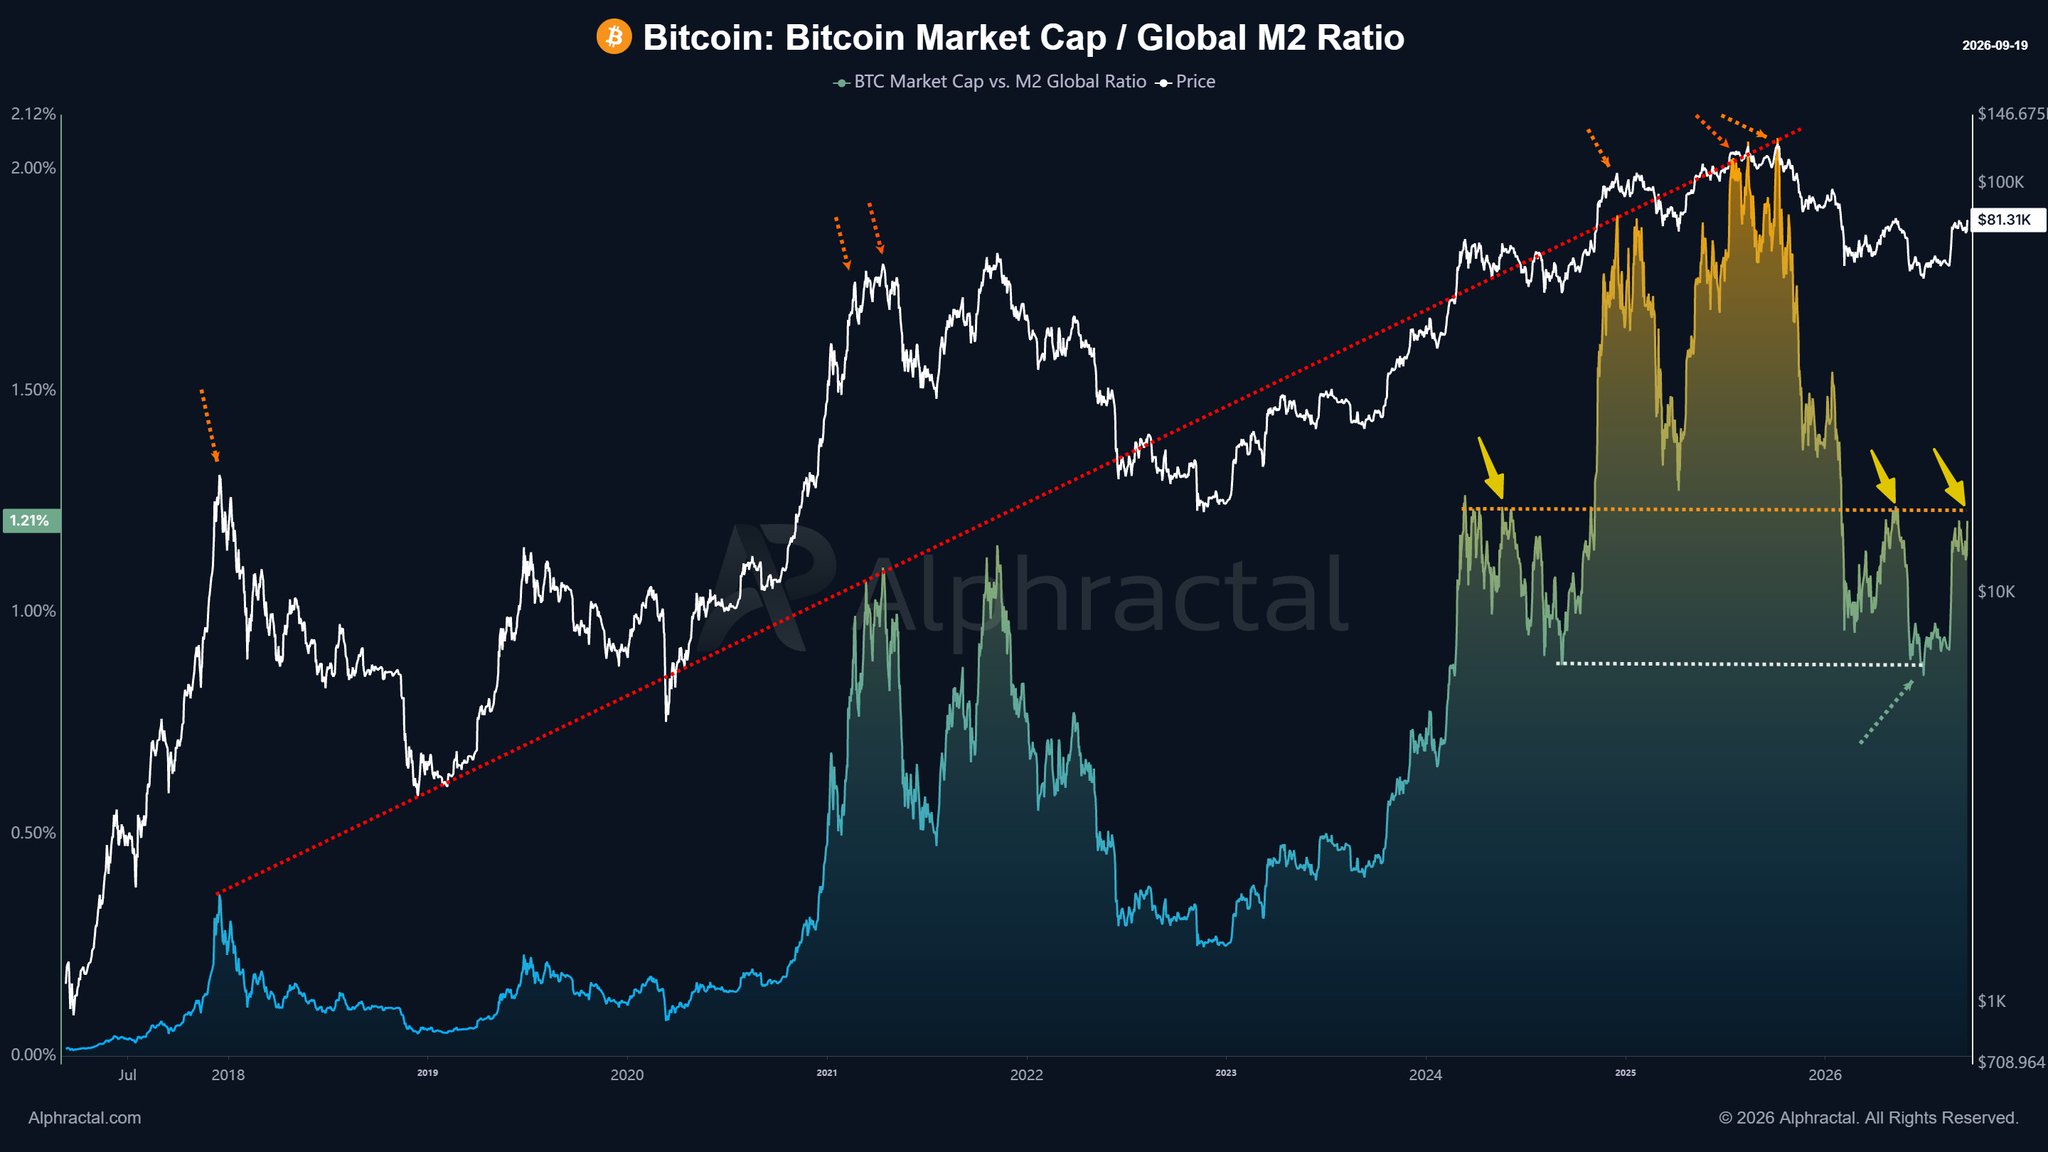
Alphractal’s chart covers Bitcoin’s full modern history from 2017 through 2026. Across that span, a single diagonal red trendline connects the euphoria peaks of every cycle. The pattern is consistent:
| Cycle | Ratio at Trendline Touch | Outcome |
|---|---|---|
| 2017 | ~2.00–2.12% | Major top confirmed — sharp mean reversion followed |
| 2021 | ~2.00–2.12% | Local top confirmed — multi-month correction followed |
| 2025 | ~2.00–2.12% | Resistance held — ratio now pulling back toward 1.21% |
Source: Alphractal (X)
In every instance, once the ratio touched the red diagonal trendline — representing peak euphoria — it failed to break and close above it. The ratio then mean-reverted sharply downward. The 2025 cycle has followed the same script: the ratio reached resistance at the red line and is now at 1.21%, pulling back toward deeper support.
The Chart — Three Key Levels to Understand
The Alphractal chart published September 20, 2026 identifies three structural levels on the ratio:
- ~2.00–2.12% — The red diagonal euphoria trendline. This is the zone Bitcoin’s ratio has touched and rejected in 2017, 2021, and 2025. No cycle has sustained a close above it.
- ~1.35% — The orange dotted horizontal line. This level previously acted as both support and resistance through multiple cycles. Yellow arrows on the chart mark failed retests of this level in prior corrections. Bulls need a recovery above 1.35% to signal renewed liquidity-adjusted strength.
- ~0.85% — The white dotted base support line. This represents the historical floor where Bitcoin’s ratio has found macro buyers in deep correction phases.
The current ratio reading of 1.21% sits below the orange 1.35% level and above the white 0.85% base support — placing Bitcoin in what Alphractal frames as post-peak correction territory. The orange arrows on the chart mark local tops where the ratio exceeded or touched the red line before reversing. The current setup mirrors that structure.
BTC Market Cap / Global M2 Ratio Chart — September 2026 | Source: @Alphractal (X)
What This Ratio Does and Doesn’t Say
Precision matters here. The Alphractal ratio is a macro liquidity-adjusted valuation lens — not a short-term price predictor.
What it says: Bitcoin’s market cap has lost ground relative to Global M2 since touching the red euphoria trendline in 2025. The ratio is at 1.21% — below the key 1.35% recovery threshold — confirming Bitcoin is currently in the corrective phase of the liquidity cycle, consistent with every prior post-euphoria period.
What it doesn’t say: It does not specify when the ratio bottoms, nor does it prescribe a precise BTC price target. A global M2 expansion could lift BTC’s nominal USD price while the ratio still declines — which would look bullish on a price chart but would be a deterioration in liquidity-adjusted terms.
What to watch for a recovery: A sustained ratio recovery above 1.35% — the orange dotted horizontal — would be the first signal that Bitcoin is re-gaining ground relative to global liquidity. That is the line Alphractal identifies as the bull/bear dividing level for this cycle’s next phase.
Why Global M2 Makes This Signal Structurally Different
Standard Bitcoin analysis — RSI, moving averages, funding rates — measures BTC against itself or USD. The M2 ratio is different because global liquidity is the primary variable determining risk asset valuations at the macro level. When M2 expands rapidly (quantitative easing, coordinated central bank stimulus), every risk asset rises in nominal terms. The ratio removes that noise.
This is why the pattern has repeated across three cycles with structural regularity: the red trendline is not arbitrary — it represents the ceiling of how large Bitcoin’s share of global liquidity can realistically grow during a single euphoric cycle before institutional and macro realities impose mean reversion. It is a reflexive limit built into the global financial system’s architecture, not a technical chart artifact.
For context on Bitcoin’s current on-chain positioning alongside this macro lens, the 14-indicator on-chain heatmap previously showed zero bear signals — a data point that, when read alongside the M2 ratio correction, suggests macro liquidity pressure rather than structural on-chain deterioration.
Bullish and Bearish Scenarios
Bullish Scenario — Ratio Recovery Above 1.35%
If Global M2 continues expanding and Bitcoin’s market cap recovers relative to liquidity, a sustained ratio close above 1.35% would end the post-euphoria corrective structure. In prior cycles, ratio recoveries above this orange level preceded the next leg of outperformance. A ratio recovery to the 1.55–1.75% zone would correspond to a significant BTC price appreciation in liquidity-adjusted terms.
Bearish Scenario — Ratio Breaks Below 0.85%
If the ratio continues declining through the 0.85% white dotted base support, it would signal a deeper liquidity-adjusted drawdown than prior mid-cycle corrections. At current Global M2 levels, a ratio of 0.85% would imply a materially lower Bitcoin market cap — representing meaningful downside from the current $1.613 trillion valuation. This scenario would be consistent with a macro liquidity contraction scenario, not simply a crypto-specific event.
Bottom Line
The Bitcoin Market Cap / Global M2 ratio has now completed the same three-act pattern for a third consecutive cycle: ratio rises to the red euphoria trendline near 2.00–2.12%, fails to break above it, and mean-reverts. The current reading of 1.21% confirms that 2025 followed the same script as 2017 and 2021 — no exceptions across nine years of data. Bitcoin at $80,308 is not in free fall, but the liquidity-adjusted picture is clear: the market cap is losing ground relative to Global M2, and recovery requires a sustained move back above the 1.35% orange horizontal level. Until that level is reclaimed, the ratio structure favors continued consolidation or correction. Watch the 1.35% ratio threshold — reclaiming it is the single most important confirmation that Bitcoin’s liquidity-adjusted bull case has resumed. Source: x.com
Frequently Asked Questions
What is the Bitcoin Market Cap to Global M2 ratio and why does it matter?
Has the Bitcoin M2 ratio ever broken above the red euphoria trendline?
What ratio level do bulls need to reclaim for Bitcoin’s macro picture to improve?
What happens to the Bitcoin ratio if Global M2 keeps expanding?
Source: Alphractal · Published by CoinsProbe Markets Desk
The opinions and market insights shared on CoinsProbe represent the views of individual authors based on prevailing market conditions at the time of publication. Cryptocurrency investments carry significant risk and volatility. Readers are encouraged to conduct their own research and seek professional financial advice before making investment decisions. CoinsProbe and its contributors do not accept responsibility for financial losses or decisions made based on published content.
CoinsProbe may publish sponsored articles, affiliate links, or promotional collaborations. All sponsored material is clearly labeled to maintain transparency with our audience. Our editorial decisions remain fully independent, and advertising partnerships do not influence reviews, rankings, or published opinions.
Since 2023, CoinsProbe has delivered reliable insights on cryptocurrency, blockchain, and digital assets. Our content is created by experienced researchers and analysts who follow strict editorial standards focused on accuracy, transparency, and credibility. Every article is carefully reviewed and verified using trusted sources and current market data. We provide unbiased analysis and timely updates covering everything from emerging crypto projects to major industry developments.