
The primary catalyst behind Bitcoin’s latest leg higher is a combination of macro tailwinds and a cascading short liquidation event — not a crypto-native announcement. On September 4, 2026, Fed Governor Waller’s optimistic remarks on cooling inflation lifted risk appetite across equity and crypto markets simultaneously, setting the stage for a sharp upside move in BTC.
Bitcoin climbed back above $80,000 and pushed toward $82,000 during the session, with the rally amplified by leveraged short positions getting forcibly closed out across the market.
Short Squeeze — $415M to $510M in Liquidations Drive the Move
The price surge did not happen in isolation. According to multiple reports covering September 4, 2026 market activity, somewhere between $415 million and $510 million in crypto liquidations occurred, with the majority of those coming from short positions. This short-side dominance in the liquidation data confirms the mechanism: as BTC rose, short sellers were forced to buy back their positions, adding further buying pressure and accelerating the move.
As covered in our earlier report on the $369.67M crypto selloff that hit BTC, ETH, SOL, and XRP, liquidation cascades in crypto tend to move in both directions — and the leverage that built up during that prior downturn appears to have been sitting in short positions that just got squeezed out.
Why Short Liquidations Directly Amplify BTC’s Price
When short positions are liquidated, exchanges automatically execute market buy orders to close those trades. More market buys → upward price pressure → additional shorts hit stop levels → further liquidations. This feedback loop is what separates a macro-driven rally from a simple drift higher.
Glassnode’s On-Chain Setup — Supply Bands Meet Leverage Clusters
On September 4, 2026, Glassnode flagged that on-chain supply levels and liquidation clusters were showing strong confluence. Specifically, cost-basis bands — the price levels at which cohorts of holders originally acquired their Bitcoin — are aligning with the exact price zones where leveraged short positions are concentrated.
Based on the data cited in research covering this setup, leveraged shorts appear clustered in the $81,800–$82,300 range, while on-chain supply and cost-basis resistance sits further up in the $83,000–$86,000 band. Glassnode’s full analysis of what to watch within this range is available in their September 4 newsletter.
This type of confluence — where on-chain holder behavior and derivatives leverage stack at the same price levels — creates conditions for outsized moves in either direction. For now, the move has been to the upside.
For additional context on how leveraged positions have unwound in recent sessions, see our coverage of James Wynn’s $147K BTC long liquidation after flipping from a short — a case study in how quickly leverage dynamics reverse.
Is the Rally Sustainable?
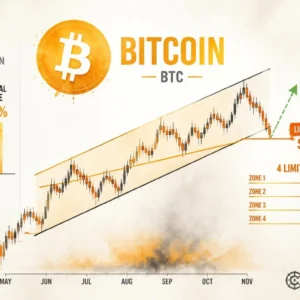
Sustainability here hinges on two specific variables. First, whether BTC can hold above the $81,800–$82,300 short cluster zone — a failure to hold that range would suggest the squeeze is exhausted and positioning has reset. Second, whether the macro backdrop holds: if Fed commentary shifts or equity markets reverse, the risk-on bid that initiated this move disappears with it.
The key zone to monitor on the upside is $83,000–$86,000, where Glassnode’s cost-basis resistance data indicates supply overhang. A clean break through that band with sustained volume would change the structure meaningfully. A rejection there would be consistent with the range playing out as expected. The metric to track daily: on-chain cost-basis distribution data from Glassnode and open interest figures across major derivatives venues.
The September 4, 2026 BTC rally is best explained by Fed Governor Waller’s inflation commentary igniting macro risk appetite, with $415 million to $510 million in short liquidations providing the mechanical fuel. Glassnode’s confluence of cost-basis bands and leverage clusters at $81,800–$83,000 gives this move a structured on-chain context. The specific metric to monitor going forward is whether BTC sustains above the short cluster zone or faces supply resistance in the $83,000–$86,000 band. Also notable: the DeFi sector showed parallel strength, as tracked in our September 1 report on CRV, UNI, and ARB surging across DeFi.
Why did Bitcoin surge on September 4, 2026?
The move was driven by two compounding factors: macro risk-on sentiment following Fed Governor Waller’s comments on cooling inflation, and a short liquidation cascade estimated between $415 million and $510 million, the majority from short positions.
What is the Glassnode cost-basis confluence?
Glassnode flagged that on-chain cost-basis bands — price levels where large cohorts acquired BTC — are aligning with the same zones where leveraged shorts are concentrated, specifically $81,800–$82,300 for leverage clusters and $83,000–$86,000 for supply resistance.
Is Bitcoin’s rally driven by fundamentals or leverage?
Based on available data, the immediate catalyst is leverage-driven — short covering amplified a macro-triggered move. There is no verified evidence of a new protocol upgrade, partnership, or regulatory event behind this specific September 4 rally.
What price zone should traders monitor next?
The $83,000–$86,000 range is where Glassnode’s on-chain supply and cost-basis resistance is concentrated. That band represents the next significant structural test for BTC after the short squeeze.
Source: Glassnode · Published by CoinsProbe Markets Desk
The opinions and market insights shared on CoinsProbe represent the views of individual authors based on prevailing market conditions at the time of publication. Cryptocurrency investments carry significant risk and volatility. Readers are encouraged to conduct their own research and seek professional financial advice before making investment decisions. CoinsProbe and its contributors do not accept responsibility for financial losses or decisions made based on published content.
CoinsProbe may publish sponsored articles, affiliate links, or promotional collaborations. All sponsored material is clearly labeled to maintain transparency with our audience. Our editorial decisions remain fully independent, and advertising partnerships do not influence reviews, rankings, or published opinions.
Since 2023, CoinsProbe has delivered reliable insights on cryptocurrency, blockchain, and digital assets. Our content is created by experienced researchers and analysts who follow strict editorial standards focused on accuracy, transparency, and credibility. Every article is carefully reviewed and verified using trusted sources and current market data. We provide unbiased analysis and timely updates covering everything from emerging crypto projects to major industry developments.