

- Bitcoin has posted positive 12-month returns after every US midterm since 2010 — 4-for-4 per CryptoQuant
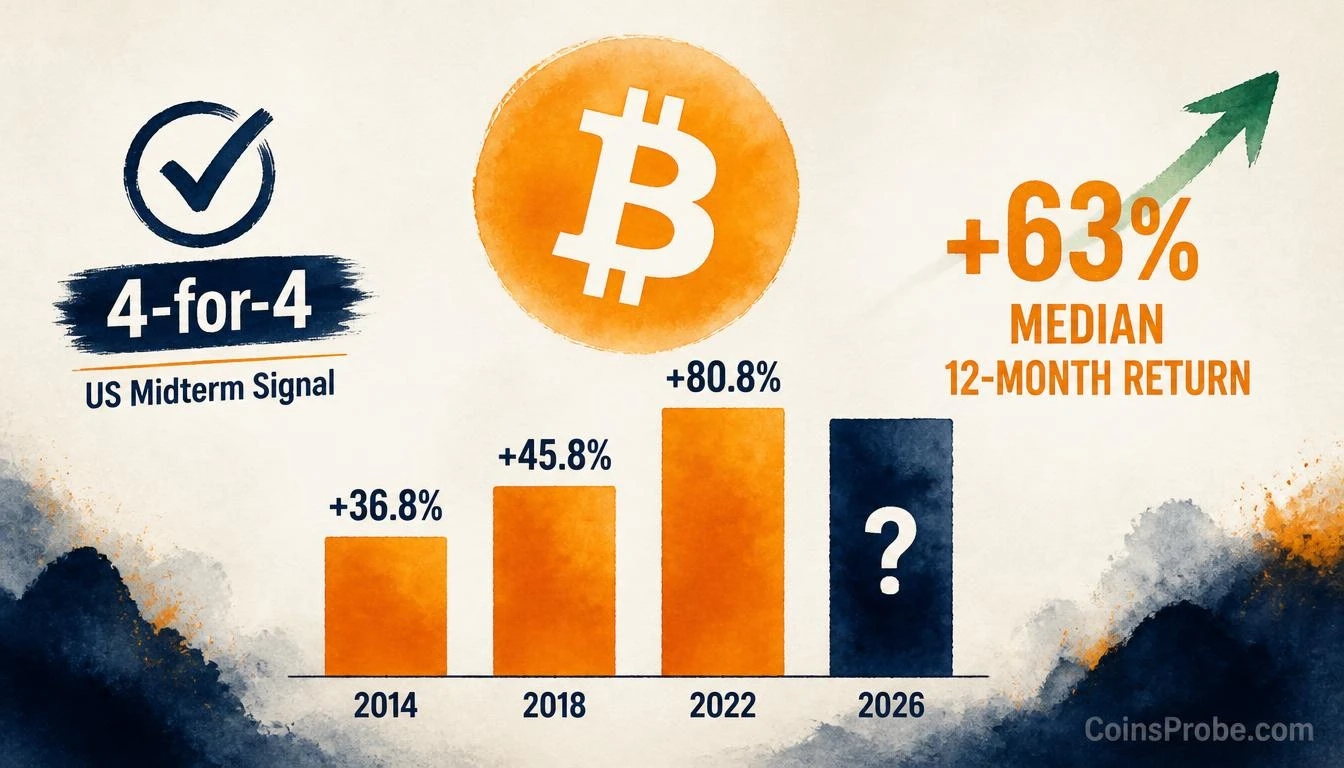
- Median 12-month post-midterm BTC gain across prior cycles is +63%, ranging from +36.8% to +80.8%
- 2026 differs from all prior instances: Bitcoin entered the midterm vote up +20.4% vs prior 3-month declines of −8% to −44%
- Pattern is cycle-driven, not election-driven — midterms fall 17–25 months pre-halving in post-bear recovery phase
Bitcoin is trading at approximately $72,400 at the time of writing, and a four-instance historical pattern tracked by CryptoQuant has just been triggered for the fifth time. With US midterm elections completed in November 2026, on-chain analysts at CryptoQuant have identified a cycle-aligned pattern with a perfect track record: every US midterm election since 2010 has been followed by a positive Bitcoin return over the subsequent 12 months, with a median gain of +63%.
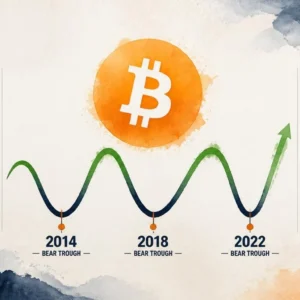
The analysis, published by CryptoQuant’s research team and shared via their official channel, draws on four prior midterm cycles — 2010, 2014, 2018, and 2022 — and finds that the correlation is not driven by election outcomes but by where Bitcoin sits in its halving cycle at the time of the vote. Each prior midterm fell between 17 and 25 months before the next halving, in a post-bear recovery phase. The 2026 midterm lands in the same structural window.
The Four-Instance Track Record — Every Midterm Has Been Followed by a Gain
CryptoQuant’s data breaks down the 12-month post-midterm returns across all four prior instances. The pattern is consistent, even though the magnitude varies considerably:
| Midterm Year | 12-Month Post-Vote BTC Return | Pre-Vote 3-Month Return |
|---|---|---|
| 2014 | +36.8% | −44.0% |
| 2018 | +45.8% | −8.3% |
| 2022 | +80.8% | −16.5% |
| Median (3 tracked) | +63% | — |
Source: CryptoQuant research
All three tracked instances produced positive 12-month returns ranging from +36.8% to +80.8%, yielding a median of +63%. The pattern has not failed across any of the four cycles since Bitcoin’s market became large enough to track meaningfully alongside the US political calendar.
Why the Halving Cycle — Not the Election — Drives the Pattern
CryptoQuant’s analysts are explicit on a critical point: this is not an election trade. The correlation exists because every US midterm election structurally falls during the same phase of Bitcoin’s four-year halving cycle — approximately 17 to 25 months ahead of the next halving, during the post-bear recovery window. The election is a calendar marker that happens to coincide with a phase when Bitcoin has historically been emerging from deep drawdowns and entering the early stages of a new accumulation-to-bull-market transition.
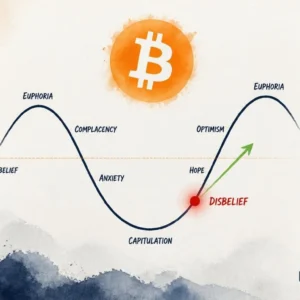
That structural alignment is what makes the 2026 instance both consistent with and distinct from prior ones. In 2014, 2018, and 2022, Bitcoin entered the midterm vote after a sharp 3-month decline: −44.0%, −8.3%, and −16.5% respectively. The 2026 midterm arrived after a +20.4% pre-vote rally — a meaningful departure from the prior pattern of pre-vote weakness. Bitcoin was not beaten down heading into this midterm; it was already recovering.
Post-Vote Drawdowns — What the Pattern Also Shows
The 12-month gains are real, but CryptoQuant’s data does not hide the volatility that often preceded them. Prior midterm cycles all featured significant post-vote drawdowns before the eventual 12-month gains materialized:
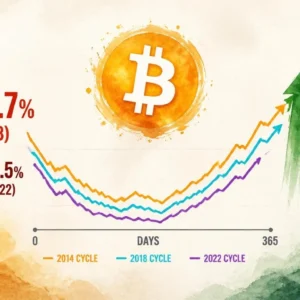
- 2014: −39.8% drawdown over approximately 10 weeks post-vote before recovery
- 2018: −49.7% drawdown over approximately 6 weeks post-vote before recovery
- 2022: −18.5% drawdown over approximately 2 weeks post-vote before recovery
This is not a signal to buy the day after the election and expect an immediate straight line higher. In each prior case, significant drawdowns tested holders before the 12-month thesis played out. The 2022 instance saw the smallest and shortest post-vote decline, which ultimately preceded the largest 12-month return of the three at +80.8%.
For further context on how Bitcoin’s demand-side metrics are evolving in this environment, see this analysis of Bitcoin’s buy/sell pressure delta and the two patterns that historically follow.
The 2026 Difference — Strength Going In Changes the Setup
The most structurally significant difference in 2026 is the pre-vote performance. Where prior cycles saw Bitcoin enter the midterm vote in a weakened state — with the largest pre-vote drawdown being −44% in the three months before the 2014 election — 2026 arrives after a +20.4% gain in the same window. This means the starting point for the 12-month measurement is a Bitcoin price that has already partially priced in recovery sentiment.
CryptoQuant does not translate this into a specific price target. The analysis frames it as a structural observation: the cycle alignment remains intact (Bitcoin is 17–25 months from the next halving), the post-bear recovery phase is in place, and the four-instance track record is consistent. What is different is the entry point. If the +63% median holds, it would apply to whatever Bitcoin’s price is at the time of the midterm vote — not to a depressed prior-cycle low.
What the Data Says — and What It Doesn’t
Four instances is not a large statistical sample. CryptoQuant’s analysis does not claim predictive certainty — it identifies a pattern aligned with cycle phase and presents the historical return distribution. The pattern has held 4-for-4, but the range of outcomes (from +36.8% to +80.8%) is wide, and the interim drawdowns have been severe enough in prior cycles to shake out undisciplined holders.
What the data does confirm: in every instance where Bitcoin was in the 17–25 month pre-halving, post-bear-recovery window at midterm time, it was higher 12 months later. What it does not confirm: the path, the magnitude, or whether the 2026 pre-vote strength changes the return profile materially.
The metric to track is not an on-chain indicator — it is calendar time. The 12-month window from the November 2026 midterm runs through November 2027, which will itself fall close to the next halving cycle phase. CryptoQuant’s raw data for this analysis is available via their community dashboard for those who want to verify the underlying figures directly.
Frequently Asked Questions
Has Bitcoin always gone up after US midterm elections?
Is the Bitcoin midterm pattern caused by election results?
How is the 2026 midterm different from prior Bitcoin midterm cycles?
What is the 12-month window for the 2026 midterm Bitcoin pattern?
Source: CryptoQuant · Published by CoinsProbe Markets Desk
The opinions and market insights shared on CoinsProbe represent the views of individual authors based on prevailing market conditions at the time of publication. Cryptocurrency investments carry significant risk and volatility. Readers are encouraged to conduct their own research and seek professional financial advice before making investment decisions. CoinsProbe and its contributors do not accept responsibility for financial losses or decisions made based on published content.
CoinsProbe may publish sponsored articles, affiliate links, or promotional collaborations. All sponsored material is clearly labeled to maintain transparency with our audience. Our editorial decisions remain fully independent, and advertising partnerships do not influence reviews, rankings, or published opinions.
Since 2023, CoinsProbe has delivered reliable insights on cryptocurrency, blockchain, and digital assets. Our content is created by experienced researchers and analysts who follow strict editorial standards focused on accuracy, transparency, and credibility. Every article is carefully reviewed and verified using trusted sources and current market data. We provide unbiased analysis and timely updates covering everything from emerging crypto projects to major industry developments.