
Bitcoin is trading at $85,920 — up 0.73% in the past 24 hours, with a market cap of $1.73 trillion — and it has already done something historically unusual: it survived October’s most reliably painful stretch without flinching. That is not a trivial observation. The first three days of October have been Bitcoin’s weakest three-day window of the entire month across multiple years of data, and 2026 has already broken that pattern.
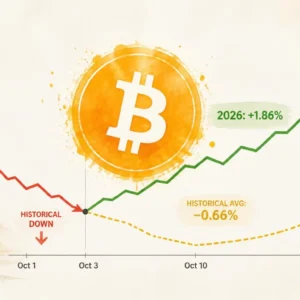
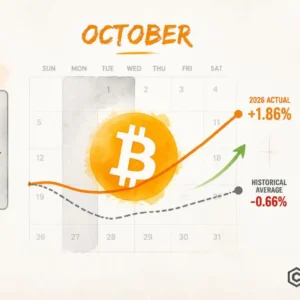
The note comes from analyst @coinjuicehq, published via CryptoQuant on October 5, 2026. The exact observation: “Bitcoin’s first three days of October have historically been its weakest three-day stretch of the month, averaging a 0.66% decline. 2026 has already held up better.” At the time of the note, Bitcoin was tracking at +1.86% — a 2.52 percentage point outperformance versus the historical average for the same window.
The October Seasonal Pattern — And Why 2026 Is Different
Seasonal analysis of Bitcoin returns is not astrology. It is a documented behavioral pattern across a decade of price history, reflecting real forces: tax-loss selling pressure from Q3 closes, institutional rebalancing at quarter-end, and historically reduced spot demand in the first days of Q4. The result is a consistent drag in the October 1–3 window that has averaged a −0.66% cumulative return across prior years.
The chart shared by @coinjuicehq via CryptoQuant plots Bitcoin’s daily performance from September 30 through October 31, overlaying the 2026 live path (green, solid) against the multi-year historical average (gold, dashed). The historical average line dips visibly below zero in the first three days before recovering and climbing steadily toward a month-end average of +13.37%. The 2026 line, by contrast, holds above the zero baseline after an initial modest dip — printing +1.86% against the historical −0.66% at the same point in the month.
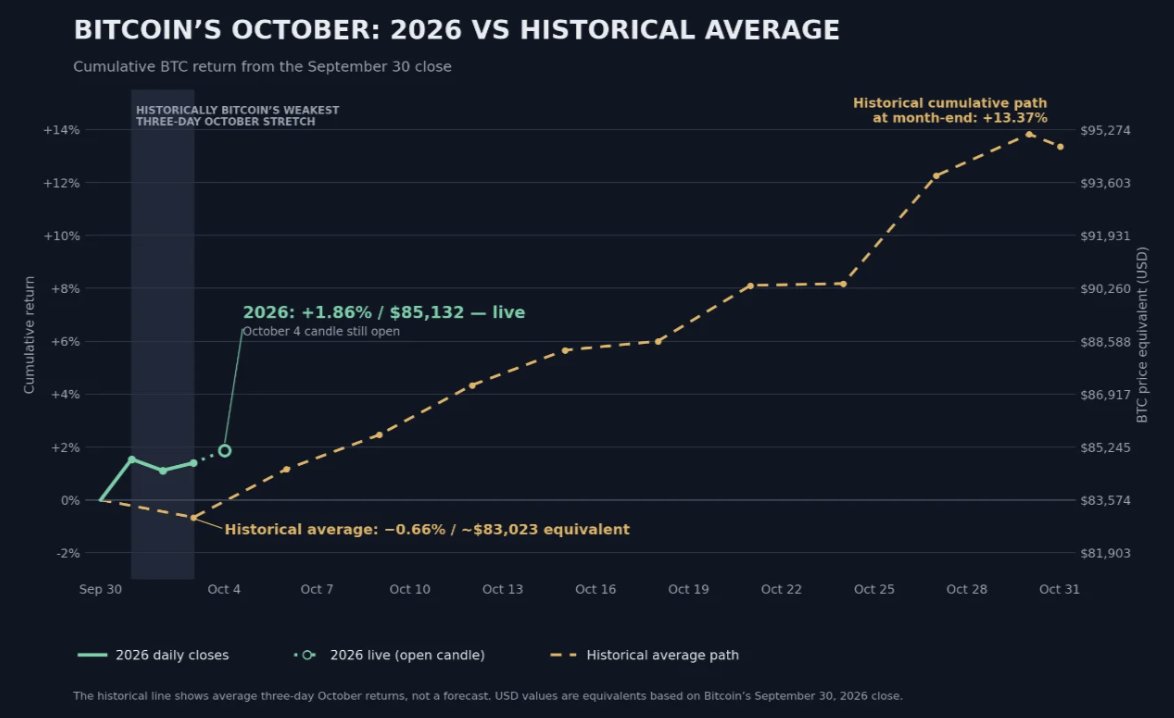
The chart’s percentage axis runs from −2% to +14%, with labeled price equivalents ranging from $81,903 to $95,274 at the current scale. The live annotation reads: “2026: +1.86% / $85,132 — live”, alongside the historical reference: “Historical average: −0.66% / ~$83,023 equivalent.” The historical cumulative path at month-end prints at +13.37%. These are confirmed printed values on the chart — not projections.
Power Law Model: CryptoQuant Quicktake Places Bitcoin at $157K Fair Value
Separately, a CryptoQuant Quicktake published on October 4, 2026 by analyst AxelAdlerJr examines Bitcoin’s position relative to the Power Law model — a long-term valuation framework that has tracked Bitcoin’s price trajectory across more than a decade. The note’s headline conclusion: Bitcoin at $157K is what the Power Law calculation currently shows as the model’s fair value estimate.
The Quicktake documents a specific structural trend within the Power Law oscillator: peaks have become progressively less extreme over time. The oscillator peaked at +169 in 2018. By 2025, that peak had compressed to +102. The standard deviation of Bitcoin’s daily deviations around the Power Law line has also narrowed over time — a sign that Bitcoin’s price behavior is becoming more anchored to the model’s long-run trajectory rather than exhibiting the wild deviations of earlier cycles. This is the structural context behind the $157K figure: it represents where the Power Law trend line currently sits, not a speculative price target derived from momentum or sentiment.
It is important to be precise about what the Power Law model is and is not. It is a regression-based valuation model fit to Bitcoin’s historical price data on a logarithmic scale, producing a “fair value” line that rises over time at a mathematically consistent rate. The oscillator measures how far above or below that line Bitcoin is trading on any given day. A reading of +169 in 2018 meant Bitcoin was dramatically extended above fair value. A compressed peak of +102 in 2025 suggests progressively more rational pricing cycles — but it does not mean corrections are impossible or that Bitcoin will reach $157K on any specific timeline.
Two Signals — One Directional Read
Taken together, the two data points from CryptoQuant’s October 4–5 notes create a coherent picture: Bitcoin is holding seasonal support where it historically hasn’t, while a long-run valuation model places fair value significantly above current price. The seasonal outperformance confirms near-term demand resilience. The Power Law context provides the structural valuation backdrop.
As previously covered in our analysis of Bitcoin holding through October’s weakest three days, the +1.86% reading at the three-day mark is a live, updating data point — not a final verdict on the month. The historical average path ultimately climbs to +13.37% by month-end, but individual years show significant variance around that mean. October’s seasonal tailwind, when it materializes, has historically been substantial. Whether 2026 tracks that average will be determined by price action across the remaining 28 days of the month.
For context on Bitcoin’s broader demand picture, our earlier analysis on the Bitcoin whale sell-off at $87K and the $82,500 level remains relevant: structural demand from larger participants is the mechanism that would need to hold for the seasonal pattern to play out.
Bullish Scenario
If Bitcoin sustains above the $85,132 level — the live anchor point noted in the CryptoQuant chart — and continues tracking above the historical average path, the month-end historical average of +13.37% would project a target in the $95,000–$97,000 range from the September 30 base. The Power Law model at $157K represents the longer-duration fair value estimate from AxelAdlerJr’s framework, contingent on Bitcoin’s multi-year trajectory continuing to compress toward the model line rather than extending far above it as in prior cycles.
Bearish Scenario
A failure to hold the current +1.86% cushion and a reversion toward the historical −0.66% average — implying a pullback toward the $83,023 equivalent noted on the chart — would remove the seasonal outperformance thesis. The $81,903 level represents the lower bound of the chart’s displayed price range and would constitute a meaningful break below recent structure.
Bitcoin is tracking at $85,920. The seasonal data says the hardest three days of October are already behind it. The Power Law model says fair value is $157K. Neither guarantees direction — but both point the same way. Watch $85,132 as the live anchor: a sustained hold above that level keeps the historical month-end average of +13.37% in play.
Source: x.comFrequently Asked Questions
What does Bitcoin’s +1.86% October performance mean historically?
What is the Power Law model’s current Bitcoin fair value and who calculated it?
What is the historical Bitcoin October month-end average return?
What price level must Bitcoin hold to keep the October seasonal thesis intact?
Source: CryptoQuant · Published by CoinsProbe Markets Desk
The opinions and market insights shared on CoinsProbe represent the views of individual authors based on prevailing market conditions at the time of publication. Cryptocurrency investments carry significant risk and volatility. Readers are encouraged to conduct their own research and seek professional financial advice before making investment decisions. CoinsProbe and its contributors do not accept responsibility for financial losses or decisions made based on published content.
CoinsProbe may publish sponsored articles, affiliate links, or promotional collaborations. All sponsored material is clearly labeled to maintain transparency with our audience. Our editorial decisions remain fully independent, and advertising partnerships do not influence reviews, rankings, or published opinions.
Since 2023, CoinsProbe has delivered reliable insights on cryptocurrency, blockchain, and digital assets. Our content is created by experienced researchers and analysts who follow strict editorial standards focused on accuracy, transparency, and credibility. Every article is carefully reviewed and verified using trusted sources and current market data. We provide unbiased analysis and timely updates covering everything from emerging crypto projects to major industry developments.