
Bitcoin is trading at $85,855 — up 0.75% in the last 24 hours, with a market capitalization of $1.725 trillion. That headline number matters less than what just happened underneath it: Bitcoin cleared its historically weakest three-day window of the entire month of October without the typical damage.
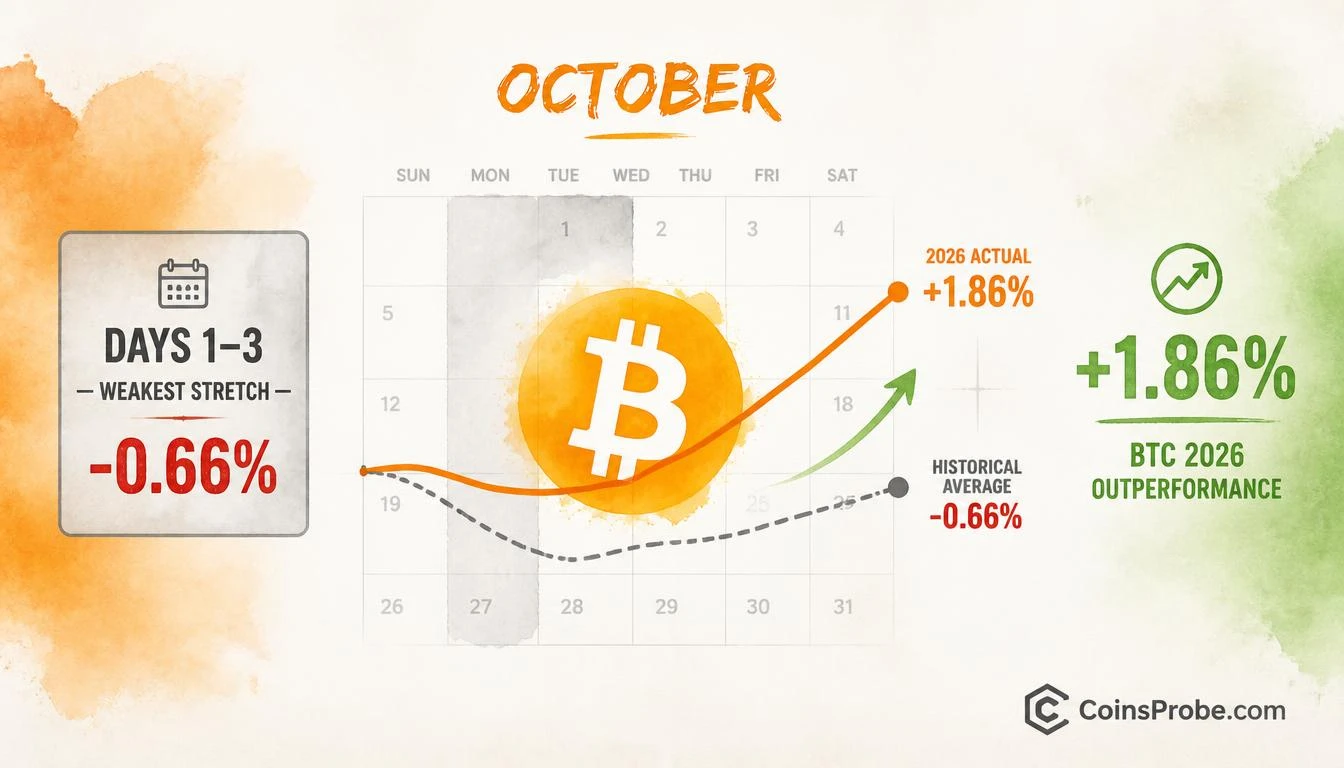
The observation comes from analyst @coinjuicehq, published via CryptoQuant’s official channel on October 5, 2026. The analyst’s exact words: “Bitcoin’s first three days of October have historically been its weakest three-day stretch of the month, averaging a 0.66% decline. 2026 has already held up better.” That is not a marginal beat — it is a sign reversal. History averages red; this year printed green.
The Historical Baseline — Days 1–3 Are October’s Weakest
The seasonality pattern is explicit in the chart shared by @coinjuicehq via CryptoQuant. The first three calendar days of October — shaded in gray on the chart — represent the single weakest consecutive three-day stretch across the entire month. The long-run daily average for that window is -0.66%. By the time October reaches its historical month-end average, Bitcoin has typically recovered to deliver a +13.37% full-month return — but that recovery comes after absorbing early-month selling pressure, not by avoiding it.
The chart plots two lines against October’s daily return sequence: a dashed line representing the historical average path from September 30 through October 31, and a solid line tracking 2026’s actual daily closes. The historical path dips marginally in the first three days, then rises steadily toward month-end. The 2026 line starts flat, dips only marginally, then crosses above the historical average by October 4.
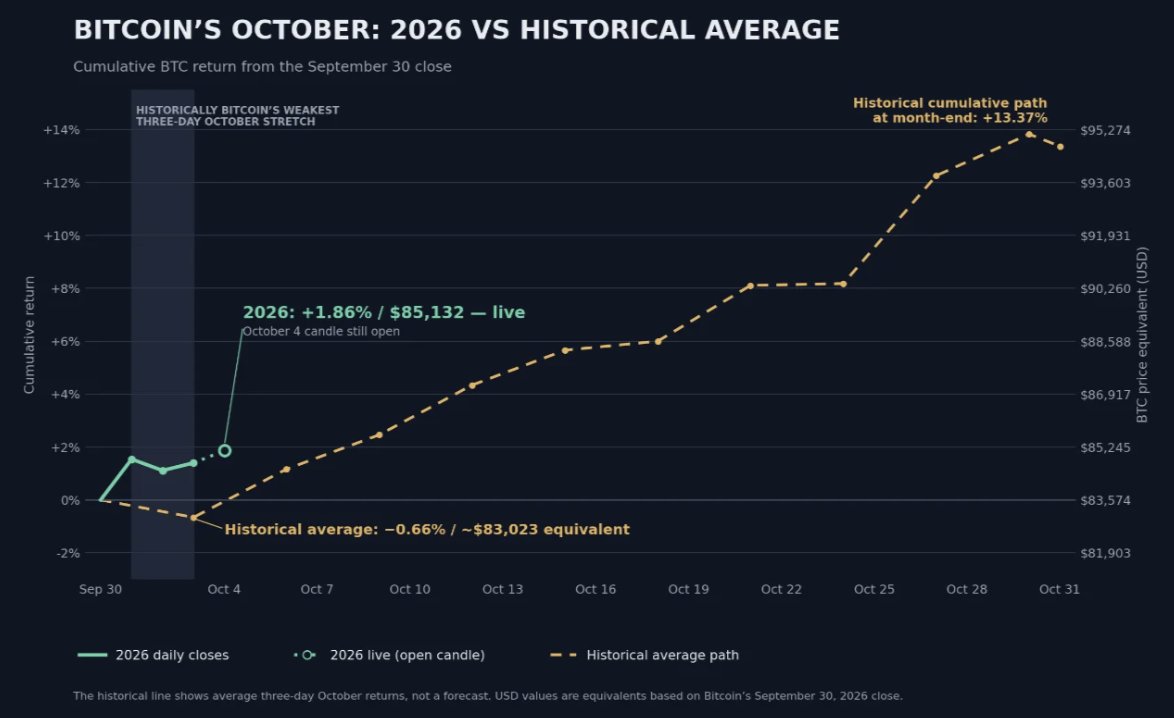
The specific figures printed on the chart tell the complete story. The historical equivalent price level entering October is approximately $83,023. The 2026 live reading is $85,132 — already above that baseline. Against a historical three-day average of -0.66%, Bitcoin’s 2026 reading for the same window is +1.86%. That is a 252-basis-point outperformance during the precise window that historically generates the most selling pressure of the month.
What the Power Law Adds to This Picture
A separate CryptoQuant Quicktake published October 4, 2026, by analyst AxelAdlerJr, places the current price in a longer structural context. The note, titled “Bitcoin at $157K: what the Power Law calculation shows,” documents that over the past ten years, Bitcoin’s oscillations around the Power Law trend line have become progressively less pronounced — with oscillator peaks declining from +169 in 2018 to +102 in 2025. The standard deviation of daily deviations has compressed across successive cycles. This is a separate, independent signal: the market is maturing, with decreasing amplitude in its boom-bust swings even as directional trend remains intact.
The Power Law analysis does not provide a near-term price target for October, but it frames the seasonality data above within a structural context — Bitcoin does not need a violent October surge to remain on cycle trajectory. A controlled, above-average early-October performance is entirely consistent with the dampened oscillator pattern AxelAdlerJr documents.
What the Outperformance Does — and Does Not — Confirm
The seasonality beat confirms one specific thing: Bitcoin absorbed the calendar window that most reliably produces selling pressure without printing the expected loss. It does not confirm that the +13.37% historical month-end average will be realized in 2026. That figure is printed on the chart as a long-run past average reference — not a forward projection for this year’s October close.
What it does establish is a relative strength reading. The historical October path begins at approximately $83,023 and ends at $95,274 on the right-axis scale — a reference range reflecting historical distribution, not a guaranteed trajectory. Bitcoin entering October at $85,132 and holding above that level through the weakest three days represents structural resilience, not a confirmed breakout. The distinction matters. As we’ve covered previously, Bitcoin’s hold through this specific window is the primary data point — everything else is context.
Traders watching the demand side should note that U.S. spot buyers have remained largely absent from this recovery, and whale activity at elevated levels has introduced its own complexity — as documented in our earlier analysis of whale sell-offs near $87K.
Bullish Scenario
If Bitcoin sustains above the $85,132 level — the 2026 early-October anchor — and the historical October path holds directional validity, the month-end reference zone on the chart sits between $93,603 and $95,274 based on the right-axis scale printed by @coinjuicehq. Continuation of the current outperformance versus historical average would support that range as a plausible destination, not a guaranteed one.
Bearish Scenario
A reversal below the $83,023 historical equivalent — which would close the gap Bitcoin has opened versus its seasonal baseline — would eliminate the outperformance thesis and suggest the delayed weakness arrived later in October rather than being avoided. That would realign Bitcoin with or below the historical average path.
The single most precise signal from @coinjuicehq’s analysis is also the simplest: October’s worst three days arrived, delivered -0.66% on average throughout history, and Bitcoin instead printed +1.86% in 2026. Whether that 252-basis-point seasonal edge translates into sustained October strength will be determined at the $83,023 level — a break below it erases the signal; a hold above it keeps the historical comparison intact. Watch $85,132 as the immediate anchor and $83,023 as the level that would return Bitcoin to historical average territory.
Frequently Asked Questions
Why are October’s first three days historically Bitcoin’s weakest?
Does Bitcoin’s +1.86% early-October gain guarantee a strong monthly close?
What level would invalidate the seasonal outperformance thesis?
What is the Power Law oscillator and why has it compressed?
Source: CryptoQuant · Published by CoinsProbe Markets Desk
The opinions and market insights shared on CoinsProbe represent the views of individual authors based on prevailing market conditions at the time of publication. Cryptocurrency investments carry significant risk and volatility. Readers are encouraged to conduct their own research and seek professional financial advice before making investment decisions. CoinsProbe and its contributors do not accept responsibility for financial losses or decisions made based on published content.
CoinsProbe may publish sponsored articles, affiliate links, or promotional collaborations. All sponsored material is clearly labeled to maintain transparency with our audience. Our editorial decisions remain fully independent, and advertising partnerships do not influence reviews, rankings, or published opinions.
Since 2023, CoinsProbe has delivered reliable insights on cryptocurrency, blockchain, and digital assets. Our content is created by experienced researchers and analysts who follow strict editorial standards focused on accuracy, transparency, and credibility. Every article is carefully reviewed and verified using trusted sources and current market data. We provide unbiased analysis and timely updates covering everything from emerging crypto projects to major industry developments.