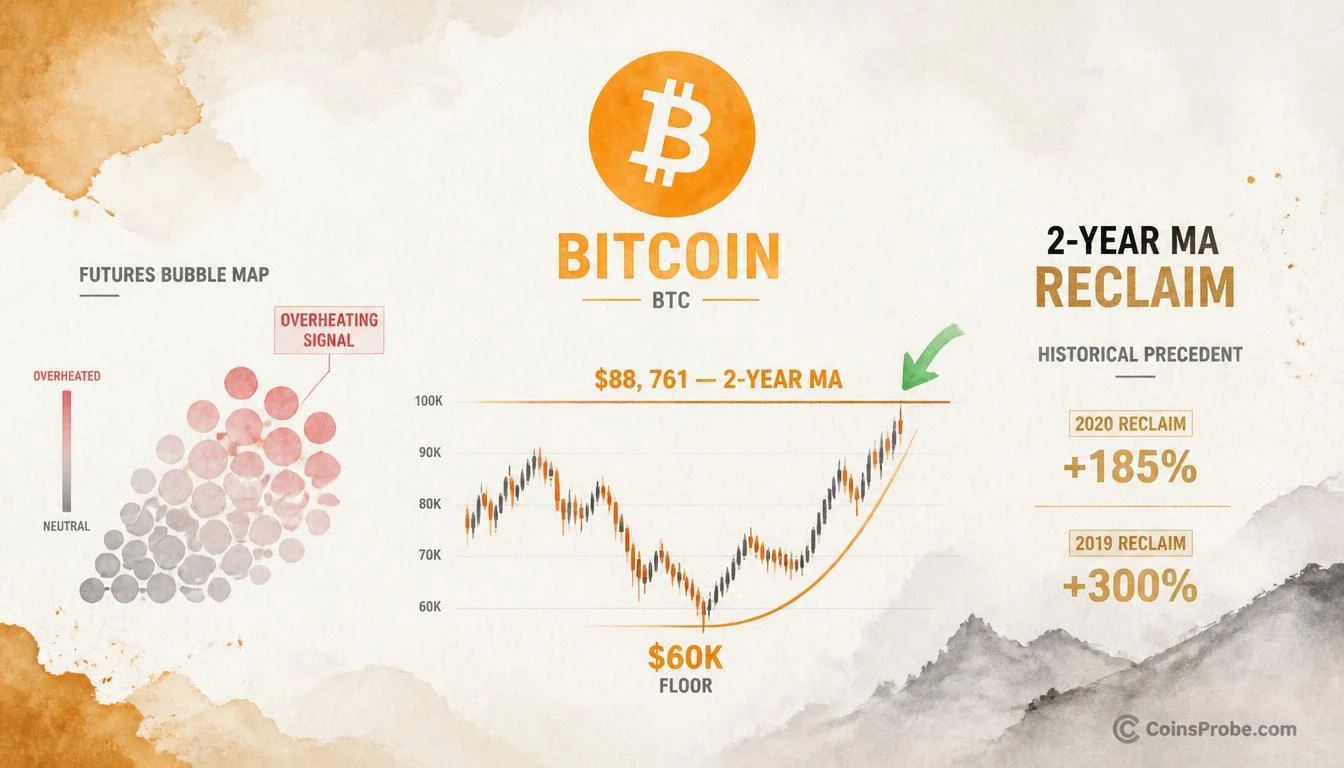
- Bitcoin trades at $86,006 (+6.05% 24h) — up ~33% from the July 2026 cycle low near $60,000
- CryptoQuant analyst @nino_trade flags $88,761 two-year MA as the decisive bull/bear threshold
- Futures bubble map shows neutral-to-pink overheating dots at $80K — premature speculation risk
- Rejection at $88,761 risks flush to $70,000–$75,000; confirmed close above opens path to $95K–$100K
Bitcoin is trading at $86,006 — up 6.05% in the past 24 hours — with a market cap of $1.727 trillion, having recovered approximately 33% from its July 2026 cycle low near $60,000. The move through $80,000 is not incidental. It positions Bitcoin directly beneath one of the most structurally significant price levels of this cycle: the 2-year moving average at $88,761 — a threshold that historically separates sustained bull regimes from prolonged bear conditions.
The setup was identified by CryptoQuant analyst @nino_trade, publishing via the @cryptoquant_com research channel. In their exact words: “If this upward momentum continues and Bitcoin breaks through the critical 2-year MA resistance level at $88,761, it could trigger a highly robust and sustained bullish trend.”
That is not a hedged observation — it is a declarative conclusion about a specific, named price level from a named analyst on a named platform.
The 2-Year Moving Average — What It Measures and Why $88,761 Is the Line
The 2-year moving average (approximately the 730-day SMA) tracks Bitcoin’s average closing price across the prior two years of trading. Unlike short-term EMAs used for momentum entries, the 2-year MA aggregates the full arc of a market cycle — incorporating the prior bull peak, the bear correction, and the accumulation floor — into a single evolving price point. When Bitcoin trades above it, the multi-year average of buyers is in profit, reducing structural sell pressure. When Bitcoin trades below it, the average buyer across two years is underwater — a condition historically associated with capitulation phases, not new bull markets.
At the time of writing, Bitcoin at $86,006 sits 3.1% below the 2-year MA at $88,761. That gap is narrow — but it is not yet crossed. The difference between $86,006 and $88,761 is the difference between a recovery and a regime change.
The Futures Volume Bubble Map — What the Chart Actually Shows
The chart published by @cryptoquant_com displays a Bitcoin futures volume bubble map spanning October 2025 through September 2026. The bubble color system encodes market temperature: green indicates healthy consolidation with reduced speculative excess; gray reflects balanced, neutral conditions; pink and red signal overheating and dangerous speculation peaks. The October 2025 peak near $120,000 was accompanied by heavily overheated red readings — the textbook speculative blowoff.
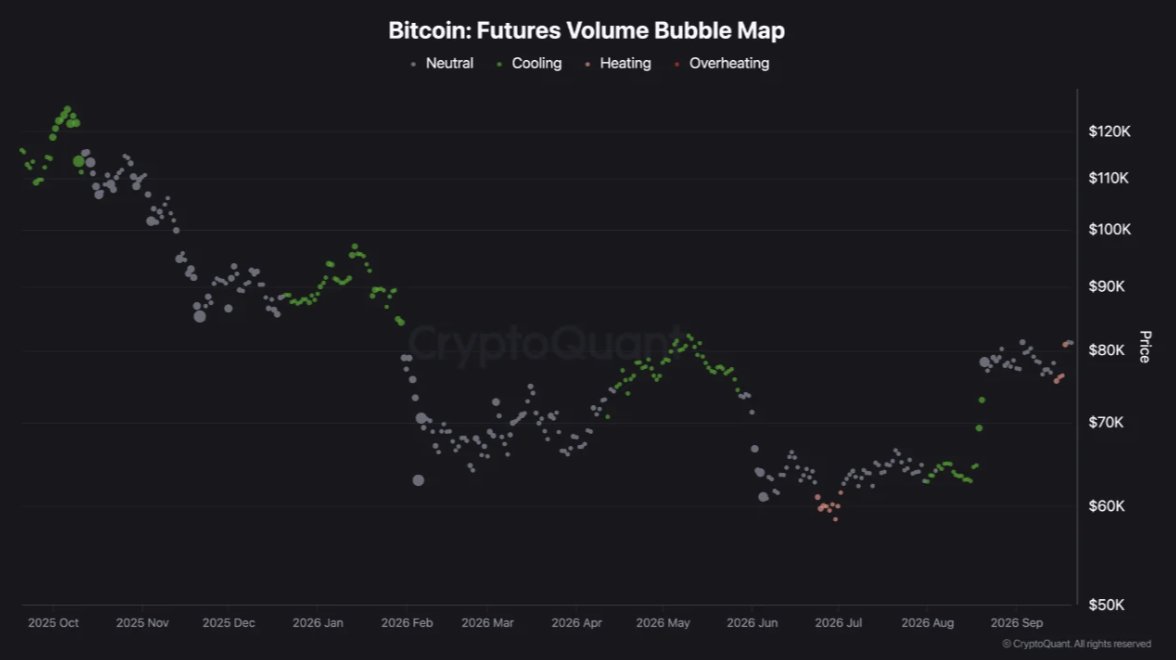
The July 2026 cycle low near $60,000 registered as cooling green — characteristic of a capitulation floor where excess has been flushed. What makes the September 2026 data significant — and what demands attention — is that the current bubbles near $80,000–$86,000 are registering as neutral-to-pink. Speculative activity is increasing before Bitcoin has cleared resistance. That divergence — rising speculation without a confirmed breakout — is the chart’s primary warning signal. [CHART_HERE]
Why Pink Dots Below Resistance Is a Risk Signal, Not a Confirmation
When futures volume bubble maps show overheating coloration before a resistance level is broken, it typically indicates that traders are positioning for a breakout that has not yet been confirmed by price. This is structurally different from overheating that occurs after a breakout — which reflects genuine momentum expansion. The current pink readings near $80,000–$86,000 suggest that speculative positioning is running ahead of the actual technical event. If Bitcoin fails to close above $88,761 in the sessions ahead, this premature speculation becomes the fuel for a mean-reversion flush toward the $70,000–$75,000 zone — the level @nino_trade identifies as the rejection target should the 2-year MA hold as resistance.
This dynamic is what separates the current setup from a simple breakout trade. Bitcoin is not coiling below a minor technical level. It is approaching a threshold that, on a sustained closing basis, would represent the first confirmed multi-year average reclaim since the bear phase began. Readers tracking Bitcoin’s broader structure may also find relevant context in Bitcoin’s earlier reclaim of the 50-week MA — the first close above that level since November 2025.
Historical Context — What Happens When Bitcoin Reclaims the 2-Year MA
The 2-year MA has functioned as the macro bull/bear dividing line across multiple Bitcoin cycles. In the 2018–2019 bear market, Bitcoin’s sustained reclaim of the 2-year MA in April 2019 preceded an approximate +185% rally from the reclaim level to the 2020 peak. In the 2022 bear market, Bitcoin spent over 12 months trading below the 2-year MA before reclaiming it in early 2023 — which preceded a +300% move to the November 2024 cycle high.
The pattern is not a guarantee — it is a documented structural relationship between Bitcoin’s macro regime and this specific multi-year average. A sustained close above $88,761 would place Bitcoin back into the regime where every prior instance preceded a significant continuation phase.
| Cycle | 2-Year MA Reclaim Level | Subsequent Rally |
|---|---|---|
| 2019 Recovery | ~$5,200 | +185% to 2020 high |
| 2023 Recovery | ~$25,000 | +300% to Nov 2024 high |
| 2026 Attempt | $88,761 (pending) | Not yet confirmed |
Source: CryptoQuant / @nino_trade (X)
The $3.1% Gap — What Needs to Happen and What to Watch
Bitcoin needs a sustained closing move above $88,761 to confirm the regime transition @nino_trade describes. Intraday wicks above that level will not suffice — what matters is a daily or weekly closing price that holds the 2-year MA as support rather than resistance. The metric to track is not the intraday high but the daily close relative to $88,761. At current price ($86,006), the gap is $2,755 — roughly 3.2%. Given the $55.1 billion in 24-hour trading volume, that distance can close within a single session. But the futures bubble map’s pink overheating dots mean the probability of a clean, low-volatility break is lower than the raw price proximity suggests. For additional context on how on-chain accumulation supports broader altcoin recovery into this environment, see XRP Whales Accumulate $2B — URPD Shows Clear Path to $2.29.
Bullish Scenario — Confirmed Close Above $88,761
A sustained daily close above $88,761 — held for a minimum of two to three sessions — would confirm the 2-year MA reclaim. Based on prior cycle precedents (2019: +185%, 2023: +300%), a confirmed reclaim opens the next structural target zone toward the $95,000–$100,000 range as the first measured move. A secondary target, if momentum expands, returns to the October 2025 cycle high near $120,000.
Bearish Scenario — Rejection at $88,761
Failure to close above $88,761 — particularly with the current pink bubble overheating reading — risks a corrective flush toward $70,000–$75,000, the level @nino_trade identifies as the primary support zone on rejection. A move back below $80,000 would erase the recent breakout entirely and reestablish the 2-year MA as overhead resistance for another consolidation leg.
Bottom Line
Bitcoin has recovered 33% from its July 2026 cycle low at $60,000, crossing $80,000 and now trading at $86,006 — just 3.2% below the 2-year moving average at $88,761. CryptoQuant analyst @nino_trade identifies this level as the line between a continuation of the bear regime and the trigger for what they describe as a “highly robust and sustained bullish trend.” The futures volume bubble map complicates the picture: neutral-to-pink overheating dots below the resistance level signal premature speculative positioning, not confirmed momentum.
Historically, sustained reclaims of the 2-year MA have preceded +185% and +300% rallies in prior cycles. Whether 2026 produces a third instance will be answered by the daily close at $88,761 — that exact price is the line every serious Bitcoin participant is watching right now.
Frequently Asked Questions
What is the 2-year moving average and why does $88,761 matter for Bitcoin?
What does the CryptoQuant futures bubble map signal for Bitcoin right now?
How far is Bitcoin from the 2-year MA at $88,761?
What happens if Bitcoin fails to break $88,761?
Source: CryptoQuant · Published by CoinsProbe Markets Desk
The opinions and market insights shared on CoinsProbe represent the views of individual authors based on prevailing market conditions at the time of publication. Cryptocurrency investments carry significant risk and volatility. Readers are encouraged to conduct their own research and seek professional financial advice before making investment decisions. CoinsProbe and its contributors do not accept responsibility for financial losses or decisions made based on published content.
CoinsProbe may publish sponsored articles, affiliate links, or promotional collaborations. All sponsored material is clearly labeled to maintain transparency with our audience. Our editorial decisions remain fully independent, and advertising partnerships do not influence reviews, rankings, or published opinions.
Since 2023, CoinsProbe has delivered reliable insights on cryptocurrency, blockchain, and digital assets. Our content is created by experienced researchers and analysts who follow strict editorial standards focused on accuracy, transparency, and credibility. Every article is carefully reviewed and verified using trusted sources and current market data. We provide unbiased analysis and timely updates covering everything from emerging crypto projects to major industry developments.