
- Bitcoin is trading at $77,389 — up +0.86% in 24 hours — but down -11.57% year-to-date with a market cap of approximately $1.55 trillion.
- CryptoQuant has flagged that Bitcoin's apparent demand has dropped to its most bearish level of the entire year — with the 30-day demand sum showing the deepest negative reading of 2026.
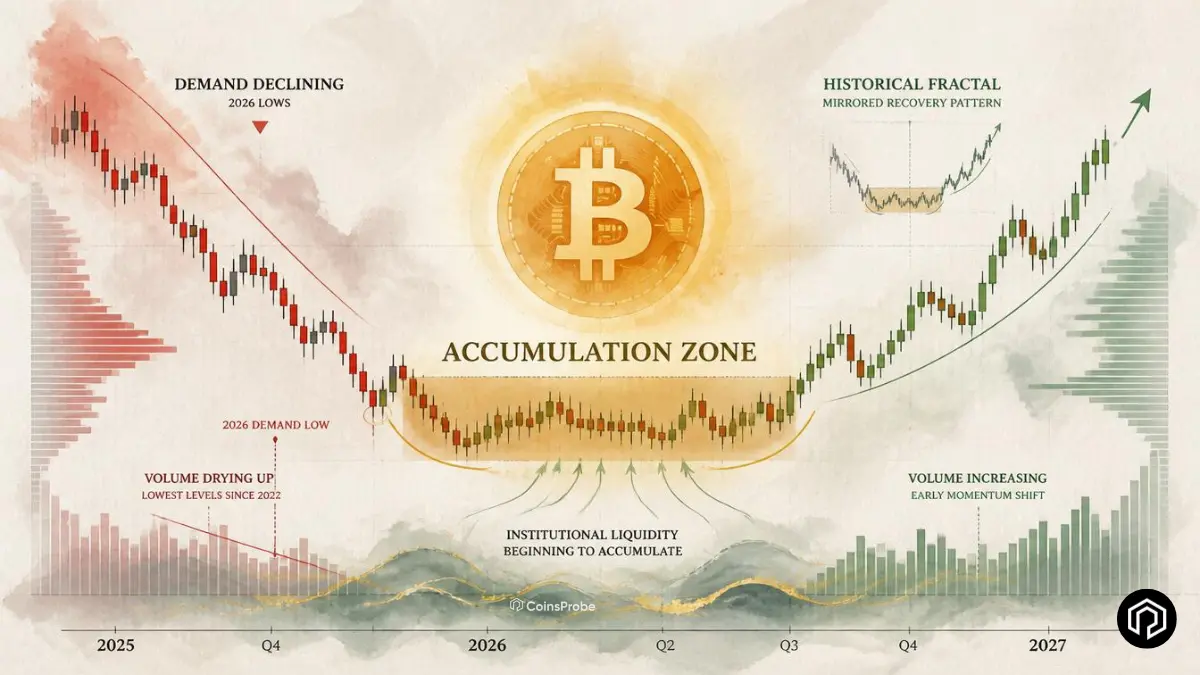
- Analyst has published a side-by-side fractal comparison showing the current 2026 market structure is mirroring the 2022/2023 bottom — where identical bearish narratives and disbelief preceded one of Bitcoin's most explosive rallies.
- The historical pattern: massive bearish catalysts fail to produce new lows — and the disbelief phase that follows has consistently marked the highest-conviction accumulation zone of the cycle.
Bitcoin is sending two contradictory signals simultaneously — and how you read them depends entirely on your time horizon. In the short term, on-chain demand has hit its most bearish level of 2026. In the medium term, the price refuses to break lower despite every macro catalyst that should have sent it there. And the fractal comparison between 2022/2023 and 2026 suggests that this exact combination — bearish demand metrics meeting price resilience — is precisely the setup that preceded Bitcoin’s last major cycle recovery.
As we covered in our Bitcoin critical juncture analysis and our Is Bitcoin Heading to $100K by July article, the structural picture for BTC has been defined by a consistent pattern since the February $60,061 low: bearish catalysts arrive, price dips, and higher lows form instead of new lows. The question is whether that pattern continues — and the fractal says it has done exactly this before.
Bitcoin Price at a Glance — May 25, 2026

The -11.57% year-to-date figure captures the full weight of 2026’s correction from the $126,208 all-time high — but it also reflects the recovery that has taken place from the $60,061 February low. BTC sitting at $77,389 means it has recovered approximately +29% from the cycle low while the broader narrative remains cautious — a dynamic that is characteristic of the disbelief phase visible in the fractal comparison below.
On-Chain Signal — Demand at the Most Bearish Level of 2026
The most significant data point in this week’s Bitcoin picture comes from CryptoQuant via contributor @Darkfost_Coc — who flagged on May 25 that Bitcoin’s apparent demand has dropped to its most bearish reading of the entire year.
The apparent demand metric tracks the net flow of Bitcoin into accumulation versus distribution zones — adjusted for block subsidies and inactive supply — and its 30-day sum provides a smoothed picture of whether demand is genuinely growing or contracting over time.
The current reading is unambiguous: the green bars representing positive demand that characterised earlier parts of 2026 have given way to persistent and deepening red bars — with the latest reading marking the lowest demand level observed in 2026 so far.
The important context @Darkfost_Coc provided alongside the data:
“Even if this situation appears relatively bearish in the short term, these types of environments have historically also created interesting opportunities for long-term investors.”
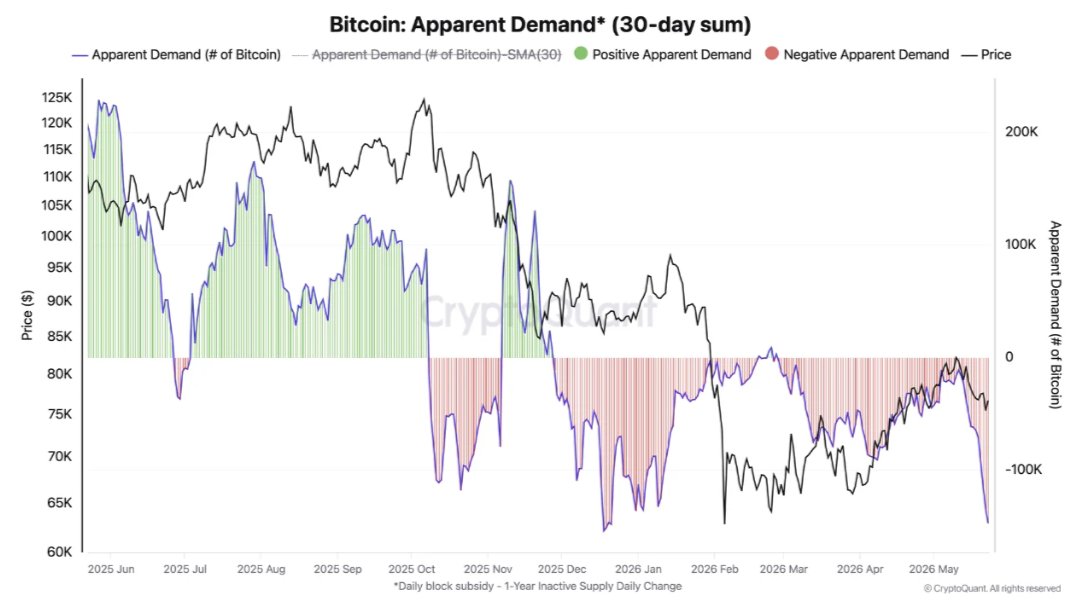
This is the key insight that separates short-term trading signal from long-term structural analysis. In prior Bitcoin cycles — including 2018–2019, 2022–2023, and the corrections within the 2020–2021 bull run — apparent demand troughs of this magnitude have consistently marked the period immediately before significant accumulation phases by large holders and institutional buyers. The demand metric turns negative before the price turns positive — because smart money accumulates during the disbelief phase, not after the recovery is confirmed.
The 2022/2023 Fractal — This Has All Happened Before
The most visually striking evidence for the current setup comes from analyst @MatthewHyland_ — who posted a side-by-side chart comparison on May 20, 2026 drawing the structural parallel between the 2022/2023 bottom and the current 2026 market structure.
The comparison is difficult to dismiss once you see it.
The 2022/2023 pattern (left chart):
Throughout late 2022 and into early 2023, Bitcoin faced a relentless barrage of bearish catalysts — FTX contagion, Gemini bankruptcy, DCG collapse, Silvergate Bank failure — and the narrative consensus was overwhelmingly negative. The chart shows the recurring sentiment labels that dominated every recovery attempt:
- “This rally will fail” — repeated at every bounce
- “$12K incoming” — the prevailing bearish price target
- “15.5K will be retested” — the expectation of new lows
Yet despite every catalyst that should have sent Bitcoin to $12,000 — massive bearish events consistently failed to produce new lows. Price stabilised in a defined range, built a base, and entered the “Disbelief” phase — where the market had been conditioned by so many failed rallies to assume any recovery would also fail.
The disbelief phase was exactly where the cycle turned. The explosive rally that followed rewarded those who accumulated during the period of maximum bearish consensus — and punished those who waited for confirmation.
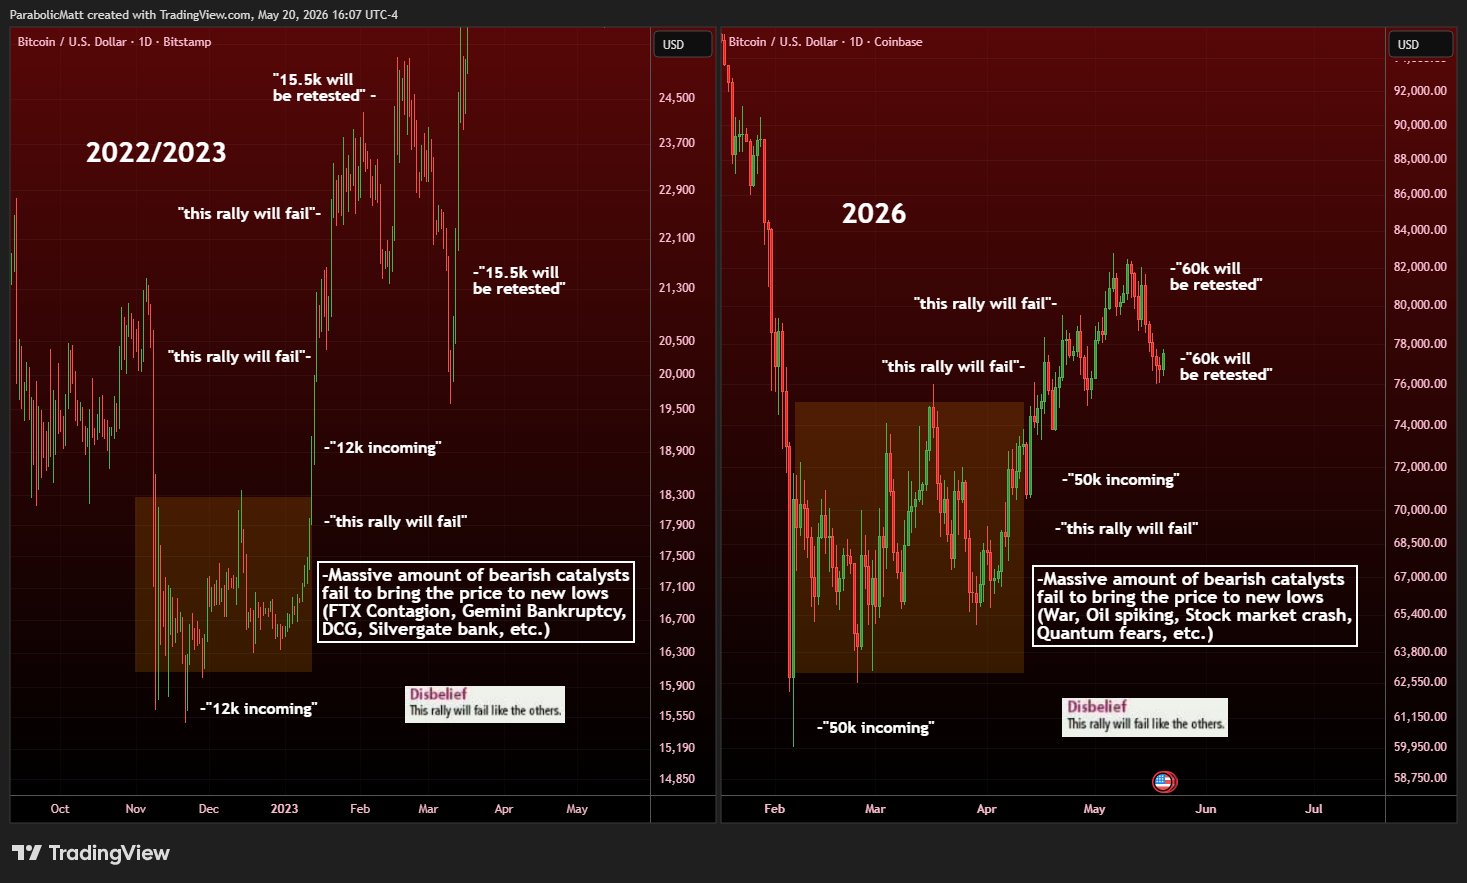
The 2026 pattern (right chart):
The structural parallel is striking. BTC in 2026 has faced its own barrage of bearish catalysts — war escalation, oil price spikes, stock market crash fears, quantum computing concerns — and the recurring narrative labels are almost word-for-word identical:
- “This rally will fail” — repeated at $80K, $84K, and the current recovery
- “$50K incoming” — the 2026 equivalent of the 2022 “$12K incoming” narrative
- “60K will be retested” — the new lows expectation replacing 2022’s “15.5K retest”
And just as in 2022/2023 — massive bearish catalysts are failing to produce new lows. War fears, oil above $100, stock market pressure — all of these arrived and all of them failed to break BTC below the $60,061 February low. The chart has entered what @MatthewHyland_ labels the same “Disbelief” phase — where the market, conditioned by multiple failed rallies, dismisses each recovery as temporary.
If the fractal continues to track — and it has tracked with remarkable precision to this point — the disbelief phase currently underway is not the beginning of a deeper decline. It is the highest-conviction accumulation window of the current cycle.
The Catalysts That Failed to Break Bitcoin in 2026
The right panel of the fractal chart lists the bearish catalysts that have arrived in 2026 and failed to produce new lows — a list that is worth reading carefully:
War and geopolitical escalation — US-Iran tensions, the Strait of Hormuz threat, and ongoing global conflict fears. As we covered in our Iran nuclear deadlock article, these catalysts triggered sharp short-term sell-offs — but not new cycle lows.
Oil spiking above $100 — A traditional macro risk-off trigger that historically weighs on speculative assets. Oil surged above $100 and BTC dipped — but did not break $60,061.
Stock market crash fears — Equity market weakness and recession concerns created parallel selling pressure. BTC correlated to the downside — but the correlation held at higher lows rather than new lows.
Quantum computing fears — A crypto-specific existential concern that generated significant narrative pressure. Bitcoin absorbed it and held structural support.
Each of these would have been cited as the reason BTC broke to new lows in a genuine bear market. None of them achieved it. That pattern — repeated across every bearish catalyst — is the 2026 equivalent of 2022/2023’s FTX and DCG contagion failing to break $15,500.
What Comes Next — The Setup
The combination of the three signals analysed above — apparent demand at yearly lows, price resilience despite maximum bearish catalysts, and a fractal structure that mirrors the highest-conviction accumulation zone of the prior cycle — creates a setup that is simultaneously uncomfortable and historically bullish.
Uncomfortable because the on-chain demand is genuinely negative and the YTD performance is red. Historically bullish because these are precisely the conditions under which Bitcoin has consistently built its most powerful recoveries.
As we identified in our Bitcoin critical juncture analysis, the immediate levels that will determine which scenario plays out remain $78,258 resistance and $75,733 support. A decisive reclaim of $78,258 within the current fractal context would be the first confirmation that the disbelief phase is transitioning into the early recovery phase — the same transition that preceded the explosive rally out of the 2022/2023 lows.
Bottom Line
Bitcoin’s on-chain demand is at its most bearish level of 2026 — and that is exactly what the fractal says should be happening right now. In 2022/2023, demand troughs and maximum bearish consensus marked the precise zone where the cycle turned. In 2026, the same catalysts — war, oil, stock market fears, quantum concerns — have failed to produce new lows just as FTX and DCG contagion failed to break $15,500 in the prior cycle.
The disbelief phase is uncomfortable by design. It is uncomfortable because it is supposed to shake out the impatient — and reward those who recognise that the absence of new lows despite maximum bearish pressure is itself the most bullish signal the market can produce.
The fractal has been right so far. The demand trough is here. The catalysts have failed to break the lows. What comes next — if the pattern holds — is accumulation followed by the recovery that the market currently refuses to believe in.
Frequently Asked Questions (FAQ)
What does Bitcoin’s weak demand signal mean?
CryptoQuant’s apparent demand metric has dropped to its lowest level of 2026, showing weak short-term buying activity. Historically, similar demand lows have often appeared near major accumulation zones.
What is the 2022–2023 Bitcoin fractal comparison?
Analysts say Bitcoin’s current structure closely resembles the 2022–2023 bottom — where bearish sentiment stayed extreme even as BTC quietly built a recovery base before a major rally.
What bearish events has Bitcoin absorbed in 2026?
BTC has held above its February low despite war fears, oil above $100, recession concerns, stock market weakness, and quantum computing narratives.
Which Bitcoin levels matter most right now?
$78,258 is the key resistance level bulls need to reclaim, while $75,733 remains the critical support zone to hold.
Is the bearish demand signal negative for long-term investors?
Not necessarily. Historically, periods of weak demand and heavy fear have created strong long-term accumulation opportunities for patient investors.
The opinions and market insights shared on CoinsProbe represent the views of individual authors based on prevailing market conditions at the time of publication. Cryptocurrency investments carry significant risk and volatility. Readers are encouraged to conduct their own research and seek professional financial advice before making investment decisions. CoinsProbe and its contributors do not accept responsibility for financial losses or decisions made based on published content.
CoinsProbe may publish sponsored articles, affiliate links, or promotional collaborations. All sponsored material is clearly labeled to maintain transparency with our audience. Our editorial decisions remain fully independent, and advertising partnerships do not influence reviews, rankings, or published opinions.
Since 2023, CoinsProbe has delivered reliable insights on cryptocurrency, blockchain, and digital assets. Our content is created by experienced researchers and analysts who follow strict editorial standards focused on accuracy, transparency, and credibility. Every article is carefully reviewed and verified using trusted sources and current market data. We provide unbiased analysis and timely updates covering everything from emerging crypto projects to major industry developments.