- Bitcoin trading at $82,779 (−2.50% 24h) — retesting the $82,000 double bottom neckline as support
- Analyst Ali Martinez (@alicharts) flags $82K retest as a buying opportunity before rally resumes
- Double bottom measured move projects a $100,000 target — a +21% move from current levels
- Daily close below $82,000 invalidates the pattern and reopens $78,000–$80,000 range
Bitcoin is trading at $82,779 — down 2.50% in the last 24 hours — with a market cap of $1.66 trillion. The pullback is not noise. It is the mechanism a double bottom pattern requires: break the neckline, retest it from above, then resume the rally. That sequence is now unfolding in real time.
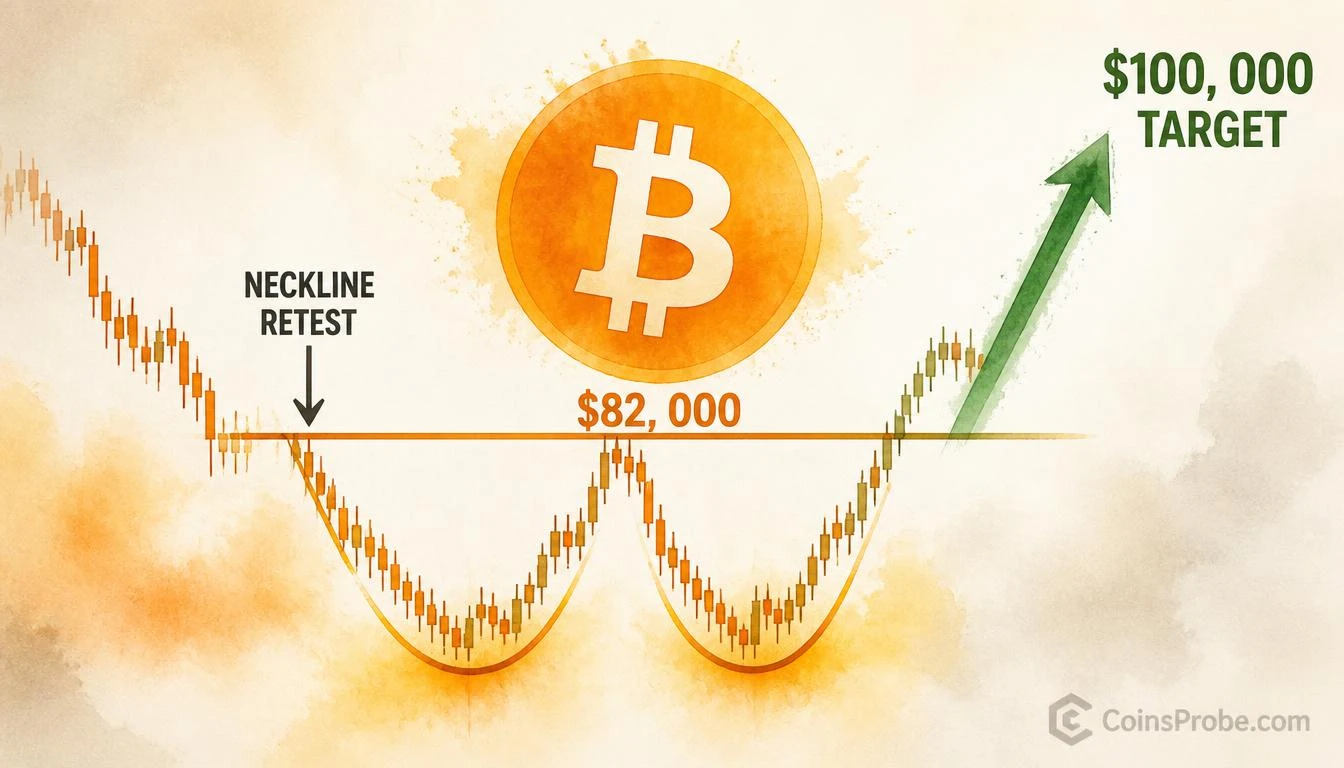
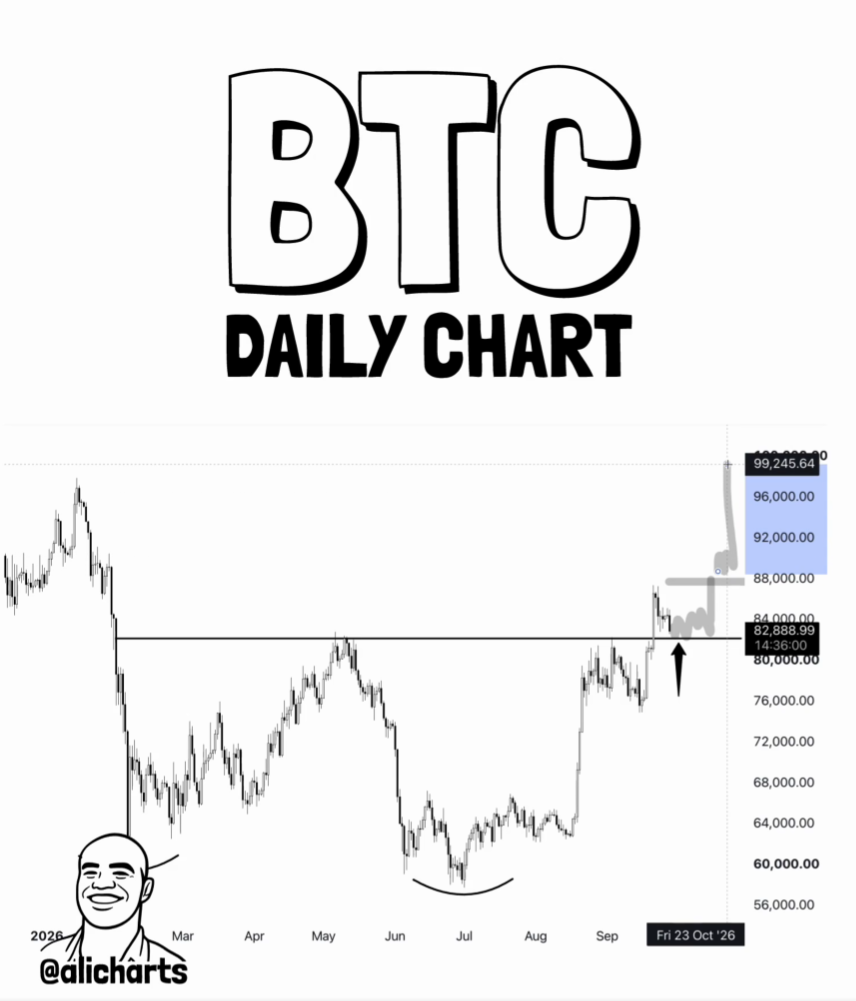
Crypto analyst Ali Martinez (@alicharts) flagged the setup on September 28, 2026, identifying Bitcoin as having “broken out of a double bottom pattern and now moving back toward the $82,000 neckline.” His conclusion is direct: “If this level holds as support, the retest could offer a buying opportunity before the rally resumes toward the pattern’s $100,000 target.”
The Double Bottom — What It Is and Why the Retest Matters
A double bottom is a reversal pattern formed when price finds the same floor on two separate occasions, separated by a recovery peak. The line connecting that recovery peak — the neckline — becomes the critical battleground. A confirmed breakout above the neckline is not the trade. The retest of that neckline from above, where former resistance flips to support, is where high-probability entries are structured.
The measured move target for a double bottom is calculated by taking the depth of the pattern — the distance from the two lows to the neckline — and projecting it upward from the breakout point. In Bitcoin’s current setup, that projection lands at $100,000.
At $82,779, Bitcoin is sitting directly at that neckline retest zone. The current 2.50% daily decline is the market performing the structural function the pattern demands. The question is whether $82,000 absorbs the selling or yields to it.
$82,000 — The Neckline That Defines the Trade
The $82,000 level carries specific technical significance here. It is not a round number picked arbitrarily — it is the neckline formed by the recovery high between Bitcoin’s two lows in the double bottom formation. A confirmed hold at this level transforms it from prior resistance into active support, completing the classic breakout-retest-resume sequence.
What makes the current test meaningful is context. Bitcoin has already crossed through this level once on the way up — establishing that buyers were willing to pay above $82,000. A retest now, with price returning to that same zone on lighter momentum, is precisely the structure that pattern traders assign probability to. It is worth noting that Bitcoin has navigated multiple macroeconomic disruptions in recent months, as covered in our analysis of Bitcoin dropping below $62K during geopolitical tensions — making the current recovery structure more significant against that backdrop.
The invalidation is equally well-defined. A daily close below $82,000 would signal the neckline failed to hold as support, negating the breakout and forcing a reassessment of the broader structure. Pattern traders will not wait for ambiguity — that level is the line.
$100,000 — The Measured Move Target
The $100,000 target is not a sentiment call. It is the arithmetic output of the double bottom’s measured move calculation. From the current neckline at $82,000, that represents a required move of approximately +21% from current levels.
Bitcoin’s recent history shows it is capable of moves of this magnitude within a single cycle leg. The asset has undergone dramatic purchasing-power appreciation over the past decade, and $100,000 — a level it has traded near before — represents a psychologically significant reclaim rather than uncharted territory.
The path from neckline retest to measured move target, however, requires sequential confirmation. The neckline hold must come first. Without it, the $100,000 target has no structural basis.
Bull and Bear Scenarios
Bullish Scenario — $82,000 Holds as Support
A daily close at or above $82,000 following this retest would confirm the neckline-to-support flip. That opens the initial recovery leg toward $90,000 as the first intermediate target, with the full measured move at $100,000 as the pattern’s primary objective. The trigger is a sustained close, not an intraday touch.
Bearish Scenario — $82,000 Fails
A daily close below $82,000 invalidates the double bottom breakout. In that scenario, the pattern resets and price would likely revisit the range between $78,000 and $80,000 — the prior consolidation zone. The broader consequences of a failed breakout retest were examined in our earlier piece on Bitcoin’s $738M liquidation event and 2022-style consolidation risk.
Volume and Confirmation — What to Watch
A neckline retest on declining volume is constructive — it signals the selling pressure driving the pullback is exhausting rather than accelerating. Traders monitoring this setup should watch for volume contraction during the current dip and a volume expansion on the next upside move. That combination — low-volume retest, high-volume resume — is the textbook confirmation of a valid double bottom resolution.
On-chain data platforms including Glassnode and CryptoQuant provide real-time spot demand metrics that can corroborate whether buyer absorption at $82,000 is genuine or temporary. Those readings update continuously and should be monitored alongside the price action.
At $82,779, Bitcoin is at the exact level where the trade either confirms or collapses. Ali Martinez has defined the structure with precision: $82,000 is the line, and $100,000 is the destination if that line holds. Watch for a sustained daily close above $82,000 — that is the one data point that determines whether the double bottom delivers its measured move or the pattern fails and resets.
Frequently Asked Questions
What is a double bottom pattern and how does it apply to Bitcoin at $82,000?
What happens to Bitcoin if $82,000 fails to hold as support?
How is the $100,000 Bitcoin target calculated from this pattern?
What volume signals confirm the Bitcoin double bottom retest is valid?
Source: Ali Charts · Published by CoinsProbe Markets Desk
The opinions and market insights shared on CoinsProbe represent the views of individual authors based on prevailing market conditions at the time of publication. Cryptocurrency investments carry significant risk and volatility. Readers are encouraged to conduct their own research and seek professional financial advice before making investment decisions. CoinsProbe and its contributors do not accept responsibility for financial losses or decisions made based on published content.
CoinsProbe may publish sponsored articles, affiliate links, or promotional collaborations. All sponsored material is clearly labeled to maintain transparency with our audience. Our editorial decisions remain fully independent, and advertising partnerships do not influence reviews, rankings, or published opinions.
Since 2023, CoinsProbe has delivered reliable insights on cryptocurrency, blockchain, and digital assets. Our content is created by experienced researchers and analysts who follow strict editorial standards focused on accuracy, transparency, and credibility. Every article is carefully reviewed and verified using trusted sources and current market data. We provide unbiased analysis and timely updates covering everything from emerging crypto projects to major industry developments.