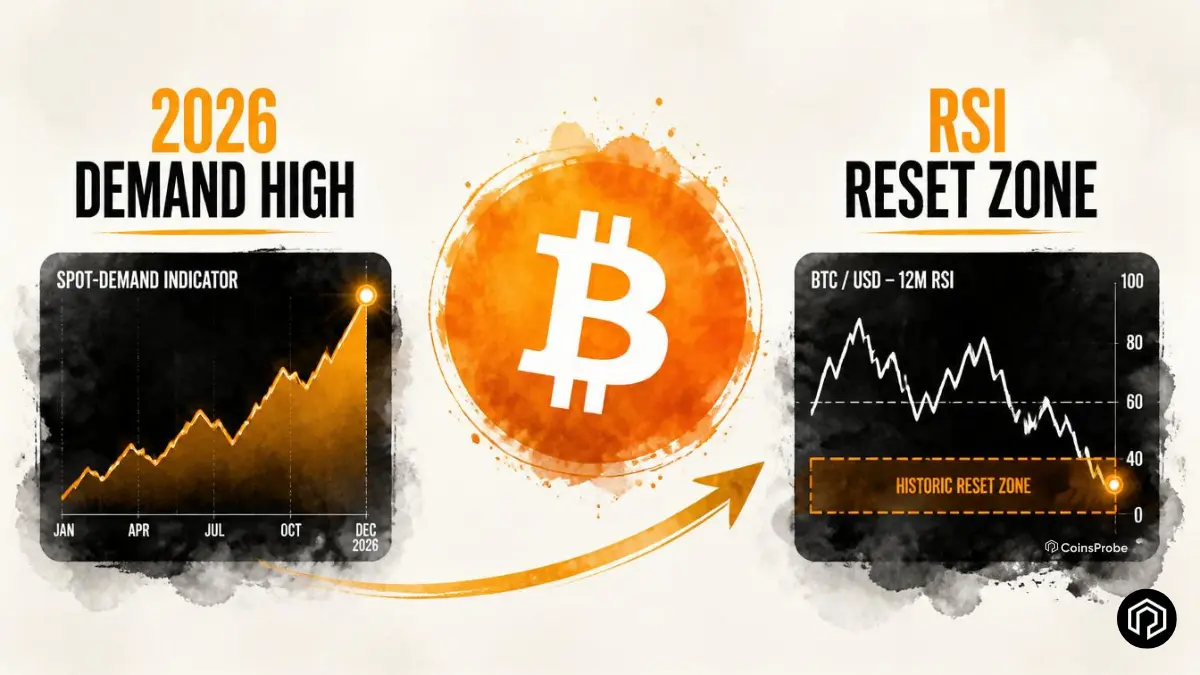

- Bitcoin's combined spot and perpetual futures demand just hit 10,883 BTC — the highest demand reading of 2026 — marking the first meaningful improvement after months of deeply negative territory.
- The 12-month RSI has compressed into the low-to-mid 40s — the same deep reset zone that appeared near major cycle bottoms in 2015, 2019, and 2022.
- Both signals are pointing in the same constructive direction simultaneously for the first time in 2026 — but demand must hold and sustain above current levels to confirm the shift.
Bitcoin is trading near $64,300 — up a modest 0.42% over the past 30 days — as two independent signals from entirely different analytical frameworks are both flagging the same thing: the prolonged deterioration that has defined Bitcoin’s 2026 market structure may be beginning to stabilize.
The signals are not dramatic by themselves. But their simultaneous appearance — a 2026 record in demand alongside a 12-month RSI sitting in the exact zone that has marked every major Bitcoin cycle bottom since 2015 — creates a combination that is historically worth paying close attention to.
Signal 1 — Bitcoin Demand Hits Its Highest Reading of 2026
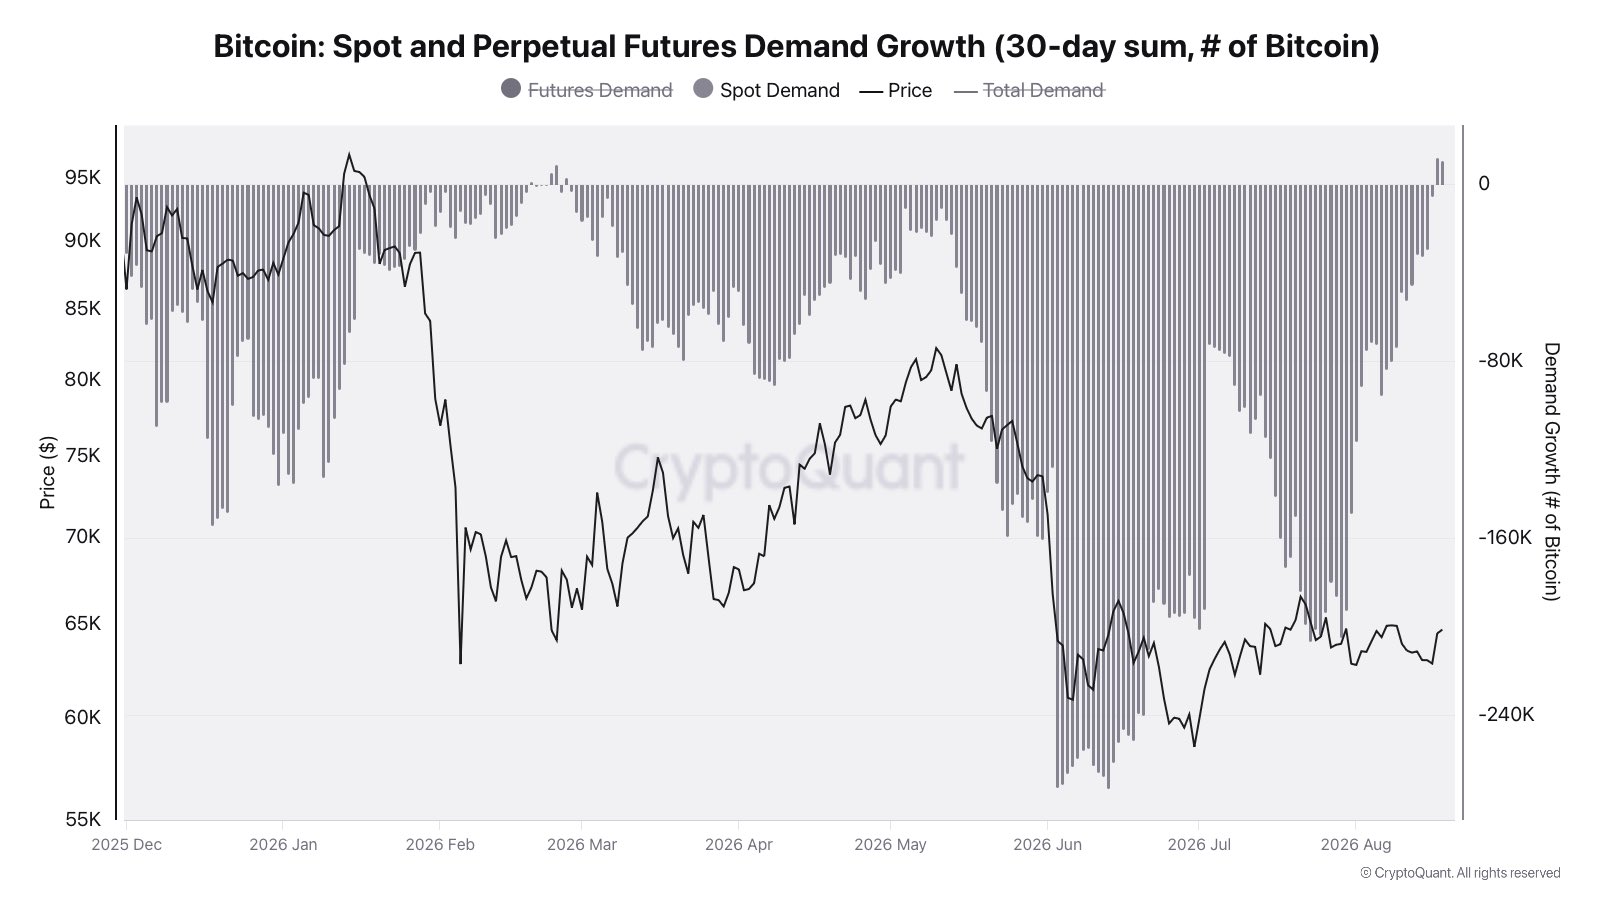
The first signal comes from Darkfost (CryptoQuant contributor), who flagged that Bitcoin has just recorded its highest combined spot and perpetual futures demand reading of 2026 — with the 30-day sum of spot and futures demand growth reaching 10,883 BTC.
Context — Where Demand Has Been in 2026
To understand why 10,883 BTC matters, the context of where demand has been for the past several months is essential. The CryptoQuant chart tells a clear story: Bitcoin’s spot demand has been deeply negative for the vast majority of 2026 — large downward bars dominating the demand chart from February onward as net distribution significantly exceeded net accumulation on a rolling 30-day basis.
As covered in our Bitcoin spot demand flashing potential bullish reversal analysis and Bitcoin stable but not bullish yet — on-chain indicators signal caution, the absence of positive spot demand has been the most persistent structural headwind against a sustained Bitcoin recovery throughout the year. Futures-led price support has repeatedly proven fragile without organic spot buying to underpin it.
The latest chart shows that while the 30-day bars remain predominantly negative, they are narrowing toward zero — and the most recent reading of +10,883 BTC represents the first time demand has turned meaningfully positive on a 30-day combined basis in 2026. The bleeding, as Darkfost frames it, is starting to slow.
Why the Direction Matters More Than the Size
Darkfost’s framing of the signal is appropriately measured: the absolute number (10,883 BTC) remains relatively modest. A demand reading of this size is not comparable to the large positive demand spikes that characterized Bitcoin’s strongest rally phases in 2024 and early 2025. What matters is the directional shift — from deeply negative to the first positive reading of the year — rather than the magnitude of the reading itself.
The analytical significance of spot and futures demand turning positive together is also highlighted explicitly: a simultaneous improvement in both spot and futures demand is viewed as a more meaningful signal than a move in either dimension alone. The current chart shows both narrowing toward zero simultaneously — consistent with a genuine structural improvement in the demand environment rather than a temporary futures-driven anomaly.
As documented in our Bitcoin technical on-chain update: heatmap, levels, and bottom signal, the on-chain structural picture for Bitcoin has been gradually improving across multiple independent metrics through August 2026. The demand reading hitting a 2026 high is the most direct demand-side confirmation of that gradual improvement.
The key caveat: analysts note it remains to be seen whether this improvement can be sustained. A single positive reading does not confirm a structural shift — that requires the demand staying above current levels and ideally continuing to build in the coming sessions. The transition from the first positive reading to a sustained positive trend is the specific development that would elevate this signal from encouraging to confirmed.
Signal 2 — 12-Month RSI in the Deep Reset Zone
The second signal operates on a much longer timeframe — and its historical track record is one of the most consistently documented patterns in Bitcoin’s full cycle history.
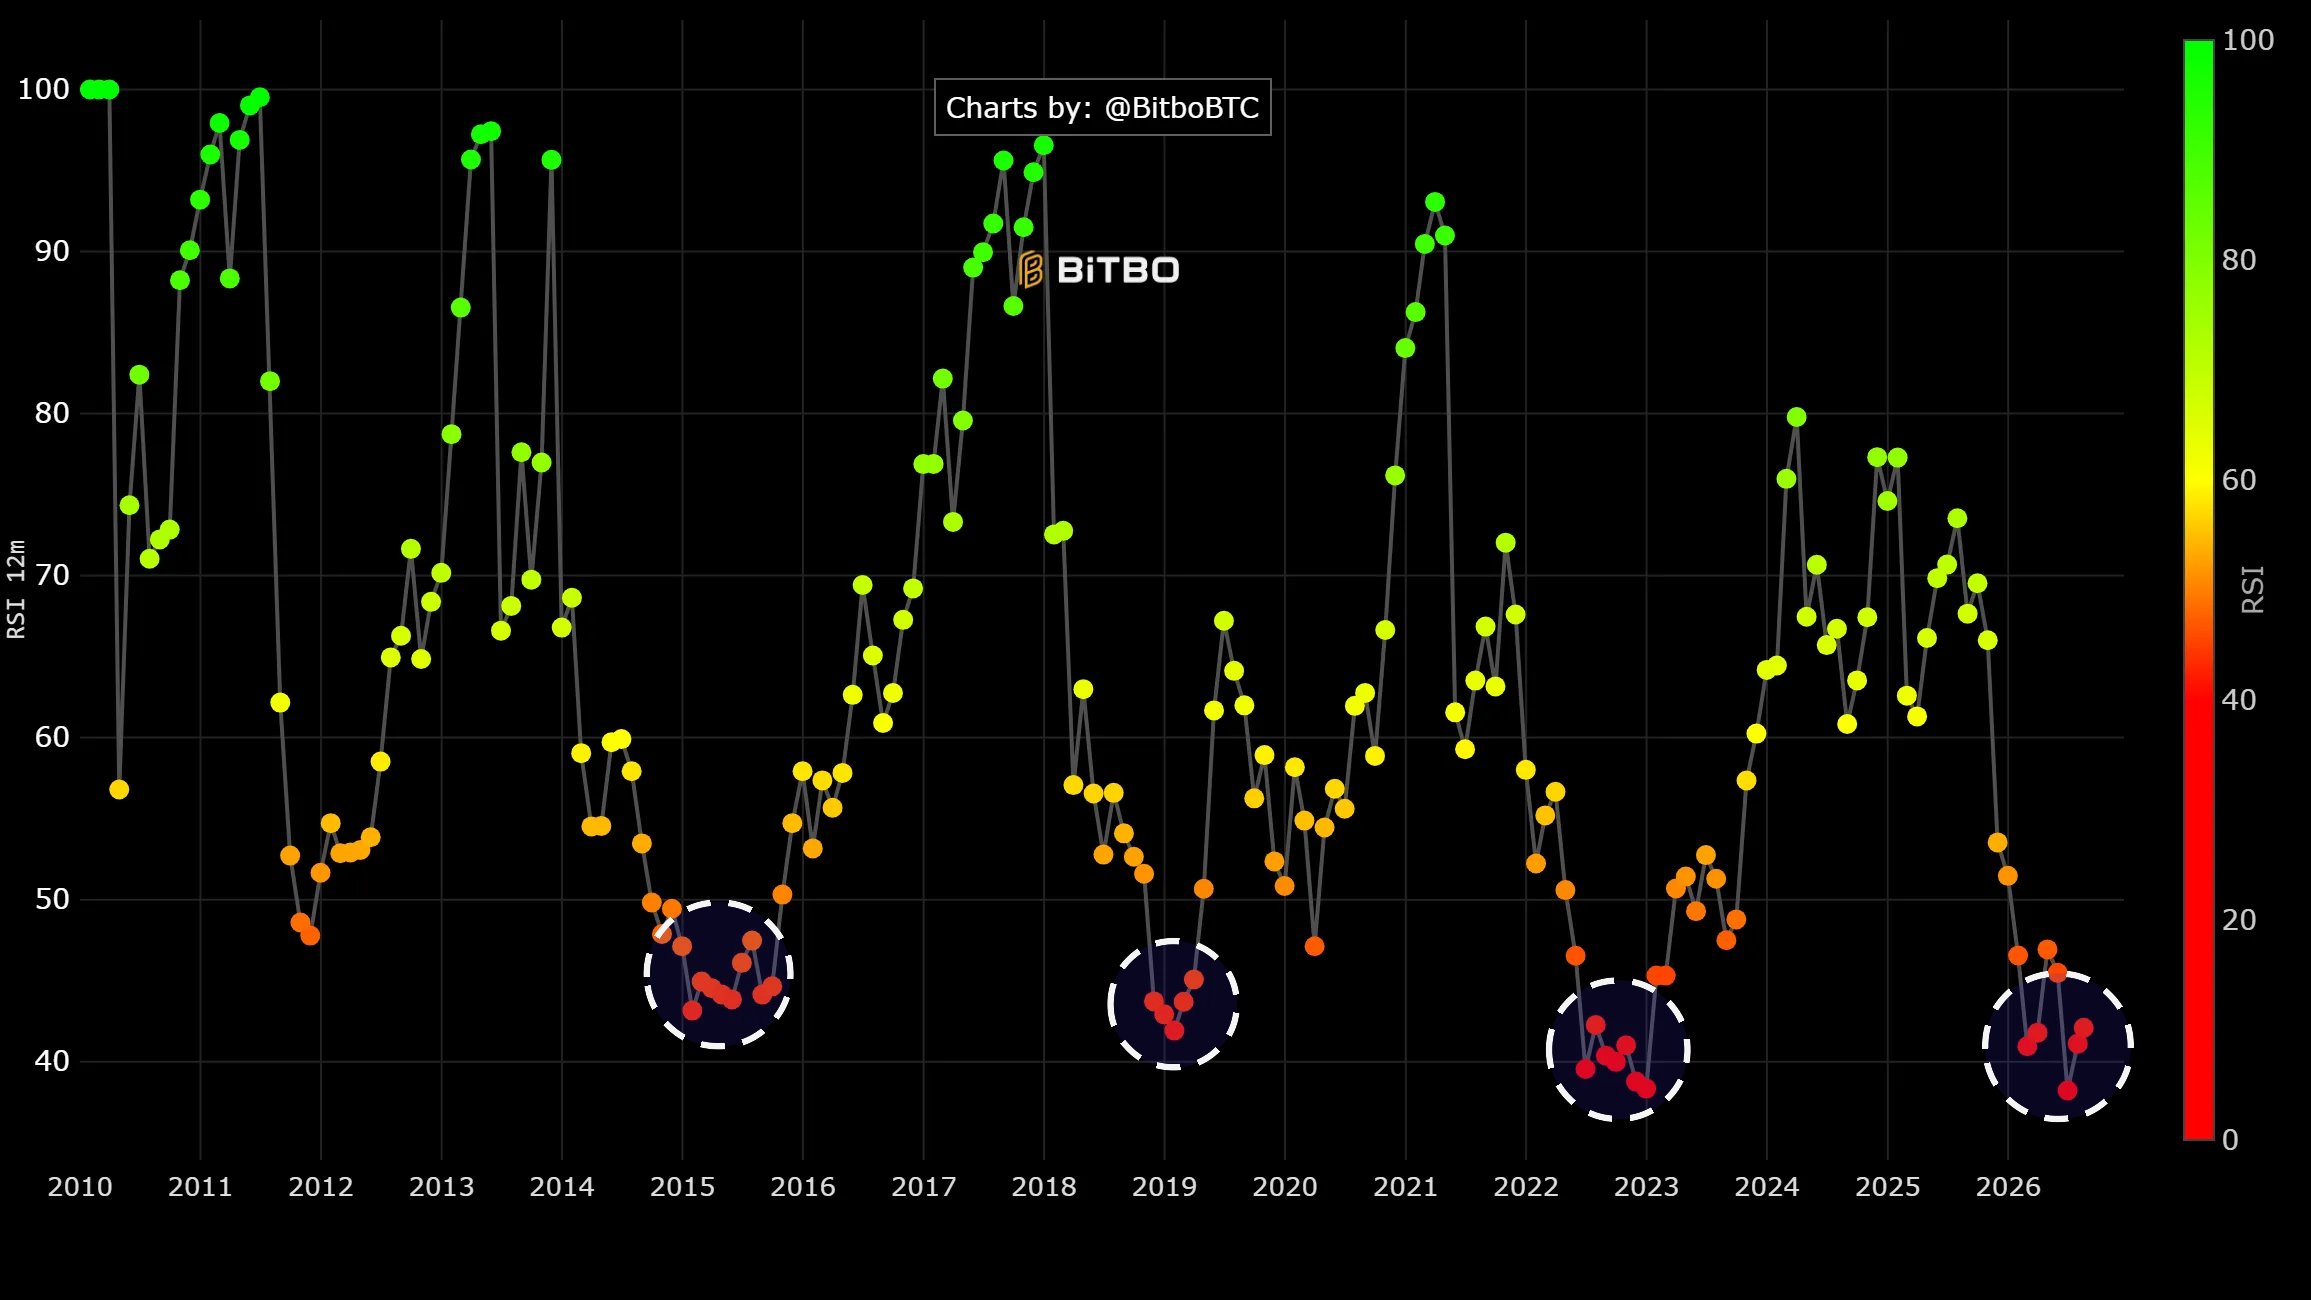
According to analysis from CryptosBatman (chart sourced from BitboBTC), Bitcoin’s 12-month RSI has compressed into the low-to-mid 40s — a level that the chart identifies as a deep reset zone with specific historical significance.
What the 12-Month RSI Measures
The 12-month RSI is not a standard short-term momentum tool — it measures momentum on an annual scale, reflecting the cumulative directional strength of Bitcoin’s price over a full 12-month period. Because it operates on such a long timeframe, its readings are much slower to move and carry significantly more weight than daily or weekly RSI readings. Reaching deeply oversold levels on a 12-month RSI requires a sustained and significant period of underperformance — not a temporary pullback.
The Historical Pattern — Circled on the Chart
The BitboBTC chart marks previous instances where the 12-month RSI dropped into the current reading range with white dashed circles — and each circled instance corresponds directly with one of Bitcoin’s major recognized cycle bottoms:
| Period | 12-Month RSI Condition | What Followed |
|---|---|---|
| 2015 | Deep reset zone (low-to-mid 40s) | Multi-year bottom → 2017 bull run |
| 2018–2019 | Deep reset zone (low-to-mid 40s) | Cycle bottom → 2020–2021 expansion |
| 2022–2023 | Deep reset zone (low-to-mid 40s) | Cycle bottom → 2023–2025 recovery |
| 2026 | Low-to-mid 40s — current | Pending |
The current reading places the 12-month RSI in the fourth instance of reaching this zone across Bitcoin’s full recorded history — matching the same level that has preceded three of Bitcoin’s most significant multi-year recoveries.
CryptosBatman’s framing of the current signal is analytically precise: Bitcoin is entering the part of the cycle where momentum matters more than price. This observation addresses a common misunderstanding about RSI reset zones — they do not signal immediate price reversals. What they signal is that the market is building a floor — a process that happens in the background while price remains under pressure and before broader sentiment turns positive. The price move that follows the floor-building phase tends to be significant and sustained, but the floor-building itself is often quiet, hesitant, and easy to miss.
As covered in our Bitcoin is in the accumulation zone — STH/LTH signal still matters more analysis and Bitcoin nears major accumulation levels as two bottom signals align, the macro framework building around Bitcoin’s current position has been pointing toward a floor-building phase throughout August 2026. The 12-month RSI in the deep reset zone is the longest-timeframe confirmation of that thesis — and the one with the most consistent historical track record.
Why Both Signals Together Create a More Complete Picture
The 10,883 BTC demand reading and the 12-month RSI in the low-to-mid 40s are not measuring the same thing — one is a short-term on-chain demand flow metric, the other is a long-term annual momentum indicator. Their simultaneous appearance at historically significant levels is what makes the current setup analytically meaningful.
The demand reading says: The structural on-chain demand environment has produced its first positive combined reading of 2026 — the bleeding is slowing and the supply/demand balance is beginning to shift.
The 12-month RSI says: Long-term momentum has reset to the same zone that has marked every major Bitcoin cycle bottom in the asset’s history — the floor-building phase is underway, regardless of what short-term price action looks like.
Together they describe a Bitcoin market where the near-term demand picture is improving for the first time in months and the long-term momentum picture is at the exact reset level that has historically preceded major recoveries — a combination that has not been visible simultaneously at any prior point in 2026.
As covered in our Bitcoin coiling for a big move — two rare signals and Bitcoin coiling for a major move — historical volatility at extreme lows analyses, the compression of multiple independent indicators toward historically extreme readings simultaneously has been the defining feature of Bitcoin’s August 2026 setup. The demand and RSI signals add the demand-flow and long-term momentum dimensions to what has been building across volatility, trend strength, valuation, and on-chain accumulation frameworks throughout the month.
What to Watch — The Specific Confirmations That Matter
Demand holding above zero on a sustained basis: The 10,883 BTC reading is the first positive combined demand reading of 2026 — but a single data point does not confirm a structural shift. The specific development to monitor is whether spot and futures demand sustain above zero in the coming sessions or quickly revert to negative. Sustained positive readings over 2–3 consecutive weeks would represent genuine structural confirmation.
12-Month RSI turning upward from current levels: The RSI reset zone marks where floor-building typically occurs — but the confirmation that the floor has been established comes when the 12-month RSI begins recovering upward from the current low-to-mid 40s. A move toward 50 and above would indicate that annual momentum is beginning to shift from negative to constructive.
Broader on-chain signal convergence: As covered in our Bitcoin whales accumulate as retail sells analysis and Bitcoin bottoms when realized profit crosses realized loss — crossover nears, multiple independent on-chain frameworks are approaching or at their historical confirmation thresholds. A convergence of the demand improvement with the STH/LTH signal, realized profit/loss crossover, and network activity metrics would represent the most comprehensive multi-signal confirmation available.
Bottom Line
Bitcoin at $64,300 — up just 0.42% over 30 days — is not presenting a dramatic price story. What it is presenting is a quiet but historically grounded convergence of two independent signals that describe the same underlying market transition.
The 10,883 BTC combined demand reading is the highest of 2026 — marking the first time since February that the on-chain demand environment has produced a positive combined reading after months of deep negative territory. The 12-month RSI in the low-to-mid 40s is the fourth time in Bitcoin’s history that annual momentum has reset to this level — matching the exact zone that preceded the 2015, 2019, and 2022 cycle recoveries.
Neither signal is a guarantee. Both need to sustain and develop further before the structural shift can be called confirmed. But the direction is clear: Bitcoin’s 2026 deterioration — in both demand and long-term momentum — appears to be finding a floor. Whether that floor holds and builds into a recovery, or requires more time and potentially lower prices before the signals confirm definitively, will be answered by the data in the sessions ahead.
Frequently Asked Questions
What does Bitcoin’s latest demand reading mean?
Bitcoin just recorded its highest combined spot and futures demand of 2026 at 10,883 BTC. While still modest, it signals that demand is slowly improving after months of steady deterioration.
Is the current demand recovery strong enough?
The improvement is constructive but remains relatively small. Analysts are watching closely to see if demand can hold in positive territory or if it will slip back into negative readings in the coming days.
What is the significance of Bitcoin’s 12-month RSI?
The 12-month RSI has entered a deep reset zone (currently in the low-to-mid 40s). Similar levels in 2015, 2019, and 2022 appeared near major cycle bottoms and often preceded longer-term accumulation phases.
Does a reset in long-term RSI mean Bitcoin has bottomed?
Not necessarily. A deep RSI reset indicates that momentum has been washed out and the market is building conditions for a potential floor, but confirmation still requires improving demand and price structure.
Should investors buy Bitcoin based on these signals?
These metrics are useful long-term indicators showing early signs of stabilization. However, no single signal guarantees a reversal. Always combine multiple data points and manage risk carefully. This is not financial advice.
The opinions and market insights shared on CoinsProbe represent the views of individual authors based on prevailing market conditions at the time of publication. Cryptocurrency investments carry significant risk and volatility. Readers are encouraged to conduct their own research and seek professional financial advice before making investment decisions. CoinsProbe and its contributors do not accept responsibility for financial losses or decisions made based on published content.
CoinsProbe may publish sponsored articles, affiliate links, or promotional collaborations. All sponsored material is clearly labeled to maintain transparency with our audience. Our editorial decisions remain fully independent, and advertising partnerships do not influence reviews, rankings, or published opinions.
Since 2023, CoinsProbe has delivered reliable insights on cryptocurrency, blockchain, and digital assets. Our content is created by experienced researchers and analysts who follow strict editorial standards focused on accuracy, transparency, and credibility. Every article is carefully reviewed and verified using trusted sources and current market data. We provide unbiased analysis and timely updates covering everything from emerging crypto projects to major industry developments.