
- Bitcoin's Apparent Demand (30-day sum) is approaching its first positive flip since February 2026 — historically producing a 78% win rate and +18.1% median price gain over the following 60 days.
- When valuations are depressed alongside the demand flip — as they currently are — the historical win rate rises to 87%.
- Analyst James Easton's long-term oscillator is sitting near multi-year lows of 41–44, matching the same readings that have historically appeared at Bitcoin's most asymmetric long-term entry points.When valuations are depressed alongside the demand flip — as they currently are — the historical win rate rises to 87%.
Bitcoin is trading in the $64,300–$64,700 range as two independent signals — one from on-chain demand data, one from market psychology — converge on the same conclusion: the conditions that have historically preceded Bitcoin’s strongest forward returns are forming simultaneously, while most market participants remain too hesitant to act on them.
At the time of writing, BTC sits at approximately $64,300–$64,700 as CryptoQuant’s Apparent Demand metric — after months of deeply negative readings — approaches the zero line for the first time since February 2026. The last time this transition occurred, it marked the beginning of one of the more significant price recoveries of the current cycle.
Signal 1 — Apparent Demand Approaching Its First Positive Flip Since February 2026
The most structurally significant development in Bitcoin’s current on-chain picture comes from CryptoQuant’s Apparent Demand metric — a 30-day sum indicator that tracks daily block subsidy minus the 1-year inactive supply daily change, providing a measure of genuine net demand for Bitcoin in the spot market.
What Apparent Demand Measures
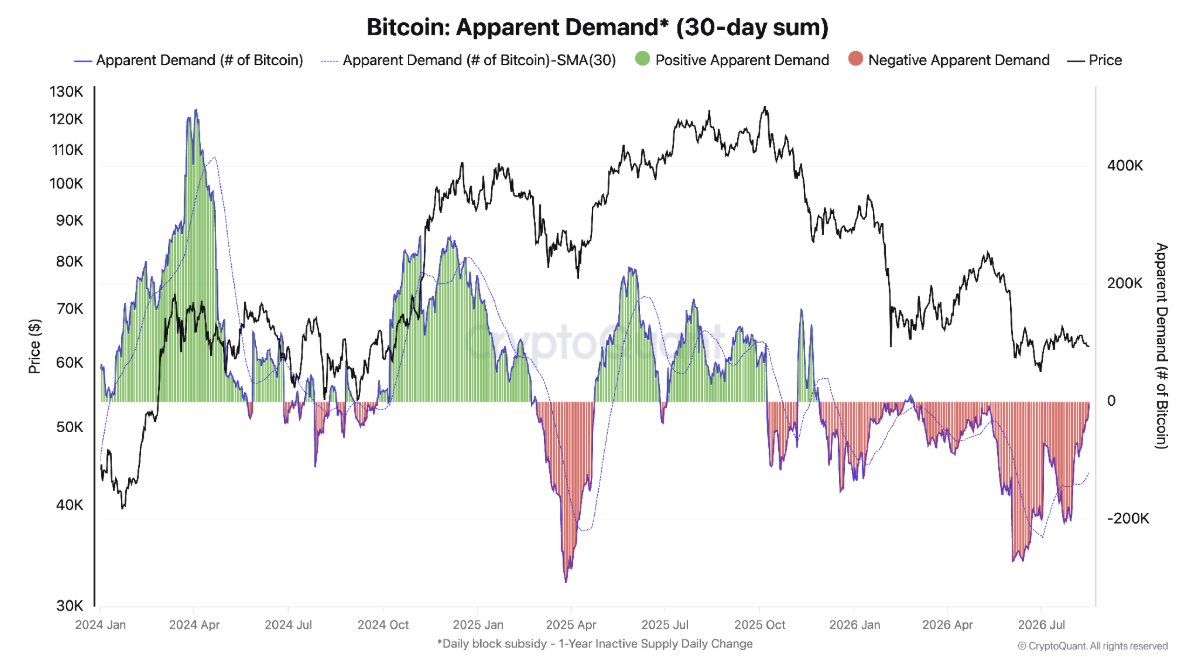
The Apparent Demand metric attempts to answer a simple but critical question: is the Bitcoin market currently in net accumulation or net distribution on a 30-day basis? A positive reading (green bars on the chart) means demand is outpacing the release of previously inactive supply — genuine net buying pressure. A negative reading (red bars) means inactive supply coming back to market is exceeding new demand — net distribution dominates.
Where the Metric Has Been — And Where It’s Going
Since February 2026, Bitcoin’s Apparent Demand has been in deeply negative territory — the extended red bar period visible on the CryptoQuant chart that has characterized the 2026 corrective phase. This prolonged net distribution environment has been one of the primary structural headwinds against a sustained Bitcoin recovery throughout the year.
As covered in our Bitcoin futures demand vs. spot demand CryptoQuant heatmap analysis, the absence of positive spot demand has been the most critical missing piece in Bitcoin’s recovery thesis — with futures-led price support proving fragile without organic spot buying to underpin it.
The Apparent Demand metric is now recovering toward the zero line — approaching the threshold between net distribution and net accumulation for the first time in approximately six months. This is not yet a confirmed positive flip — but the directional trajectory from the deeply negative readings of recent months toward the zero line is itself a meaningful change in the demand structure.
The Historical Statistics — What a Positive Flip Has Meant
The reason the Apparent Demand approaching the zero line is drawing analytical attention is the historical performance data associated with confirmed positive flips:
| Condition | Metric |
|---|---|
| Median price gain (60 days post-flip) | +18.1% |
| Win rate (positive 60-day return) | 78% |
| Win rate at depressed valuations | 87% |
A 78% win rate on a 60-day forward return basis is a statistically meaningful edge in a market as complex and noisy as Bitcoin. The elevation of that win rate to 87% when valuations are depressed — as they currently are, with Bitcoin down 27%+ year-to-date and multiple valuation metrics approaching historical lows — adds the valuation dimension that makes the current setup more compelling than a demand flip occurring during a neutral valuation environment.
As documented in our Bitcoin LTH MVRV and Fibonacci lower bands analysis and Bitcoin two independent models both pointing to undervaluation, the valuation framework for Bitcoin at current levels is consistent with the “depressed valuations” condition that has historically elevated the demand flip win rate to 87%.
A confirmed flip into positive Apparent Demand territory would mark the end of the six-month net distribution phase that has characterized 2026 — and, based on the historical data, would represent one of the more statistically grounded forward-return setups visible in Bitcoin’s current analytical landscape.
Signal 2 — Market Psychology: Scared of -20%, Comfortable Missing +400%
The second signal is less quantitative but arguably more important for understanding why the demand flip setup remains underappreciated by most market participants.
Analyst James Easton (@JamesEastonUK) captured the current market psychology with a characteristically precise observation:
“They are scared to buy in case of a -20% drop. But will happily miss a +400% move. Strange.”
The behavioral pattern Easton is describing is one of the most documented and destructive biases in investment psychology: loss aversion asymmetry — where the pain of a potential -20% drawdown feels more real and immediate than the opportunity cost of missing a +400% advance. The result is paralysis at exactly the moments when the historical data most strongly favors action.
What the Long-Term Chart Shows
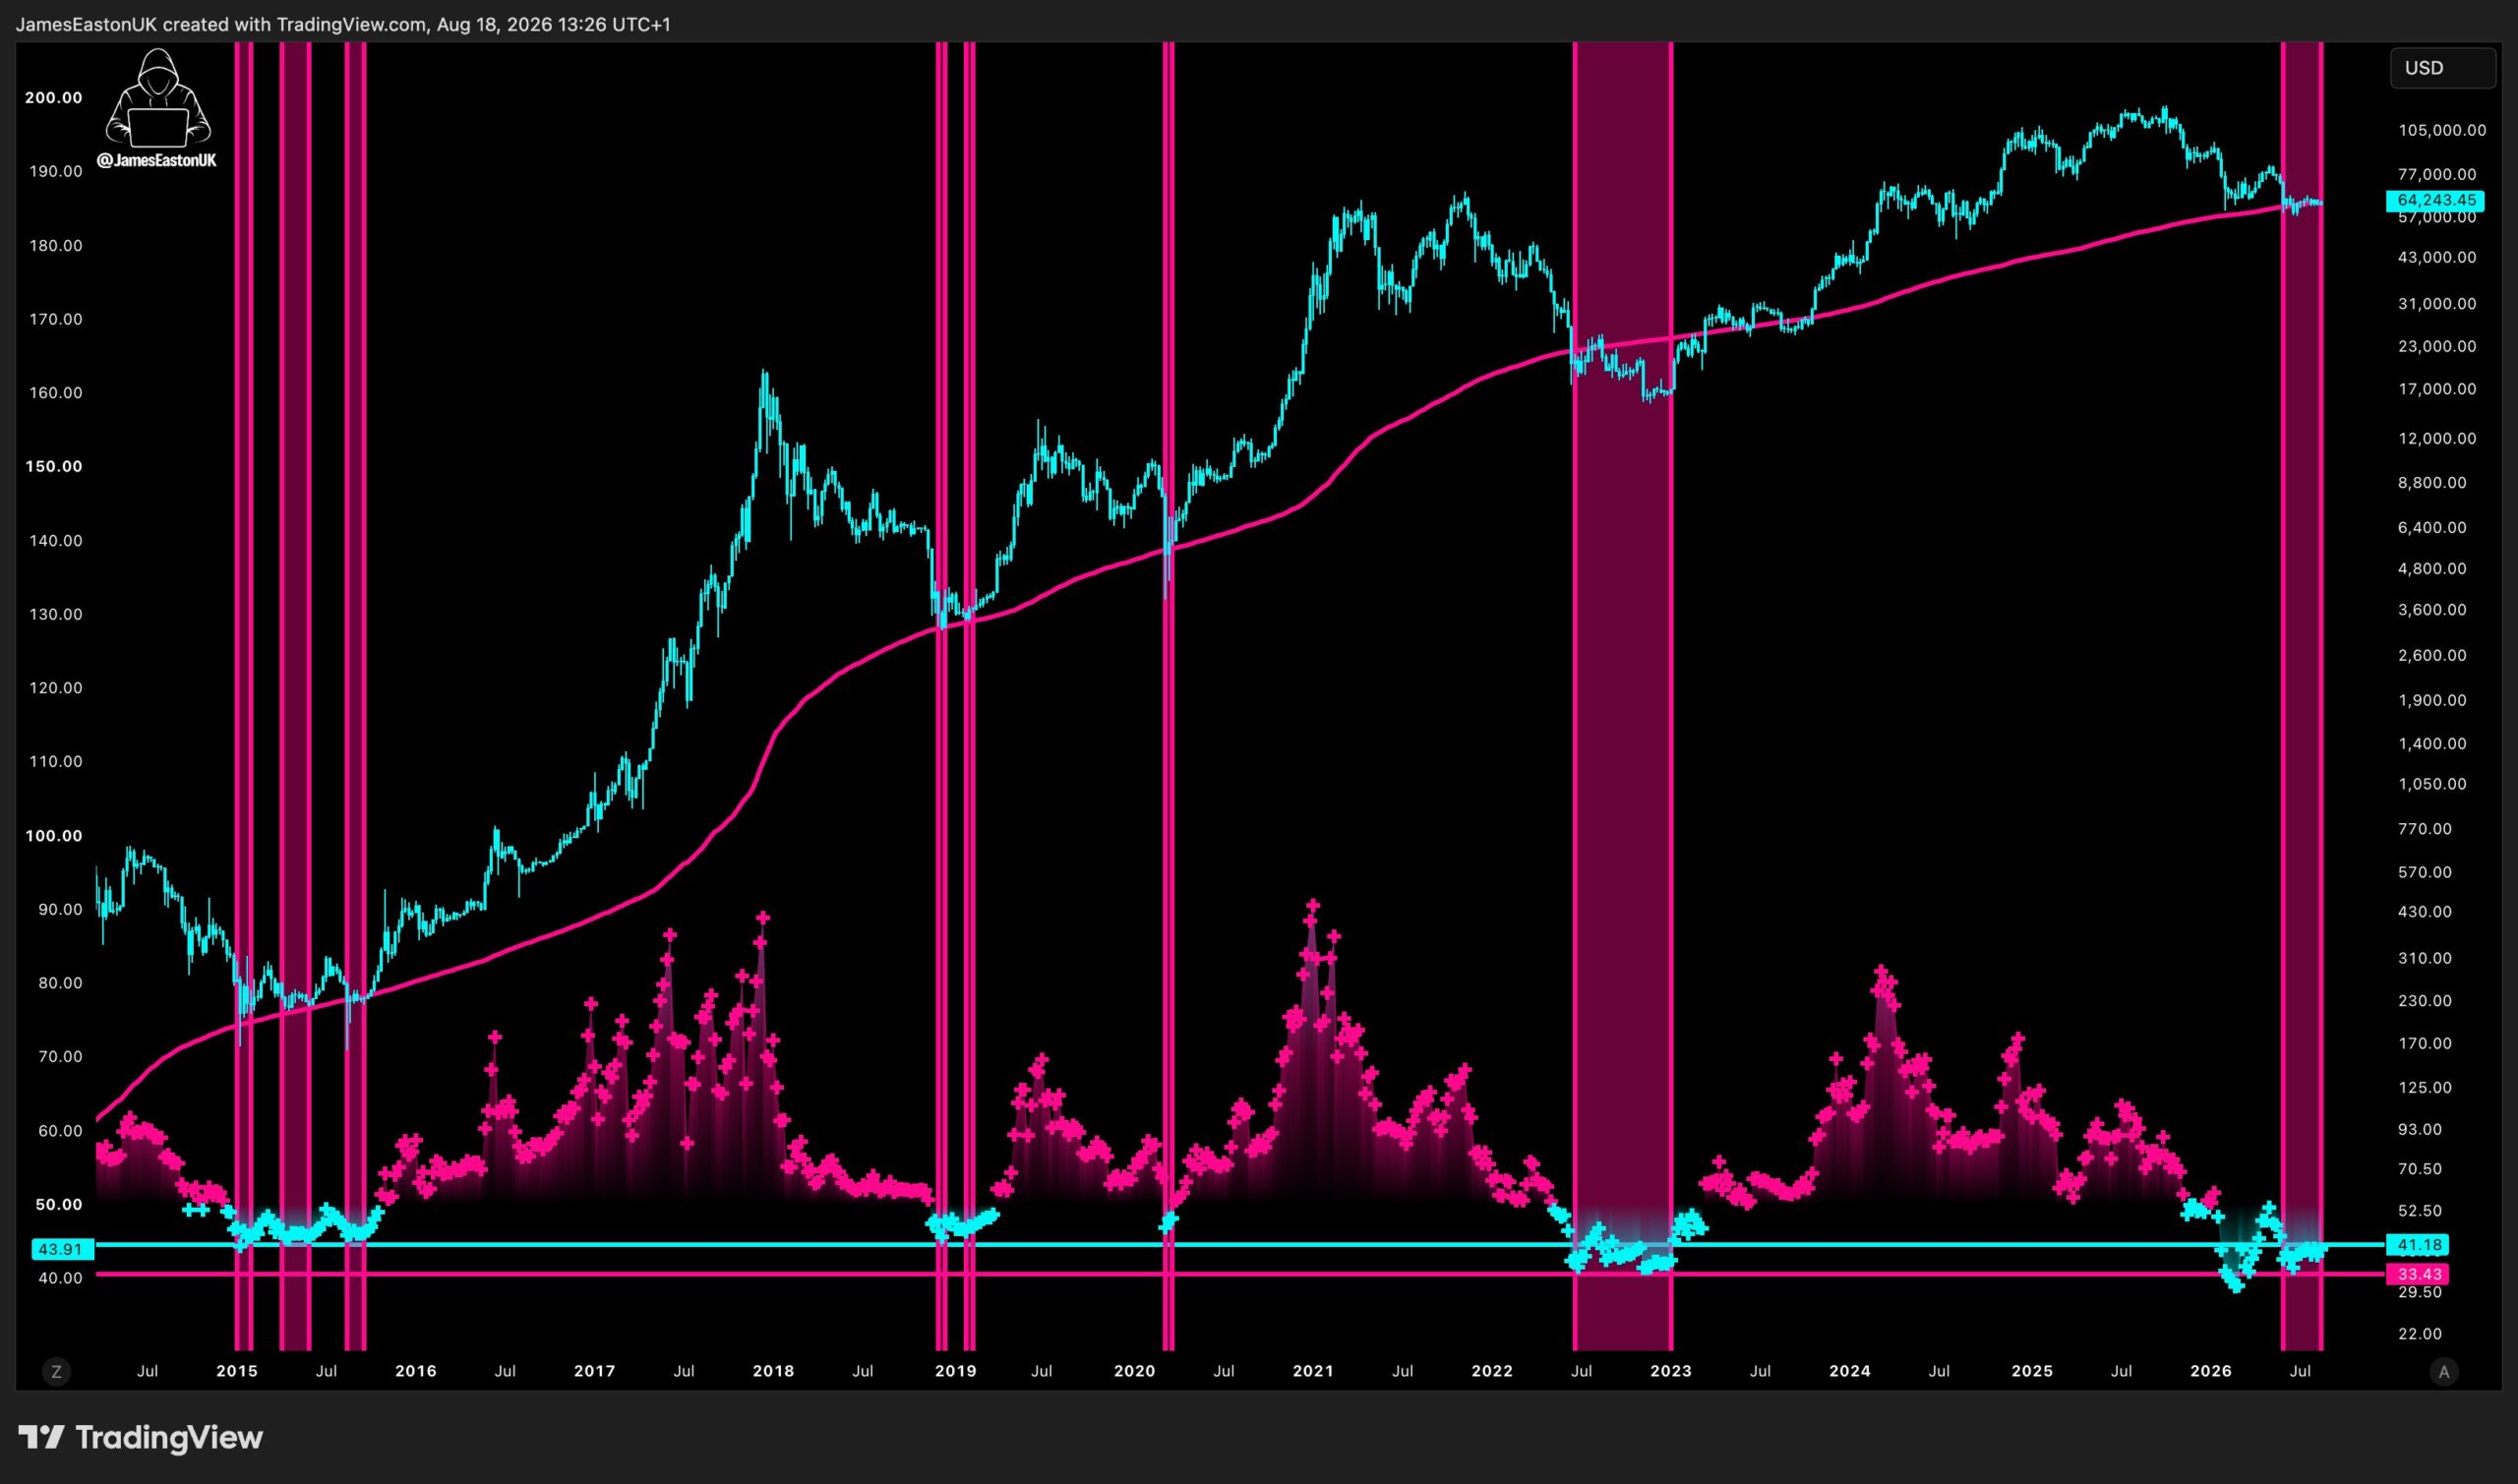
Easton’s long-term Bitcoin chart provides the quantitative backdrop for his observation. The chart plots Bitcoin price alongside a momentum oscillator currently sitting near multi-year lows in the 41–44 zone — approaching the same levels marked by the pink cross markers and vertical bars on the chart.
The vertical bar markers on Easton’s chart identify previous periods where the oscillator reached similarly depressed readings — and the pattern across Bitcoin’s full cycle history is consistent: these readings have appeared during periods of maximum fear and hesitation, precisely when long-term risk-reward was most asymmetric and when the majority of market participants were either waiting for lower prices or had already exited their positions.
The pink curve — the long-term trend line — shows Bitcoin’s current price sitting near or at the trend, consistent with the historical pattern where oscillator lows at the trend have marked major cycle inflection points rather than the beginning of extended further declines.
The current oscillator reading of 41–44 sits in the zone that has historically aligned with what Easton describes as the most asymmetric long-term entry windows in Bitcoin’s cycle — the points where a -20% downside was possible but a +400% upside was the historically probable outcome for participants with sufficient time horizon and conviction.
As covered in our Bitcoin ADCI accumulation zone analysis and Bitcoin ADX 2-year low and volatility compression breakdown, the macro technical and on-chain picture building through August 2026 has been consistently pointing toward a market at or near a historically significant inflection point. Easton’s oscillator at 41–44 adds the long-term cycle momentum dimension to that picture.
Why the Convergence of Both Signals Matters
The Apparent Demand approaching its first positive flip since February 2026 and Easton’s oscillator at multi-year lows are not the same tool measuring the same thing — one is an on-chain demand metric, the other is a long-term price momentum indicator. Their simultaneous appearance at historically meaningful levels is what creates the analytical weight.
The Apparent Demand flip says: The structural on-chain demand environment is transitioning from net distribution to net accumulation — a shift that has produced +18.1% median gains over 60 days with an 87% win rate at depressed valuations.
The oscillator at 41–44 says: The long-term momentum picture is at a level that has historically coincided with maximum fear and the most asymmetric long-term entry windows — the points where most participants are too hesitant to act.
Together they describe a setup where the data is constructive and the psychology is not — precisely the condition that has historically offered the most favorable environment for disciplined, data-driven positioning.
What to Watch — The Specific Trigger
Apparent Demand crossing into positive territory: The specific event to monitor is a sustained positive reading on CryptoQuant’s 30-day Apparent Demand sum — green bars replacing the red bars that have dominated since February 2026. This confirmed flip, rather than the current approach to zero, is the data point that activates the 78%–87% historical win rate framework.
Easton oscillator sustaining above 44: A move and hold above the current 41–44 oscillator reading would indicate that long-term momentum is beginning to recover from its cycle low — the early stages of the transition from the maximum-fear phase to the early-recovery phase.
Valuation metrics maintaining depressed readings: The 87% win rate specifically applies when valuations are depressed alongside the demand flip. As long as the LTH MVRV remains below 1.5, the Fibonacci lower bands remain proximate, and the ADCI remains below 30, the elevated win rate condition is maintained.
Bottom Line
Bitcoin at $64,300–$64,700 on August 18, 2026 is presenting a convergence of two signals that describe the same underlying market condition from different analytical angles.
CryptoQuant’s Apparent Demand is approaching its first positive flip in six months — with historical data showing a 78% win rate and +18.1% median 60-day gain on the flip, rising to 87% when valuations are depressed. James Easton’s long-term oscillator at 41–44 quantifies the maximum-fear environment that has historically coincided with Bitcoin’s most asymmetric long-term entry points — and his observation about market psychology captures precisely why most participants are positioned to miss the move that both signals are pointing toward.
The demand flip is not yet confirmed. The oscillator has not yet turned. But the directional trajectory of both — one moving from deeply negative toward zero, the other sitting at multi-year lows that have historically preceded major recoveries — describes a Bitcoin market where the data and the opportunity are increasingly aligned, while the psychology remains exactly as hesitant as it has been at every prior major cycle inflection point.
Frequently Asked Questions
What is Bitcoin’s Apparent Demand metric?
CryptoQuant’s Apparent Demand (30-day sum) tracks daily block subsidy minus the 1-year inactive supply daily change — measuring whether the Bitcoin market is in net accumulation (positive, green) or net distribution (negative, red) on a 30-day basis. It has been in deeply negative territory since February 2026 and is now approaching zero for the first time in six months.
What happens historically when Apparent Demand flips positive?
Based on historical data, a confirmed positive flip in Apparent Demand has produced a median price gain of +18.1% over the following 60 days with a 78% win rate. When valuations are depressed at the time of the flip — as they currently are — the win rate rises to 87%.
Is Bitcoin currently undervalued?
On-chain metrics and long-term charts suggest that Bitcoin is trading in a region of relatively depressed valuations, where historical risk-reward has often been favorable for long-term holders.
The opinions and market insights shared on CoinsProbe represent the views of individual authors based on prevailing market conditions at the time of publication. Cryptocurrency investments carry significant risk and volatility. Readers are encouraged to conduct their own research and seek professional financial advice before making investment decisions. CoinsProbe and its contributors do not accept responsibility for financial losses or decisions made based on published content.
CoinsProbe may publish sponsored articles, affiliate links, or promotional collaborations. All sponsored material is clearly labeled to maintain transparency with our audience. Our editorial decisions remain fully independent, and advertising partnerships do not influence reviews, rankings, or published opinions.
Since 2023, CoinsProbe has delivered reliable insights on cryptocurrency, blockchain, and digital assets. Our content is created by experienced researchers and analysts who follow strict editorial standards focused on accuracy, transparency, and credibility. Every article is carefully reviewed and verified using trusted sources and current market data. We provide unbiased analysis and timely updates covering everything from emerging crypto projects to major industry developments.