

- ETH is trading near $1,917–$1,920 as of August 10, 2026, with a market cap of $231.39 billion — up 3.73% in 7 days and 6.83% over 30 days.
- Analyst Ali Charts (@alicharts) highlights a rare dual monthly TD Sequential buy signal — a black 9 and an S13 — on Ethereum's monthly chart.
- Every TD Sequential signal on ETH's monthly chart over the past four years has accurately called a major trend shift, with prior buy signals preceding advances of +236% and +258%.
- Analyst James Easton (@JamesEastonUK) describes ETH's long-term chart as "PRIMED" with a "disgusting setup" — mirroring the base structure seen before the 2020–2021 bull market.
- If the dual signals play out as historical precedents suggest, Ali Charts identifies $3,000 as the potential rally target.
- The $1,900 zone is the critical support level that must hold to keep the macro bullish thesis intact.
Ethereum has spent much of 2026 under pressure — declining significantly from its 2025 highs in a prolonged corrective phase that has tested even long-term holders. But the technical picture is beginning to shift in a way that two independent analysts — working from different frameworks on different timeframes — are both flagging as historically significant.
At the time of writing, ETH is trading at approximately $1,917–$1,920 with a market capitalization of $231.39 billion. The token has posted modest but constructive gains of 3.73% over 7 days and 6.83% over 30 days — early signs of stabilization after the extended decline.

What has analysts paying attention is not the recent price action in isolation, but what the higher-timeframe charts are now showing beneath it — a confluence of signals that, historically, have marked the beginning of Ethereum’s most powerful bull runs.
Signal 1 — Dual Monthly TD Sequential Buy Signals
The first and most historically compelling signal comes from crypto analyst Ali Charts (@alicharts), who recently highlighted a rare development on Ethereum’s monthly chart: the Tom DeMark (TD) Sequential indicator has simultaneously flashed two buy signals — a black 9 and an S13.
Monthly TD Sequential signals are qualitatively different from shorter-timeframe readings. They reflect exhaustion of the dominant trend on a macro level — not short-term noise or intraday positioning — which is why they carry disproportionate analytical weight when they appear.
The dual signal configuration (black 9 + S13 together) is rarer still, and the historical track record of TD Sequential signals specifically on Ethereum’s monthly chart makes the current development particularly significant.
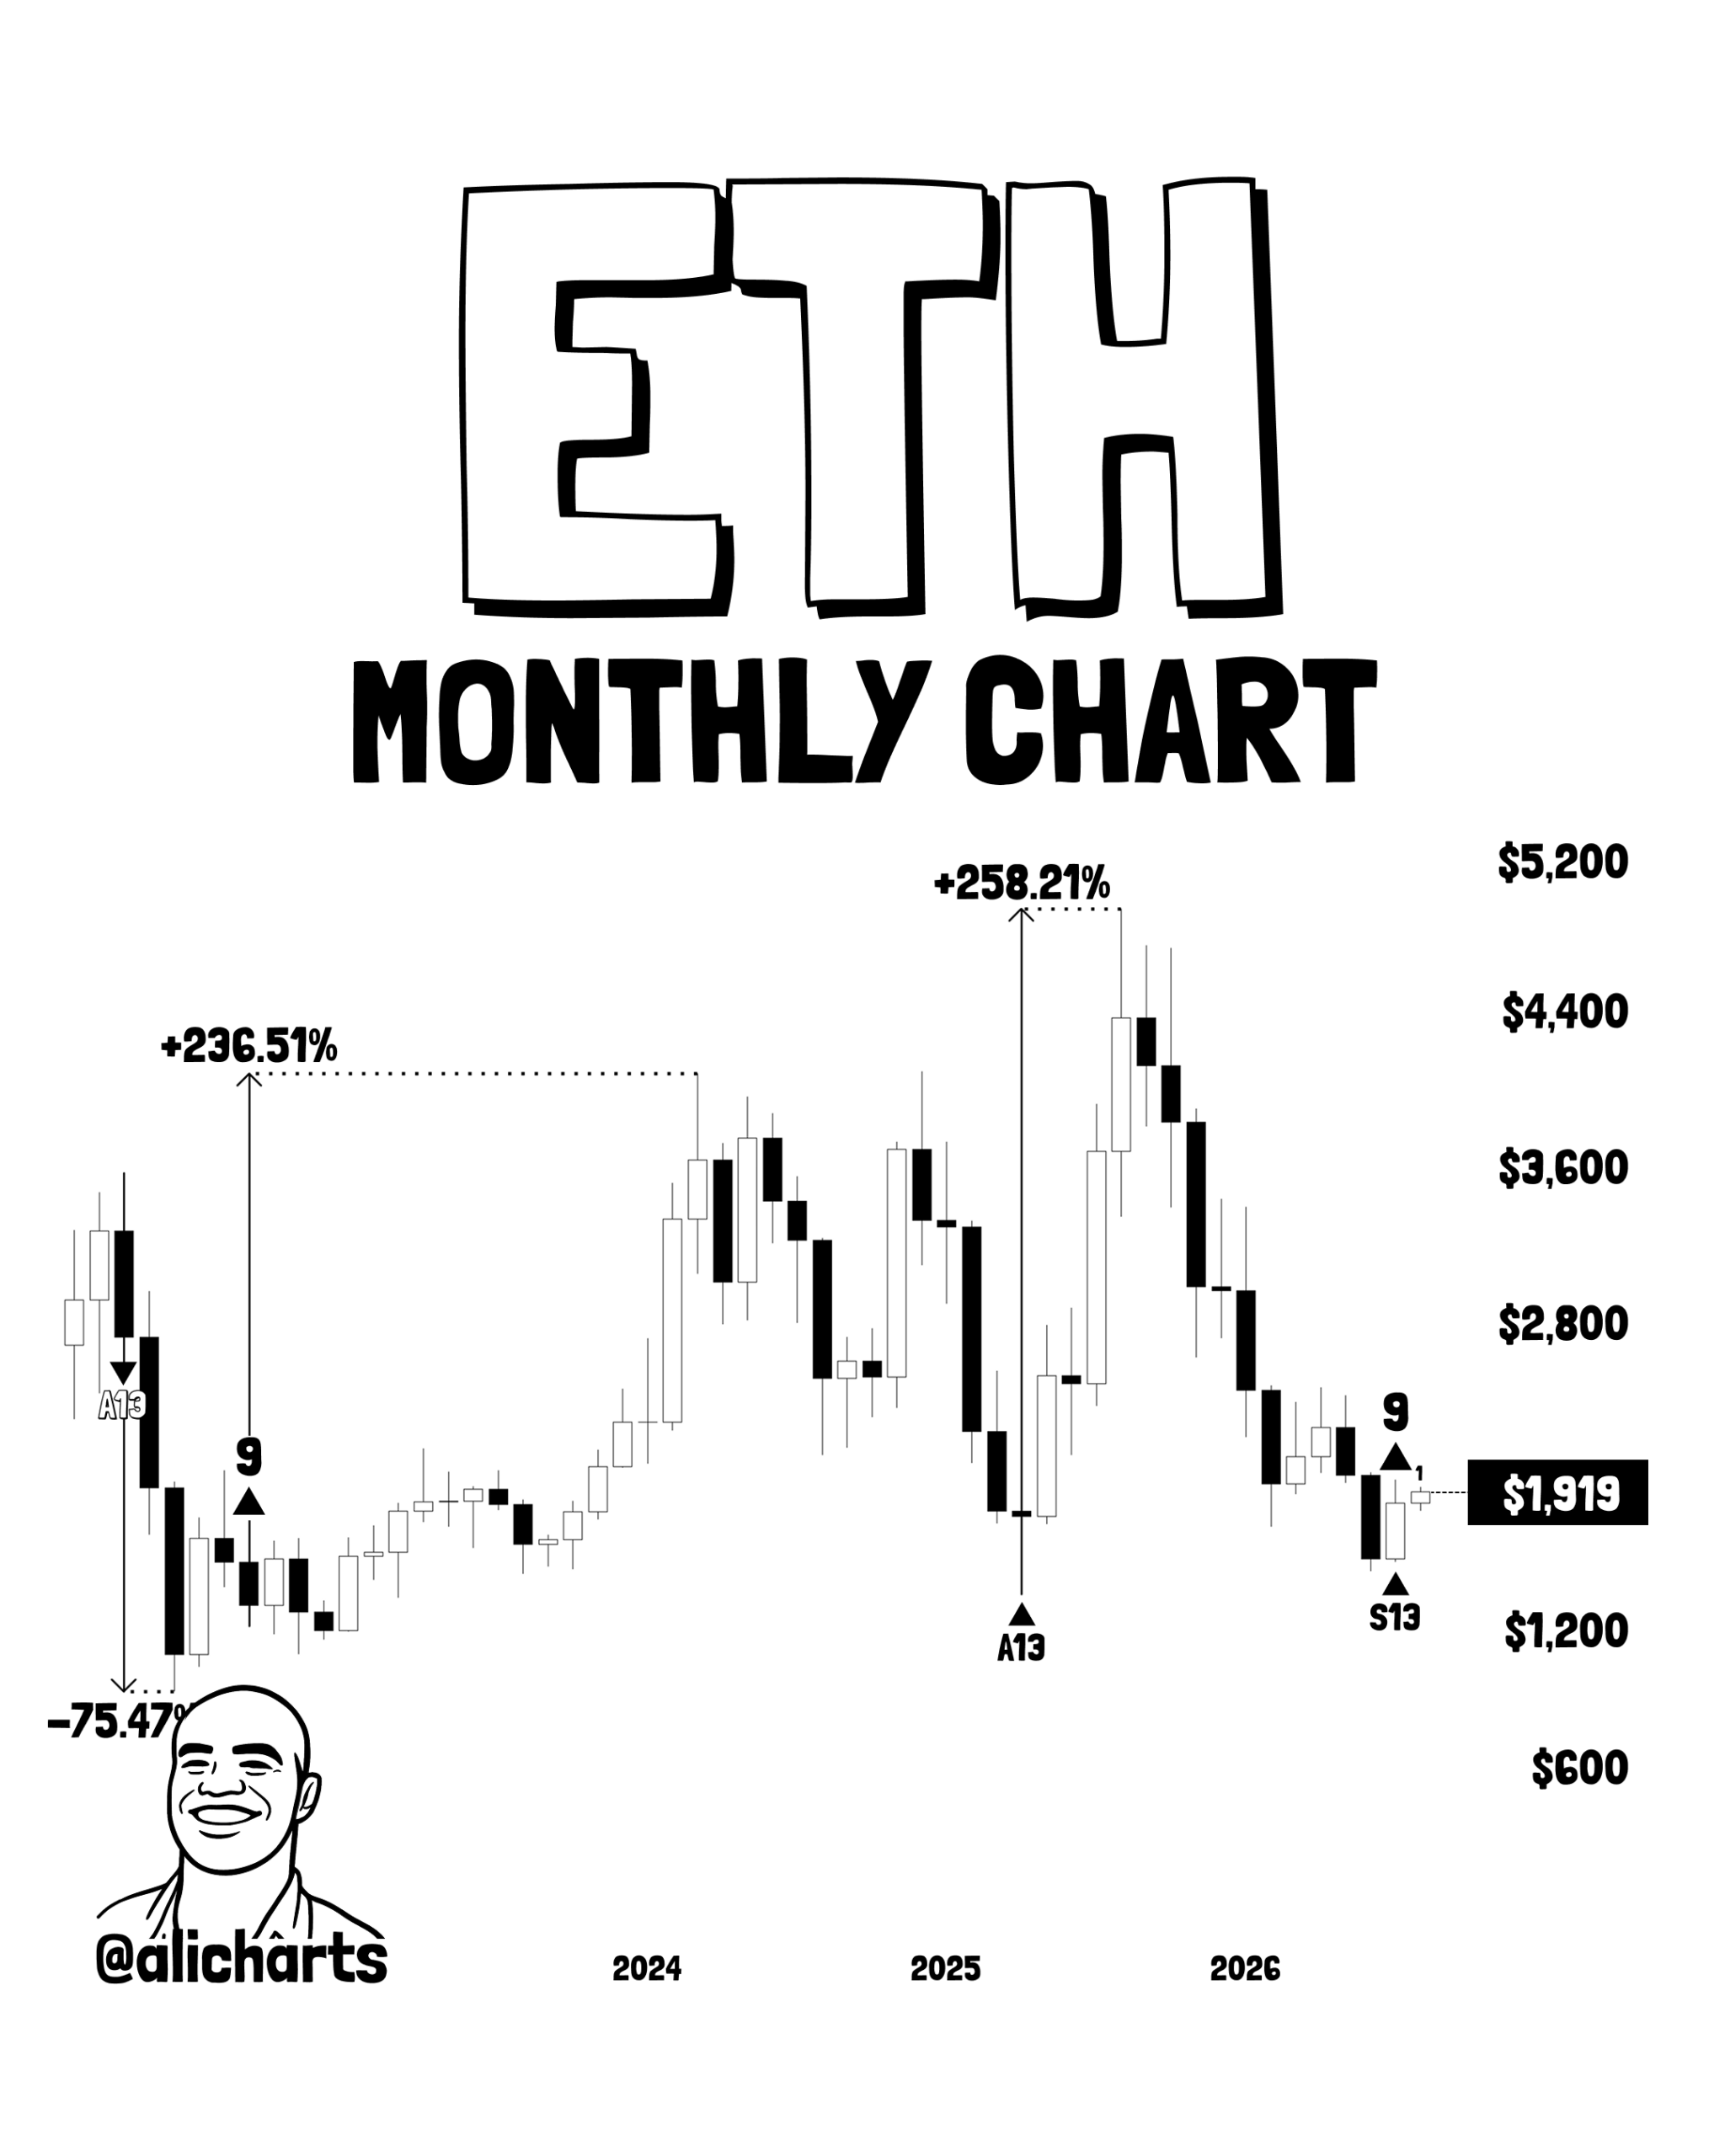
ETH Monthly TD Sequential — Full Track Record
| Date | Signal | Outcome |
|---|---|---|
| April 2022 | A13 Sell Signal | Preceded a -75% decline |
| September 2022 | Black 9 Buy Signal | Followed by a +236% rally |
| April 2025 | A13 Buy Signal | Led to a +258% advance |
| July 2026 | Black 9 + S13 Buy Signals | Current — target ~$3,000 |
Every single TD Sequential signal on ETH’s monthly chart over the past four years has accurately identified a major trend inflection point — both on the sell side (the April 2022 signal that called the -75% decline) and the buy side (the signals that preceded +236% and +258% advances). The indicator’s track record on this specific chart, on this specific timeframe, is one of the cleanest in the current analytical landscape.
As covered in our ETH monthly TD Sequential buy signal analysis at $1,700, the TD Sequential framework has been building a bullish case for Ethereum across multiple timeframes through 2026. The dual signal now visible on the monthly chart represents the most significant expression of that framework yet.
If the current dual buy signal plays out in line with historical precedents, Ali Charts identifies $3,000 as the potential rally target — a level that would represent approximately +56% upside from current prices near $1,920.
Signal 2 — Long-Term Chart Shows ETH Is “PRIMED”
Working from an entirely different analytical framework and a longer timeframe, analyst James Easton (@JamesEastonUK) has described Ethereum’s current chart structure in terms that are difficult to overlook:
“PRIMED. Disgusting setup.”
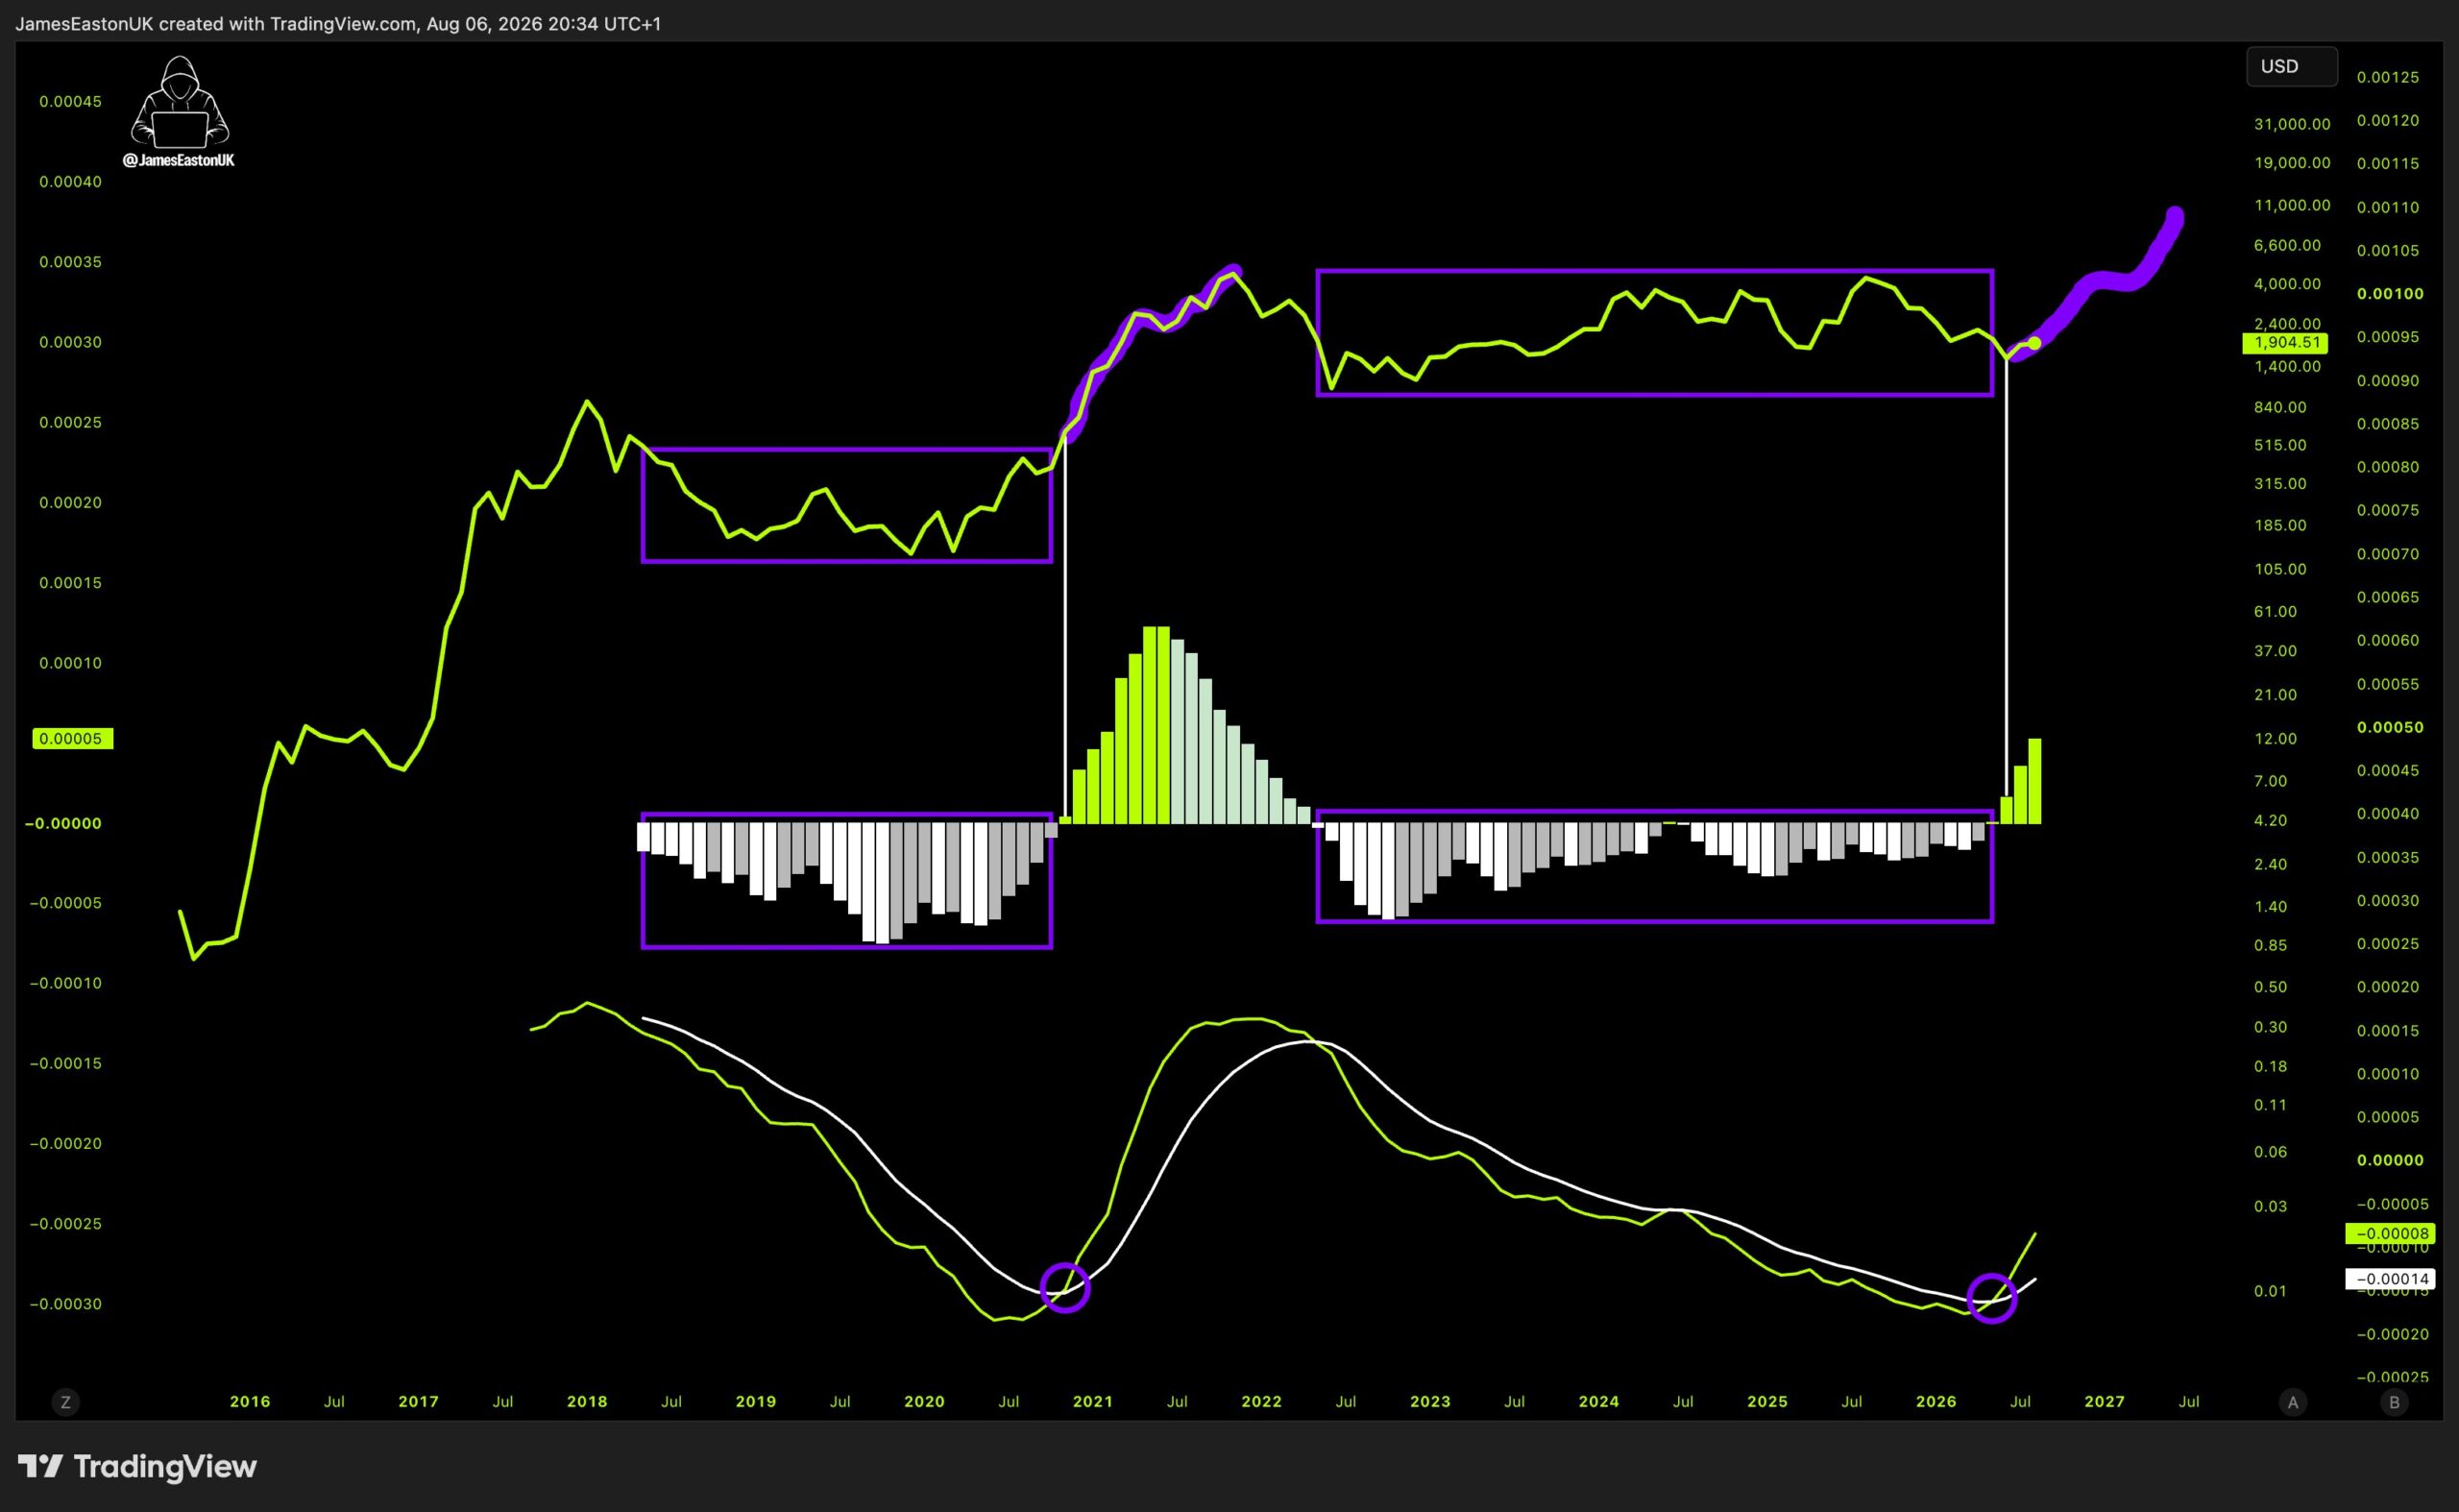
Easton’s long-term chart maps Ethereum’s multi-year cycles using a momentum oscillator and accumulation boxes — a visual framework that identifies extended periods of sideways consolidation and oscillator bottoms as the precursors to major expansion phases.
What the Chart Shows
The most relevant historical comparison on Easton’s chart is the base-building phase that developed in 2019–2020 — a prolonged period of sideways consolidation during which the oscillator bottomed and price compressed into a clearly defined accumulation range before the explosive 2020–2021 bull market run.
The 2026 structure on the same chart is displaying what Easton describes as a nearly identical formation:
- Extended sideways consolidation — price has been compressing near the $1,900 level following the corrective phase from 2025 highs
- Oscillator bottoming — the momentum oscillator is showing signs of bottoming from extended oversold territory, mirroring the 2019–2020 pattern
- Accumulation range forming — price is beginning to lift from the recent base near $1,900, suggesting the corrective phase may be maturing into a higher-timeframe accumulation zone
As documented in our ETH rebound from the critical $1,580 level analysis, Ethereum’s recovery from its 2026 lows has been building structural support at progressively higher levels — a pattern consistent with the early stages of the accumulation phase Easton’s chart is identifying.
The significance of the “disgusting setup” characterization is context: Easton is describing a chart where multiple long-term cycle indicators are aligning simultaneously at a level where, historically, the asymmetry between upside potential and downside risk has been most favorable.
Why Two Independent Signals on Two Different Timeframes Matter
The most important element of the current ETH setup is not either signal in isolation — it is their simultaneous convergence from independent frameworks.
Ali Charts is using the TD Sequential — a mathematically defined indicator that counts price bars and identifies trend exhaustion without subjective interpretation. James Easton is using a visual multi-year cycle framework with a momentum oscillator and accumulation mapping. They are not the same tool, they are not the same timeframe, and they are not the same analyst.
Both are pointing to the same conclusion at the same time: Ethereum is at or near a macro inflection point.
As covered in our Bitcoin macro bottom signals analysis, the convergence of independent frameworks on a single conclusion is one of the most analytically robust patterns in technical research — because it eliminates the risk of a single-methodology false signal driving a flawed conclusion. When two analysts using different tools on different timeframes arrive at the same setup simultaneously, the probability weighting toward that outcome increases meaningfully.
Key Levels to Watch
$1,900 — The Line That Must Hold
The immediate priority for the ETH bull thesis is a sustained hold above the $1,900 zone. This level has served as the base of the current accumulation range and the floor from which the recent stabilization has developed. A daily or weekly close below $1,900 would weaken the accumulation narrative and put lower support levels back in focus — potentially requiring a deeper retest before the macro signals can resolve bullishly.
$3,000 — The TD Sequential Target
If the dual monthly TD Sequential buy signals play out in line with the +236% and +258% advances that followed the September 2022 and April 2025 signals respectively, $3,000 emerges as the primary longer-term technical objective. From the current price of approximately $1,920, reaching $3,000 would represent approximately +56% upside — a meaningful move, but considerably more modest than the prior TD Sequential-driven advances on the same chart.
Bullish vs. Bearish Scenarios
Bullish Scenario
ETH holds the $1,900 support zone on a sustained basis, continues building the accumulation base that Easton’s long-term chart is identifying, and the dual monthly TD Sequential buy signals (black 9 + S13) validate over the coming months. In this scenario, the historical precedent from the September 2022 and April 2025 buy signals applies — and the path toward $3,000 as the primary target opens. A monthly close decisively above $2,000 would serve as an early confirmation that the expansion phase is beginning.
Bearish Scenario
ETH loses the $1,900 zone on a sustained daily or weekly close, invalidating the current accumulation base structure and weakening the TD Sequential buy signal thesis before confirmation. In this scenario, lower support levels — potentially in the $1,580–$1,650 range — come back into focus, and the macro bottom signals require more time or lower prices to fully resolve. The dual monthly signals would remain valid on the chart but would require a new base-building period before the expansion phase can begin.
Bottom Line
Ethereum is presenting a convergence of macro-level signals that is historically rare and analytically significant. A dual monthly TD Sequential buy signal (black 9 + S13) — from an indicator with a perfect four-year track record on ETH’s monthly chart — is now aligned simultaneously with a long-term cycle chart that analyst James Easton describes as “PRIMED” and displaying the same accumulation structure that preceded the 2020–2021 bull market.
The $1,900 support zone is the immediate line to watch. As long as it holds, both signal frameworks remain intact and the thesis toward $3,000 as the primary target continues to develop. A sustained break below $1,900 would delay — but not necessarily invalidate — the macro bullish case.
For traders and investors watching Ethereum’s next major move, the technical setup heading into late 2026 may be the most constructive the asset has presented since the signals that preceded its last two major advances.
Frequently Asked Questions
Will Ethereum recover in 2026?
ETH is holding near $1,920 after recent gains of 3.73% (7d) and 6.83% (30d). Dual monthly TD Sequential buy signals and a long-term primed setup suggest a potential macro recovery toward $3,000 if the signals are validated.
Is Ethereum a good investment in August 2026?
Ethereum currently shows improved technical conditions with rare dual monthly buy signals and a multi-year accumulation structure. It remains a high-volatility asset suitable mainly for risk-tolerant investors.
What is the next price target for Ethereum?
Analysts highlighting the dual monthly TD Sequential buy signals see $3,000 as a potential longer-term target if the signals play out as they have in previous cycles.
The opinions and market insights shared on CoinsProbe represent the views of individual authors based on prevailing market conditions at the time of publication. Cryptocurrency investments carry significant risk and volatility. Readers are encouraged to conduct their own research and seek professional financial advice before making investment decisions. CoinsProbe and its contributors do not accept responsibility for financial losses or decisions made based on published content.
CoinsProbe may publish sponsored articles, affiliate links, or promotional collaborations. All sponsored material is clearly labeled to maintain transparency with our audience. Our editorial decisions remain fully independent, and advertising partnerships do not influence reviews, rankings, or published opinions.
Since 2023, CoinsProbe has delivered reliable insights on cryptocurrency, blockchain, and digital assets. Our content is created by experienced researchers and analysts who follow strict editorial standards focused on accuracy, transparency, and credibility. Every article is carefully reviewed and verified using trusted sources and current market data. We provide unbiased analysis and timely updates covering everything from emerging crypto projects to major industry developments.