
- HYPE is trading at $59.24, down 10.93% over 7 days and 17.03% over 30 days, as continued whale selling weighs on price.
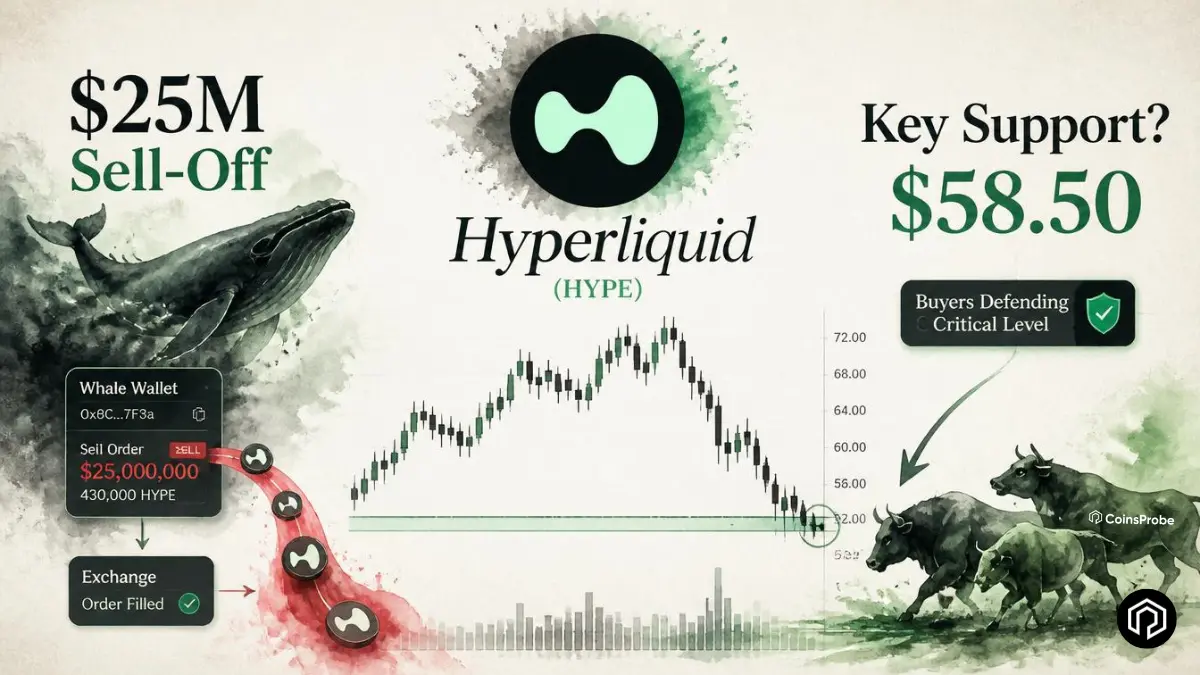
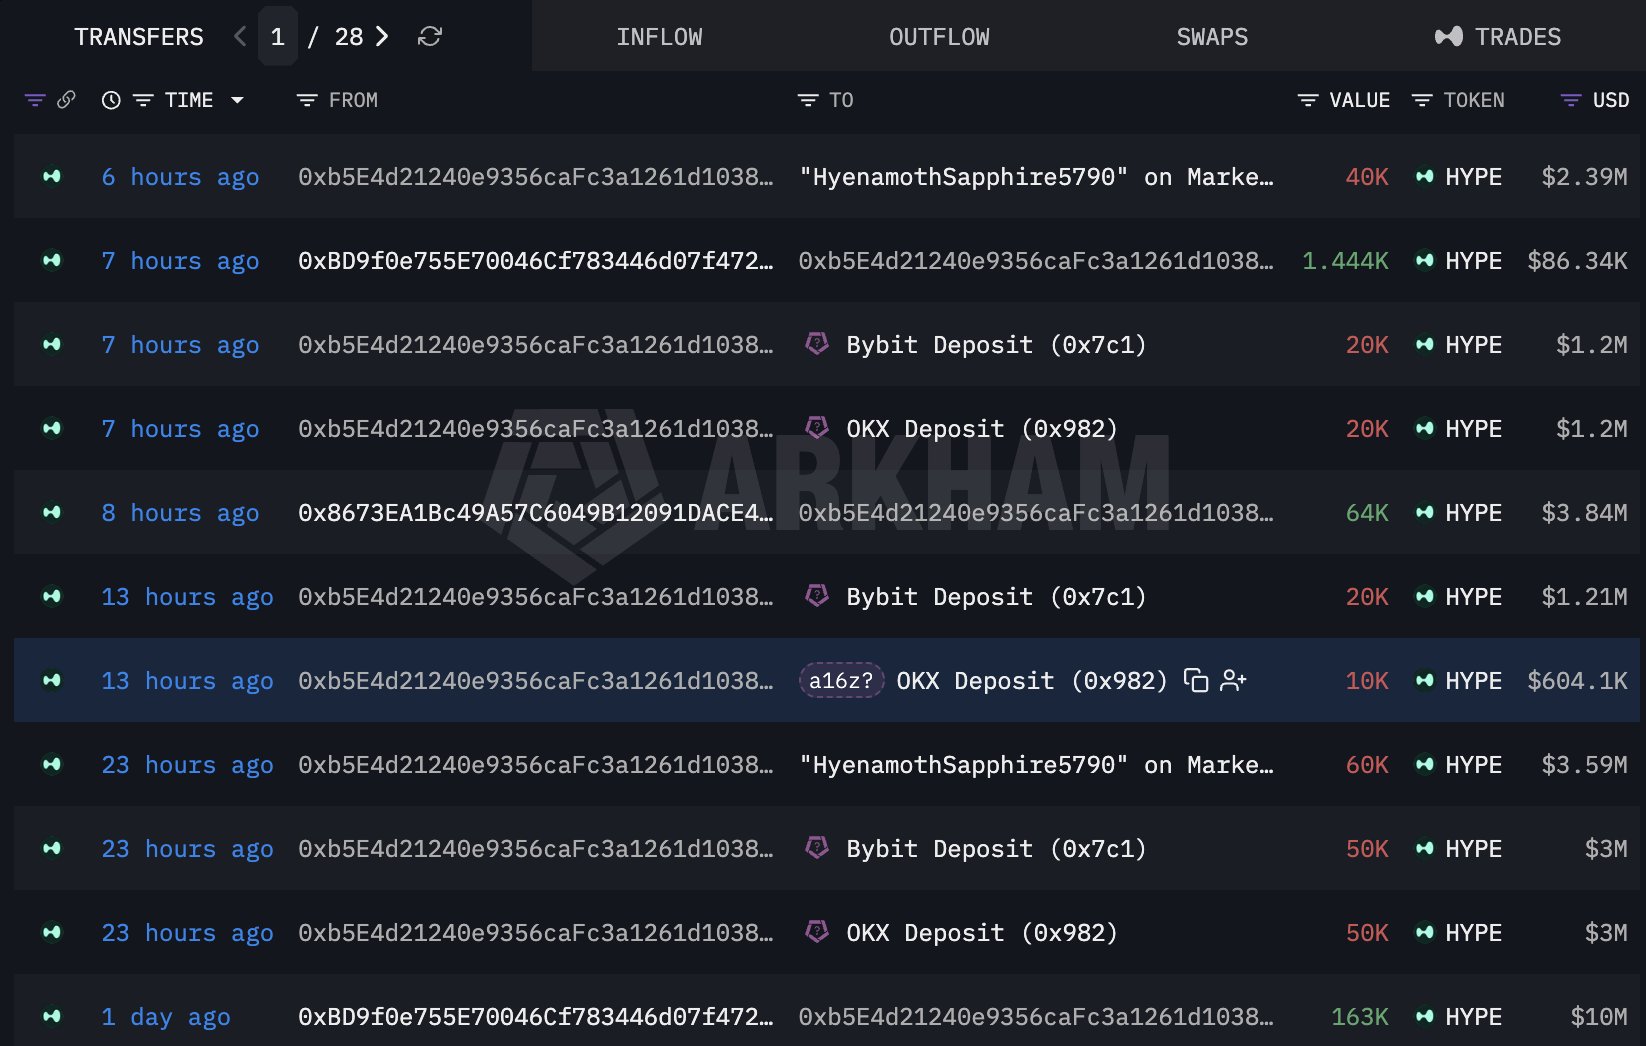
- An a16z-linked whale has sold another 421,796 HYPE (~$25.3M), bringing total two-day sales to over 858,000 HYPE (~$53.7M).
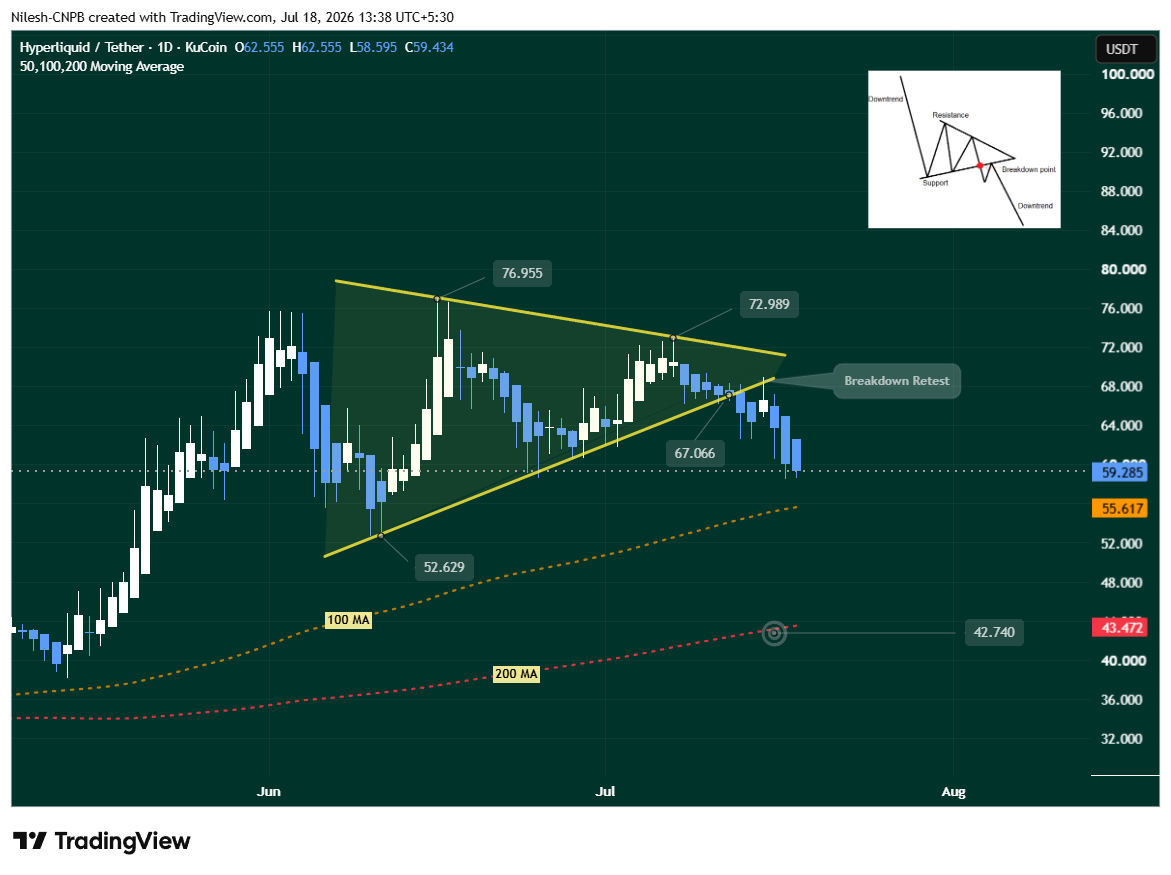
- HYPE remains below its $67.07 triangle breakdown level, with $58.50 as immediate support and the 100 MA at $55.62 as the next key downside level.
- A move above $72.99 would invalidate the bearish setup, while losing $58.50 could open the door to $55.62 and potentially $43.47.
Hyperliquid’s native token $HYPE has been one of the stronger performers in the broader crypto market throughout 2026, but it has entered a corrective phase in recent weeks. As of July 18, 2026, HYPE trades at $59.24, showing a modest +0.36% gain in the last 24 hours. However, it remains down 10.93% over the past 7 days and 17.03% over the past 30 days, with a market capitalization of approximately $14.998 billion.

The primary driver remains the same one we identified in our Why HYPE Drops Today article: the a16z-linked whale that began distributing its HYPE position earlier this week has not slowed down.
Yesterday’s $28.38M distribution has been followed by another $25.3M sale in the past 24 hours — bringing the total known distribution from this single wallet to over $53.68M in approximately two days.
The a16z-Linked Whale — Cumulative Distribution Now Exceeds $53M
Lookonchain has confirmed the continued selling activity:
| Distribution Event | HYPE Amount | Dollar Value |
|---|---|---|
| Prior 2-day distribution | 437,000 HYPE | ~$28.38M |
| Last 24 hours | 421,796 HYPE | ~$25.3M |
| Total known distribution | ~858,796 HYPE | ~$53.68M |
The exchanges receiving these deposits remain consistent — Hyperliquid, OKX, Bybit, and Gate.io — suggesting a deliberate strategy of spreading the distribution across multiple venues to minimise the market impact on any single order book while maintaining a consistent pace of selling.
Why the sustained pace matters:
A single large sell event — even at $28.38M — can be absorbed by a market over time as buyers step in at lower prices. A second consecutive day of comparable scale selling ($25.3M) signals that this is not a one-time position reduction but a sustained, deliberate distribution campaign. Markets interpret continued selling from a well-known institutional-linked wallet differently from a one-off event: it signals that the seller is not responding to short-term price movements but executing to a plan.
For HYPE’s price action, the implication is that the supply overhang from this specific wallet will continue to cap recovery attempts until the distribution is complete — the market cannot easily price in how much remains to be sold, which itself becomes a reason for caution among potential buyers.
Technical Analysis — Where HYPE Stands After the Breakdown
As we covered in detail in our Why HYPE Drops article — HYPE confirmed a symmetrical triangle breakdown below the $67.066 level earlier this week. The update as of July 18 shows the pattern has continued to develop as expected:
Breakdown retest confirmed as resistance:
Following the initial breakdown below $67.066, price attempted a retest of the broken trendline — the standard technical behaviour where former support is tested as new resistance. That retest has now conclusively held as resistance, confirming the breakdown is genuine rather than a false move. This is the most important technical update since the original breakdown — it removes the possibility of a quick recovery back above the breakdown level without a significant shift in market dynamics.
Current price position:
HYPE is hovering just above the $58.50 immediate support area following the retest — a level that has provided near-term stability but has not yet been decisively defended with buying conviction.
The moving average structure:
| Moving Average | Level | Significance |
|---|---|---|
| 100-day MA | $55.617 | Next critical support below $58.50 |
| 200-day MA | $43.74 | Measured move target / deeper support |
HYPE remains above the 100 MA at $55.617 — an important distinction that keeps the technical picture from being entirely bearish. The 100 MA has historically provided meaningful support during corrective phases, and its defence would be a positive signal that the current correction is not developing into a more significant structural decline.
Bullish Scenario — Reclaim of $72.99
A sustained daily close above $72.99 would invalidate the symmetrical triangle breakdown structure entirely — suggesting the correction has fully absorbed the whale distribution selling and new buying demand is driving a genuine recovery. This scenario would open the path back toward previous highs and potentially new all-time highs if the broader market environment cooperates.
For this scenario to become realistic in the near term, the a16z-linked whale distribution would need to slow or complete, and a new demand catalyst would likely be needed to generate sufficient buying interest to push through the confirmed $67.066 resistance and the $72.99 invalidation level above it.
Bearish Scenario — Loss of $58.50 and $55.617
If HYPE fails to hold the $58.50 immediate support — particularly with continued whale selling adding consistent supply pressure — the next test becomes the 100 MA at $55.617. A loss of the 100 MA on a sustained closing basis would represent a meaningful technical deterioration and increase the probability of the measured move completing toward the 200 MA at $42.74.
From the current price of $59.24, reaching the $42.74 target would represent approximately -28% additional downside — a move that would bring HYPE’s total correction from its recent highs to a scale comparable to the corrective phases seen in other 2026 outperformers during their mid-cycle pullbacks.
Context — What Has Not Changed
It is worth maintaining perspective on what the current correction does and does not represent. HYPE remains +132.49% year-to-date — one of the strongest performances among large-cap crypto assets in 2026. The protocol’s fundamental metrics — trading volume, open interest, fee revenue, and the AQAv2 USDC yield mechanism — have not deteriorated as a result of the whale selling or the technical breakdown.
What has changed is the near-term supply-demand balance: a large, institutional-linked holder is selling a substantial position, creating persistent sell-side pressure that the current level of buying demand has not been sufficient to fully absorb. This is a temporary supply event rather than a fundamental shift — but temporary supply events can produce significant price corrections, particularly when they coincide with a technically confirmed breakdown as they have here.
Bottom Line
HYPE’s corrective phase is continuing into its second week — with the a16z-linked whale’s distribution now totalling over $53.68M across approximately two days of selling, the symmetrical triangle breakdown retest confirmed as resistance, and the token hovering just above the $58.50 immediate support that separates the current zone from the 100 MA at $55.617.
The two variables that will determine direction from here: whether the whale distribution slows or completes — removing the primary supply overhang — and whether $58.50 holds with genuine buying conviction or gives way to a test of the 100 MA below. Until the distribution pace changes, the path of least resistance remains toward the downside targets unless a new demand catalyst emerges.
For holders with a longer time horizon — the question of whether HYPE can still reach $100 remains open. A +132.49% YTD performance, a protocol with genuine fee revenue, and a USDC yield mechanism that activates in August all provide fundamental reasons for conviction through the current correction — but the near-term path requires $58.50 to hold first.
Frequently Asked Questions (FAQ)
Who exactly is the a16z-linked whale?
The term “a16z-linked whale” refers to one or more wallets that on-chain analysts (primarily Lookonchain and Arkham Intelligence) have associated with Andreessen Horowitz (a16z) — the prominent Silicon Valley venture capital firm with a major crypto investment arm (a16z Crypto).
The opinions and market insights shared on CoinsProbe represent the views of individual authors based on prevailing market conditions at the time of publication. Cryptocurrency investments carry significant risk and volatility. Readers are encouraged to conduct their own research and seek professional financial advice before making investment decisions. CoinsProbe and its contributors do not accept responsibility for financial losses or decisions made based on published content.
CoinsProbe may publish sponsored articles, affiliate links, or promotional collaborations. All sponsored material is clearly labeled to maintain transparency with our audience. Our editorial decisions remain fully independent, and advertising partnerships do not influence reviews, rankings, or published opinions.
Since 2023, CoinsProbe has delivered reliable insights on cryptocurrency, blockchain, and digital assets. Our content is created by experienced researchers and analysts who follow strict editorial standards focused on accuracy, transparency, and credibility. Every article is carefully reviewed and verified using trusted sources and current market data. We provide unbiased analysis and timely updates covering everything from emerging crypto projects to major industry developments.