
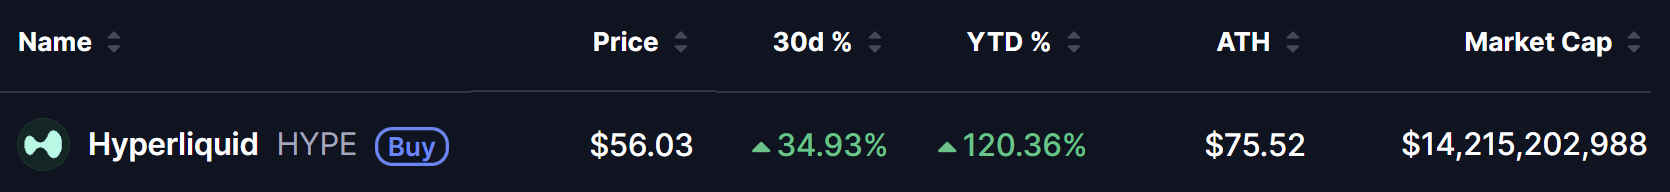
- HYPE is trading at $56.03 — up +120.36% year-to-date — with a market cap of $14.215 billion and an ATH of $75.52. Reaching $100 requires approximately +78.5% upside from current levels.
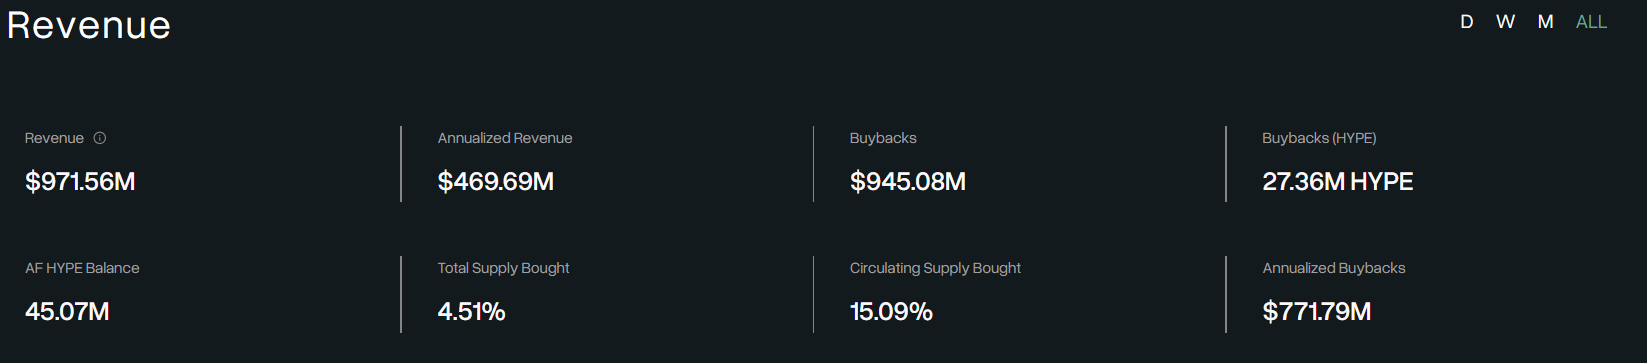
- The buyback engine has now removed $945.08M from circulation — buying back 27.36M HYPE (15.09% of circulating supply) — with annualised buybacks running at $771.79M per year.
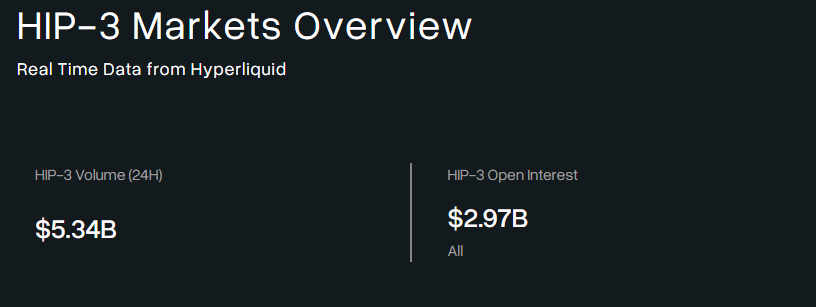
- Cumulative ETF inflows have reached $151.21M across three products with zero weeks of net outflows — and HIP-3 open interest has hit a new record of $2.97B with $5.34B in 24-hour volume.
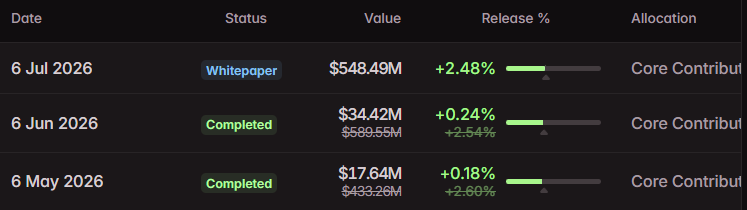
- The biggest near-term risk: a $548.49M core contributor unlock on July 6 — the largest single unlock in HYPE's history — arriving in just 26 days.
We fed Claude AI all the essential live data — and asked for an honest, math-based assessment. Here is what it found.
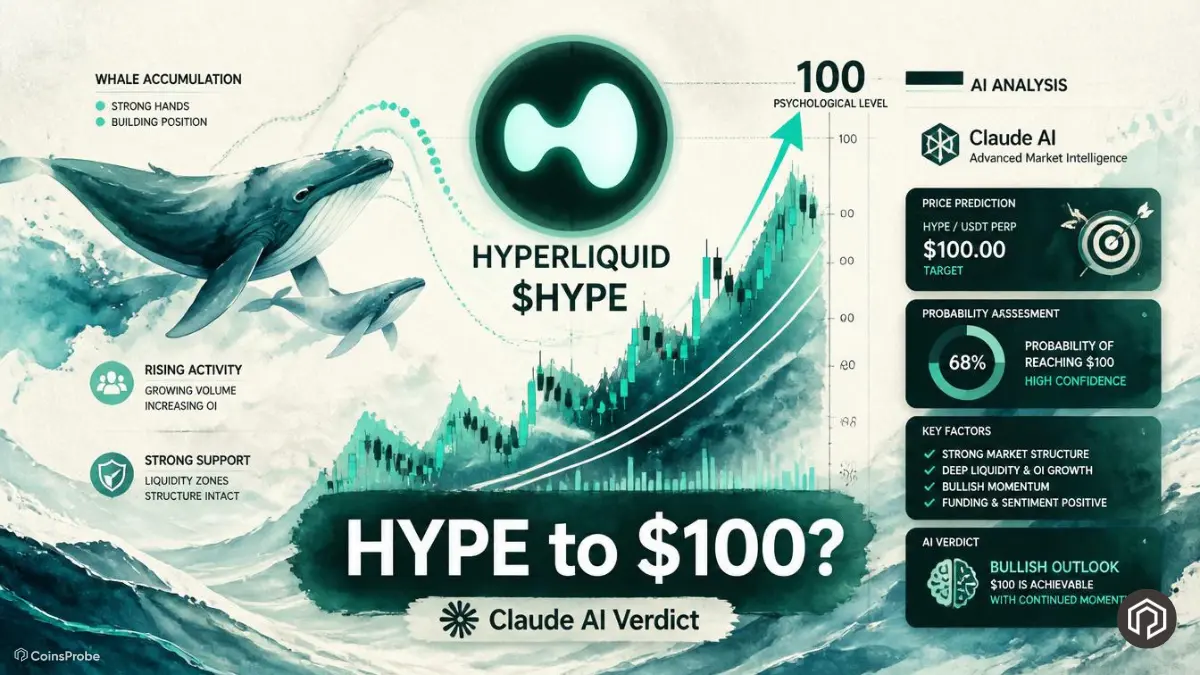
The Question — Will HYPE Reach $100?
Every week someone asks whether HYPE will reach $100. Every week the answers split predictably: bulls cite the buyback engine and ETF demand, bears cite unlocks and regulatory risk. Both camps are partially right — and both are missing the full picture.
The honest way to answer this question is not with conviction — it is with arithmetic. What does $100 actually mean in market cap terms? What does the buyback engine need to deliver? What do the ETF inflows need to sustain? And what does the July 6 unlock actually represent as a supply shock?
We fed Claude AI the live data from the images above and asked it to run the numbers. Here is what the math says.
Where HYPE Stands Today
The Math — What $100 Actually Means
This is where most $100 price predictions skip the most important step. Here is what $100 per HYPE actually implies:
Market cap at $100: 253.66M circulating × $100 = $25.37 billion
Fully Diluted Valuation (FDV) at $100: 1,000,000,000 total supply × $100 = $100 billion
Now compare that to the real-world financial exchanges that Hyperliquid is competing with — and that the ICE CEO publicly acknowledged when he called Hyperliquid “bigger than NASDAQ”:
| Exchange | Current Market Cap |
|---|---|
| CME Group | ~$93.4 billion |
| ICE (NYSE parent) | ~$82–91 billion |
| Coinbase | ~$42.8 billion |
| HYPE at $100 (circulating) | $25.37 billion |
| HYPE at $100 (FDV) | $100 billion |
The circulating market cap at $100 — $25.37 billion — is actually below CME Group, ICE, and significantly below the FDV. The circulating market cap comparison is not unreasonable for a protocol generating $469.69M in annualised revenue with $5.34B in daily HIP-3 volume. The FDV comparison at $100B is the more concerning number — and the one that requires the most scrutiny.
The Bull Case — Three Structural Engines
Engine 1 — The Buyback Machine
The numbers from the ASXN data above are the most important fundamental fact about HYPE:
| Buyback Metric | Data |
|---|---|
| Total Revenue | $971.56M |
| Cumulative Buybacks | $945.08M |
| HYPE Bought Back | 27.36M HYPE |
| % of Circulating Supply | 15.09% |
| Annualised Buybacks | $771.79M |
| AF HYPE Balance | 45.07M |
Hyperliquid has already removed 15.09% of circulating supply through buybacks — permanently. At the annualised rate of $771.79M in buybacks — the protocol is removing approximately $64.3M per month from circulation at current prices. As the price rises toward $100 — the dollar value of buybacks grows with it, creating an accelerating removal dynamic.
The daily buyback data shows the engine running consistently — from $1.64M on June 6 to $4.63M on June 5 — averaging approximately $2.5M per day in the most recent window. That is real, continuous demand created by protocol revenue regardless of what any individual investor decides to buy or sell.
Engine 2 — ETF Demand With Zero Outflow Weeks
The ETF data from SoSoValue confirms the institutional demand picture:
| ETF | Sponsor | Net Assets | Fee |
|---|---|---|---|
| BHYP | Bitwise (NYSE) | $89.29M | 0.34% |
| THYP | 21Shares (Nasdaq) | $60.20M | 0.30% |
| HYPG | Grayscale (Nasdaq) | $5.37M | 0.29% |
| Total | — | $163.29M | — |
Weekly inflow history:
- Week of May 22: +$72.38M — largest single week
- Week of May 29: +$57.19M
- Week of Jun 5: +$16.65M
- Week of Jun 9: +$2.47M
Cumulative: $151.21M. Zero weeks of net outflows.
As we covered in our HYPE ETF strongest debut analysis, this debut absorbed market cap at a faster rate than Bitcoin, Ethereum, or Solana ETFs at equivalent stages. The recent moderation in weekly inflows — from $72M to $2.47M — reflects the broader crypto market weakness rather than institutional demand reversing. The zero-outflow streak through market volatility is the signal that matters most.

Engine 3 — HIP-3 Revenue Growing
HIP-3 has just set a new open interest record:
- HIP-3 24h Volume: $5.34B
- HIP-3 Open Interest: $2.97B (new ATH)
Every dollar of HIP-3 volume generates fee revenue — which flows directly into the buyback engine. As HIP-3 OI and volume grow — the buyback rate accelerates. As we covered in our HIP-4 prediction markets article, an entirely new revenue stream is being added on top of the existing perpetuals income — compounding the fee generation further.
The Institutional Stack Supporting $100
Beyond the protocol mechanics — the institutional validation around HYPE is unlike any other DeFi asset:
- Goldman Sachs — holds a HYPE position as covered in our Goldman Sachs article
- Bitwise — staking 6M+ HYPE as covered in our Bitwise staking article
- ICE CEO — publicly called Hyperliquid “bigger than NASDAQ”
- Arthur Hayes — called $150 as his HYPE target — and bought back in at $61 after selling at $73 as covered in our Hayes buyback article
Hayes’ $150 target remains public and active — making $100 a milestone rather than a ceiling in his framework. His sell-and-rebuy sequence actually reinforces the thesis: he sold at $73 for macro reasons, watched the price dip, and re-entered at $61 — suggesting he views anything below $73 as undervalued relative to his long-term target.
The Bear Case — What Could Stop $100
Risk 1 — The July 6 Unlock: $548.49M
This is the most significant near-term risk — and it is 26 days away.
| Unlock | Date | Status | Value | Release % |
|---|---|---|---|---|
| Core Contributors | May 6 | Completed | $17.64M | +0.18% |
| Core Contributors | Jun 6 | Completed | $34.42M | +0.24% |
| Core Contributors | Jul 6 | Upcoming | $548.49M | +2.48% |
The July 6 unlock is 10x larger than the June unlock and 31x larger than the May unlock. At current prices, $548.49M represents a potential supply shock that is significantly larger than any prior unlock event. As we covered in our $230M unlock day analysis, even $230M in unlocks created significant price pressure. $548.49M is in a different category entirely.
The critical question: will the core contributors sell? The June 6 unlock of $34.42M caused limited market disruption — partially because many wallets moved to OTC or staking rather than direct selling. But at $548.49M — even partial selling would represent meaningful supply pressure that the current $2.47M weekly ETF inflow pace cannot absorb alone.
Risk 2 — Volume Dependency
The entire buyback engine runs on trading volume. If HIP-3 volume contracts — fee revenue falls — buybacks slow — and the mechanical demand floor weakens. In a sustained crypto bear market, derivatives volume typically contracts with price — creating a negative feedback loop where lower prices generate less fee revenue, which means less buyback support.
Risk 3 — Regulatory Pressure
As we covered in our CME/NYSE lobbying article, traditional exchanges are actively lobbying against Hyperliquid. The CME CEO has recently warned of risk created by approval of crypto perpetuals — a direct reference to Hyperliquid’s HIP-3 framework. Adverse regulatory action would be a structural threat regardless of how strong the protocol fundamentals are. CNBC
Risk 4 — Macro Environment
HYPE has shown remarkable resilience — printing ATHs during Bitcoin crashes — but it is not immune to a sustained macro deterioration. The current Bitcoin environment — down -28.90% YTD and under CPI pressure — is not the ideal backdrop for new ATH attempts.
Three Scenarios
Bull Scenario — $100 by Q3 2026
July 6 unlock wallets predominantly stake or OTC rather than market sell. ETF inflows recover to $10M+ weekly as crypto market stabilises. HIP-3 OI reaches $4B+ driving buyback acceleration. Bitcoin recovers above $80K removing macro headwind.
At these conditions — the $25.37B circulating market cap implied by $100 is achievable and comparable to established exchange valuations.
Base Scenario — $75–$85 in 2026
July 6 unlock creates temporary selling pressure that pushes HYPE back toward $45–$55 before recovering. ETF inflows continue at reduced pace. Buyback engine absorbs the worst of the unlock selling. HYPE retests but does not exceed the $75.52 ATH in 2026 — setting up a stronger run in 2027 as unlock pressure reduces.
Bear Scenario — Extended consolidation below $60
July 6 unlock sellers aggressively market sell. Bitcoin CPI data disappoints and macro remains hostile. ETF inflows stall. The combination of supply pressure and reduced buyback capacity from lower volume keeps HYPE range-bound below $60 through Q3 2026.
Claude AI’s Honest Verdict
After running all the numbers — here is the balanced conclusion:
Can HYPE reach $100? Yes — the structural case is genuinely compelling. The $25.37B circulating market cap at $100 is not unreasonable for a protocol with $469.69M in annualised revenue, $2.97B in open interest, a $945M buyback engine that has already removed 15% of circulating supply, and three institutional ETFs with zero outflow weeks.
Will it happen on its own timeline? The July 6 unlock changes everything in the short term. A $548.49M supply event arriving in 26 days is the single most important variable between current prices and $100. If that unlock is absorbed without catastrophic selling — the path to $100 in 2026 remains open. If it triggers a major sell-off — the $100 target becomes a 2027 story.
The honest bottom line: $100 HYPE is backed by better fundamental infrastructure than almost any other token in crypto. The buyback engine is real. The ETF demand is real. The institutional validation is real. But the July 6 unlock is also real — and it is the event that will either prove the demand floor is deep enough — or reset the timeline for the next ATH attempt.
Watch July 6. That date matters more than any price level right now.
Frequently Asked Questions (FAQ)
What does $100 HYPE actually mean in market cap terms?
At $100 — HYPE’s circulating market cap would be approximately $25.37 billion — below CME Group (~$93B) and ICE (~$82B) — making it a comparable but not unreasonable valuation for a protocol generating $469M in annualised revenue.
How much has the HYPE buyback engine removed?
$945.08M in cumulative buybacks — removing 27.36M HYPE (15.09% of circulating supply) — with annualised buybacks running at $771.79M per year.
What is the biggest risk to $100 HYPE?
The $548.49M core contributor unlock on July 6, 2026 — 10x larger than the June unlock — arriving in 26 days. Whether those wallets sell aggressively or hold/stake will largely determine HYPE’s near-term price direction.
What do the HYPE ETF inflows show?
Cumulative inflows of $151.21M across three ETFs with zero weeks of net outflows since launch — the strongest ETF debut relative to market cap of any spot crypto ETF in history.
Does Arthur Hayes still target $150?
Yes — Hayes publicly called $150 as his HYPE target and demonstrated conviction by buying back 33,978 HYPE at $61 just four days after selling at $73.
What is Claude AI’s honest verdict on $100?
Possible — but dependent on the July 6 unlock being absorbed without catastrophic selling. The fundamental infrastructure supports $100. The near-term supply event is the deciding variable.
The opinions and market insights shared on CoinsProbe represent the views of individual authors based on prevailing market conditions at the time of publication. Cryptocurrency investments carry significant risk and volatility. Readers are encouraged to conduct their own research and seek professional financial advice before making investment decisions. CoinsProbe and its contributors do not accept responsibility for financial losses or decisions made based on published content.
CoinsProbe may publish sponsored articles, affiliate links, or promotional collaborations. All sponsored material is clearly labeled to maintain transparency with our audience. Our editorial decisions remain fully independent, and advertising partnerships do not influence reviews, rankings, or published opinions.
Since 2023, CoinsProbe has delivered reliable insights on cryptocurrency, blockchain, and digital assets. Our content is created by experienced researchers and analysts who follow strict editorial standards focused on accuracy, transparency, and credibility. Every article is carefully reviewed and verified using trusted sources and current market data. We provide unbiased analysis and timely updates covering everything from emerging crypto projects to major industry developments.