
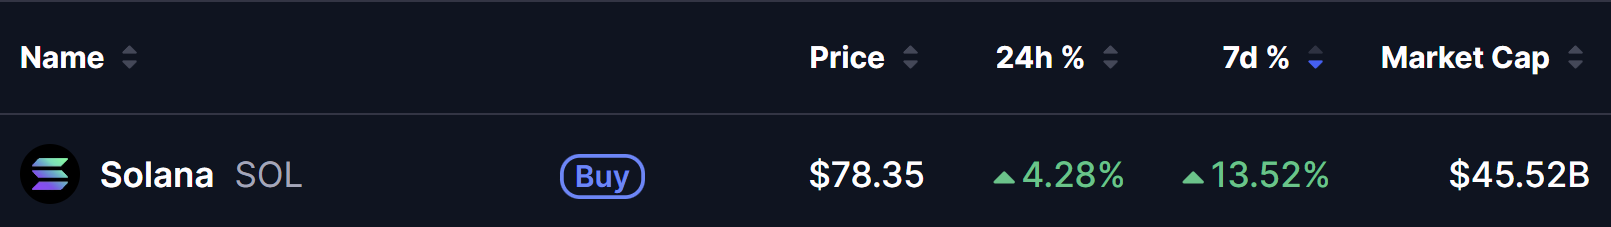
- Solana (SOL) is trading near $78.35, up 4.3% in 24 hours and 13.5% over the past week.
- Spot Solana ETFs recorded $3.55 million in weekly inflows, lifting cumulative net inflows to $1.13 billion.
- Analyst Nebraskangooner says SOL is in Wyckoff Phase D, with $97–$99 as the key breakout zone.
- A breakout above that range could pave the way for a move toward $125+.
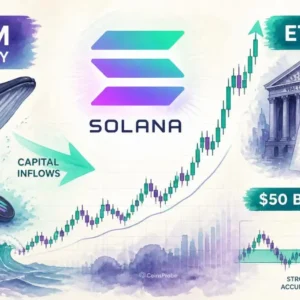
Solana is demonstrating the kind of multi-dimensional setup that tends to attract sustained attention: a strong price recovery over the past week, a meaningful shift in institutional ETF flow direction, and a well-defined technical structure pointing toward a critical breakout level. All three are arriving at the same time.
SOL Price at a Glance — July 1, 2026
Solana is currently trading at $78.35, up +4.28% in the last 24 hours and a solid +13.52% over the past 7 days. The token’s market capitalization stands at approximately $45.52 billion.
SOL ETF Inflows Turn Positive — The Institutional Signal
The most immediately significant data point accompanying SOL’s price recovery is the shift in Solana spot ETF weekly flows — a direct proxy for institutional sentiment toward the asset.
The flow reversal:
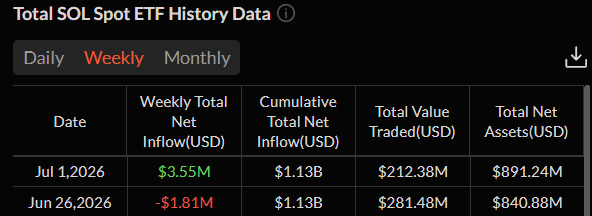
A swing from -$1.81M to +$3.55M represents a meaningful shift in institutional direction — not a large absolute number, but a clear directional reversal from net outflow to net inflow that coincides precisely with the price recovering from its recent lows.
The broader ETF picture:
Cumulative net inflows remaining at $1.13 billion — while the most recent week turned positive after a brief outflow — indicates that the broader institutional appetite for Solana ETF exposure has remained structurally intact throughout the recent price correction. The -$1.81M outflow week appears to have been a temporary pause rather than a trend reversal, with this week’s positive reading restoring the underlying positive flow direction.
As we covered in our Solana Morgan Stanley ETF filing article — Morgan Stanley has filed S-1 registration statements for its own Solana Trust, adding another layer of institutional product development that reinforces the longer-term demand picture beyond current ETF inflow data alone.
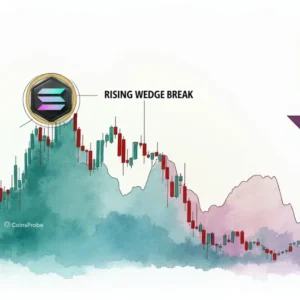
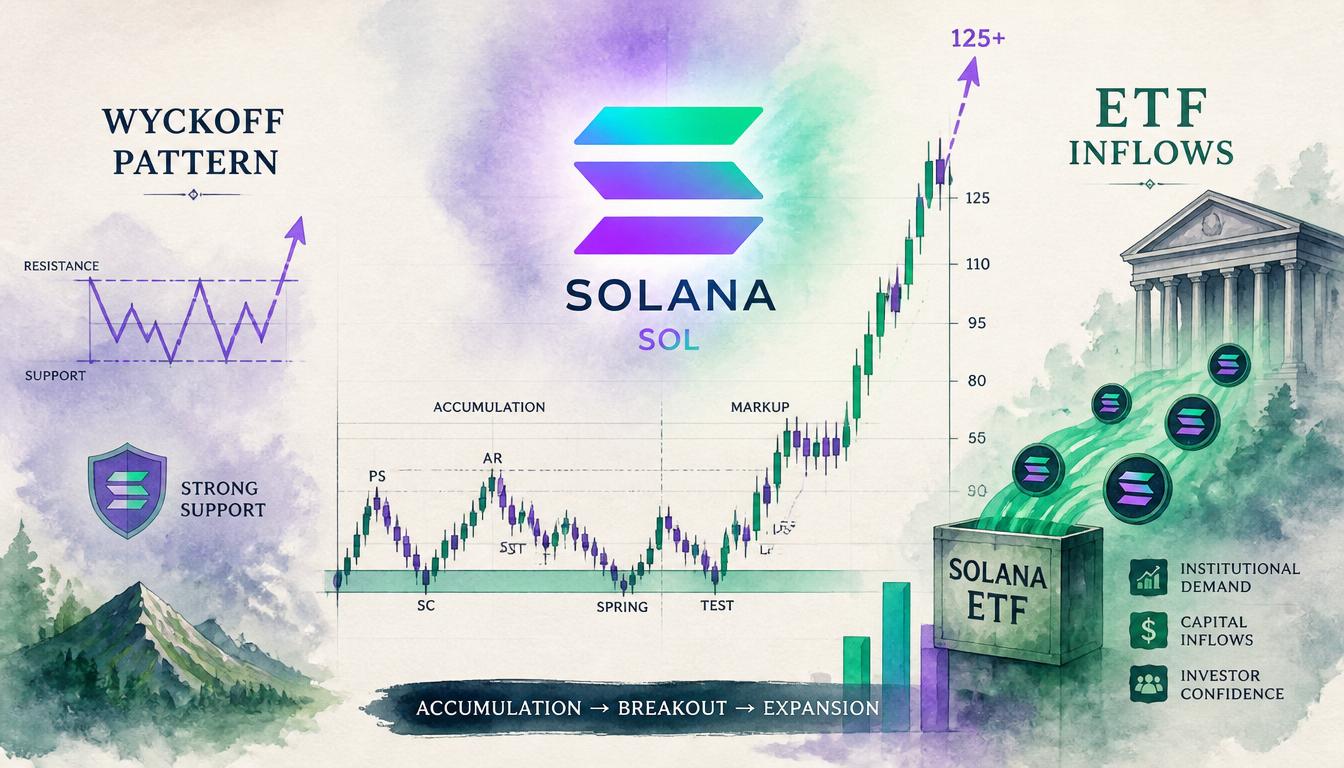
Technical Analysis: Wyckoff Accumulation Pattern
On the daily chart, Solana’s price action is showing a structure that many analysts are identifying as a Wyckoff Accumulation pattern.
Understanding the Wyckoff Accumulation cycle:
The Wyckoff method describes how large institutional operators — “composite operators” in Wyckoff’s original framing — quietly accumulate a position during a defined trading range before the subsequent markup phase.
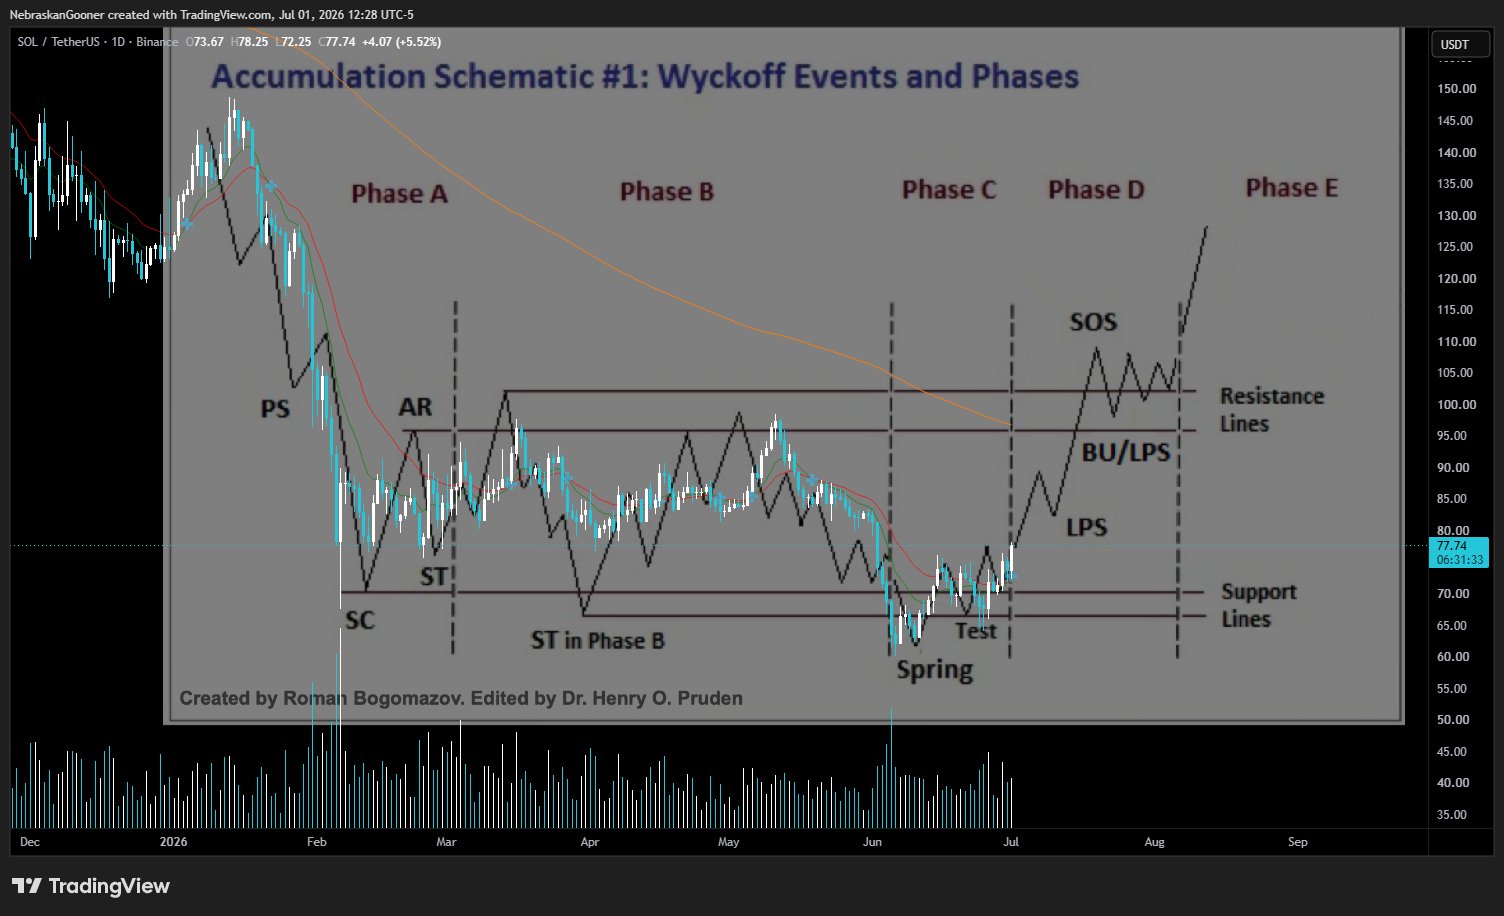
Where SOL stands — Phase D:
According to chartist @Nebraskangooner, SOL appears to be in Phase D of the Wyckoff cycle. In this phase, the next key resistance zone sits at $97 – $99.A decisive breakout above this level could mark the transition into Phase E — the markup phase — where bullish momentum typically accelerates. In such a scenario, Solana could target levels above $125 in the medium term.
The pattern suggests that the recent consolidation and recovery may be part of a larger accumulation base, setting the stage for a potential strong upward move if resistance is cleared with conviction and volume.
The Two Scenarios
Bullish Scenario — Phase D Breakout
SOL continues building higher lows within Phase D and makes a decisive, high-volume break above the $97–$99 resistance zone — signalling the transition into Phase E markup. From there, the medium-term target rises above $125, consistent with the typical momentum dynamics that characterise Wyckoff Phase E moves once the breakout is confirmed.
The ETF inflow reversal — returning to positive this week — provides the institutional demand backdrop that historically supports sustained Phase E moves rather than brief breakouts that quickly reverse.
Bearish Scenario — Resistance Rejection
SOL rallies toward the $97–$99 zone but fails to sustain a close above it — potentially signalling that the accumulation phase is not yet complete and that additional time within the range, or another test of lower support levels, is still needed. In this scenario, the Wyckoff structure would simply require more time to develop before the Phase E conditions are truly in place.
Bottom Line
Solana’s +13.52% weekly recovery arrives alongside two reinforcing signals that add substance to the move: Solana spot ETF inflows reversing from -$1.81M to +$3.55M in a single week, confirming renewed institutional interest — and a Wyckoff Accumulation structure placing SOL in Phase D, with the $97–$99 breakout level as the transition trigger into the markup phase.
A confirmed, high-volume break above $97–$99 could accelerate SOL toward targets above $125 in the medium term. Until that level is cleared decisively, the Phase D structure continues building its foundation — and the positive ETF flow direction, if sustained, provides the institutional demand backdrop needed to eventually support that breakout.
Watch $97–$99 as the level that converts the current constructive setup from accumulation into actual markup.
Frequently Asked Questions
What happened with Solana’s ETF inflows this week?
Weekly net flows reversed from -$1.81M (week of June 26) to +$3.55M (week of July 1) — signalling renewed institutional interest as price recovered. Cumulative net inflows remain at $1.13 billion.
What is the Wyckoff Phase D and what does it mean for SOL?
Phase D is the transition phase where signs of strength emerge after the accumulation range — price makes higher lows and the structure approaches a breakout. @Nebraskangooner identifies SOL as currently in this phase.
The opinions and market insights shared on CoinsProbe represent the views of individual authors based on prevailing market conditions at the time of publication. Cryptocurrency investments carry significant risk and volatility. Readers are encouraged to conduct their own research and seek professional financial advice before making investment decisions. CoinsProbe and its contributors do not accept responsibility for financial losses or decisions made based on published content.
CoinsProbe may publish sponsored articles, affiliate links, or promotional collaborations. All sponsored material is clearly labeled to maintain transparency with our audience. Our editorial decisions remain fully independent, and advertising partnerships do not influence reviews, rankings, or published opinions.
Since 2023, CoinsProbe has delivered reliable insights on cryptocurrency, blockchain, and digital assets. Our content is created by experienced researchers and analysts who follow strict editorial standards focused on accuracy, transparency, and credibility. Every article is carefully reviewed and verified using trusted sources and current market data. We provide unbiased analysis and timely updates covering everything from emerging crypto projects to major industry developments.