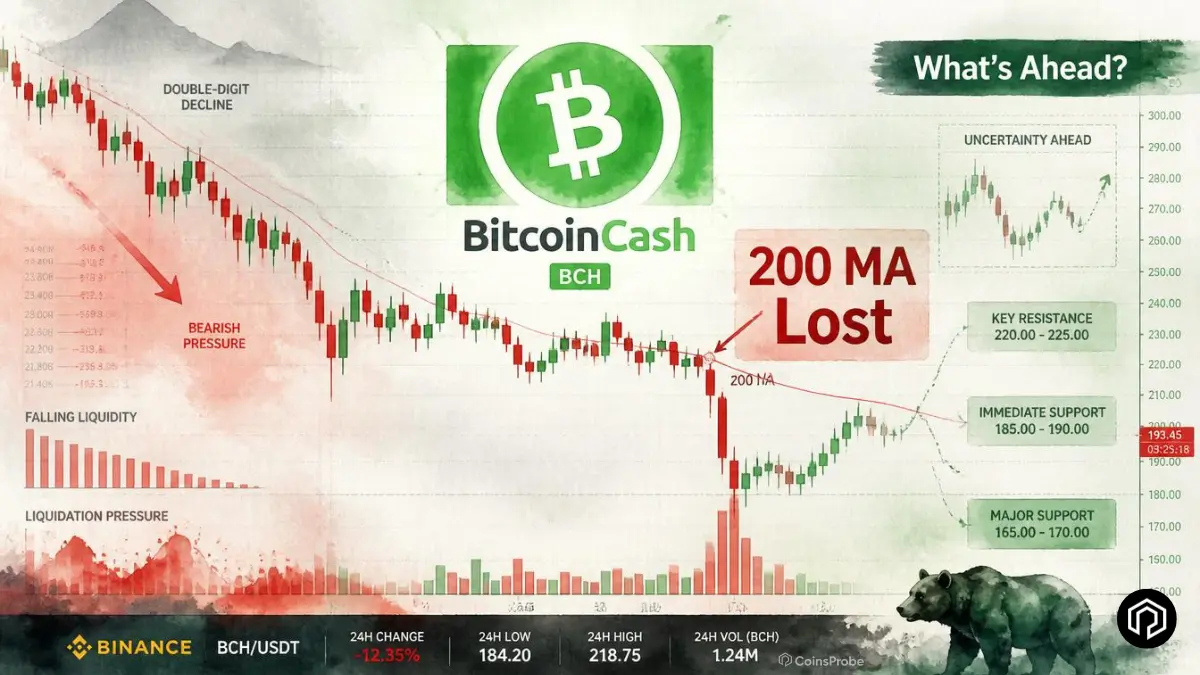

- Bitcoin Cash (BCH) is trading at $301.71 — down -11.77% in 24 hours and -50% year-to-date — with a market cap of approximately $6.05 billion.
- BCH has decisively lost the 200-day moving average at $337.87 — a critical technical breakdown that removes the primary dynamic support that had been holding the recovery structure.
- $7.43 million in 24-hour liquidations — with $7.26 million from long positions — confirming the move was amplified by a leveraged long flush rather than organic spot selling alone.
- A Bullish Shark harmonic pattern on the weekly chart is unfolding — with the current bearish leg potentially targeting Point C near $197 — approximately -33% additional downside from current levels before the reversal zone activates.
Bitcoin Cash has suffered one of its sharpest single-day declines of 2026 — and the damage extends well beyond the price number. BCH’s loss of the 200-day moving average at $337.87 is the most significant technical development of the session — removing the level that had been acting as dynamic support and opening the door to the next leg of the harmonic pattern that has been unfolding on the weekly chart since the $686 high earlier this year.
The broader context matters here too. As we covered in our Bitcoin crash analysis, the broader crypto market is facing significant geopolitical headwinds from US-Iran escalation — and BCH’s high-beta nature relative to BTC means it amplifies macro risk-off moves more severely than large-cap assets.
BCH at a Glance — May 28, 2026

The -50% year-to-date decline is the sobering macro context for today’s move. BCH peaked near $686 earlier in 2026 — and is now trading at less than half that level — with today’s 200 MA breakdown removing the last meaningful technical defence between current prices and the harmonic pattern’s downside target zone.
Liquidations — Long Flush Amplifies the Move
The sharp price decline was accompanied by a significant liquidation cascade — confirming that elevated leverage was present in the market ahead of the breakdown:
- 24h Total Liquidations: $7.43 million
- Long Liquidations: $7.26 million
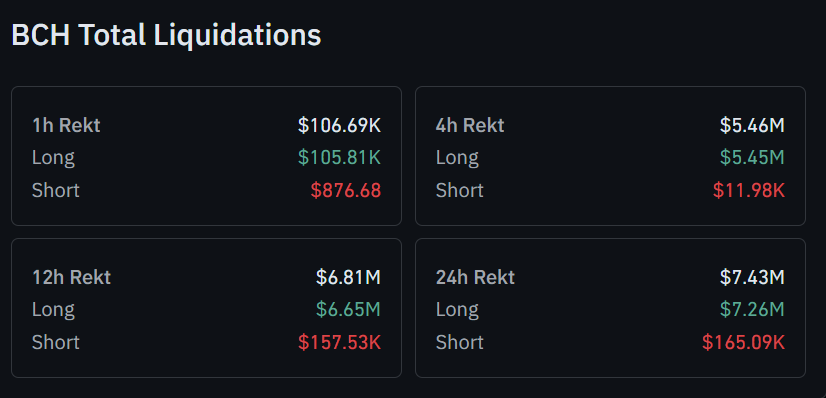
The 97.7% long-heavy composition of liquidations is the defining characteristic of this session — virtually every liquidated position was a leveraged long. This confirms the pattern we covered in the Bitcoin crash analysis — geopolitical risk-off events flush leveraged longs systematically, amplifying the initial move well beyond what spot selling alone would produce.
The near-total absence of short liquidations also tells an important story: there was no meaningful short squeeze resistance on the way down. The order book did not put up a fight at any intermediate level — the breakdown through the 200 MA was clean and decisive.
Technical Analysis — Bullish Shark Harmonic Pattern
Despite the bearish price action — the technical setup on BCH is actually following a well-defined harmonic structure. The pattern is a Bullish Shark — one of the more complex harmonic patterns but one with a clearly defined reversal zone at completion.
Understanding the Bullish Shark:
The Bullish Shark is a five-point harmonic pattern — O, X, A, B, C — where the BC leg produces a sharp decline into the Potential Reversal Zone (PRZ) at Point C before a significant bullish reversal. The key characteristic is that the decline into the PRZ can be steep and frightening — which is precisely what makes it a high-conviction entry zone when the pattern completes.
How the pattern has unfolded on BCH:
Point B — $686 — The pattern’s most recent high — reached earlier in 2026 — marking the peak from which the current corrective BC leg originated. BCH has now declined more than 50% from this level.
200 MA at $337.87 — Lost today — The 200-day moving average has been the most significant intermediate support during the decline from $686. Today’s decisive break below this level confirms the BC leg is continuing its progression toward the harmonic completion zone.
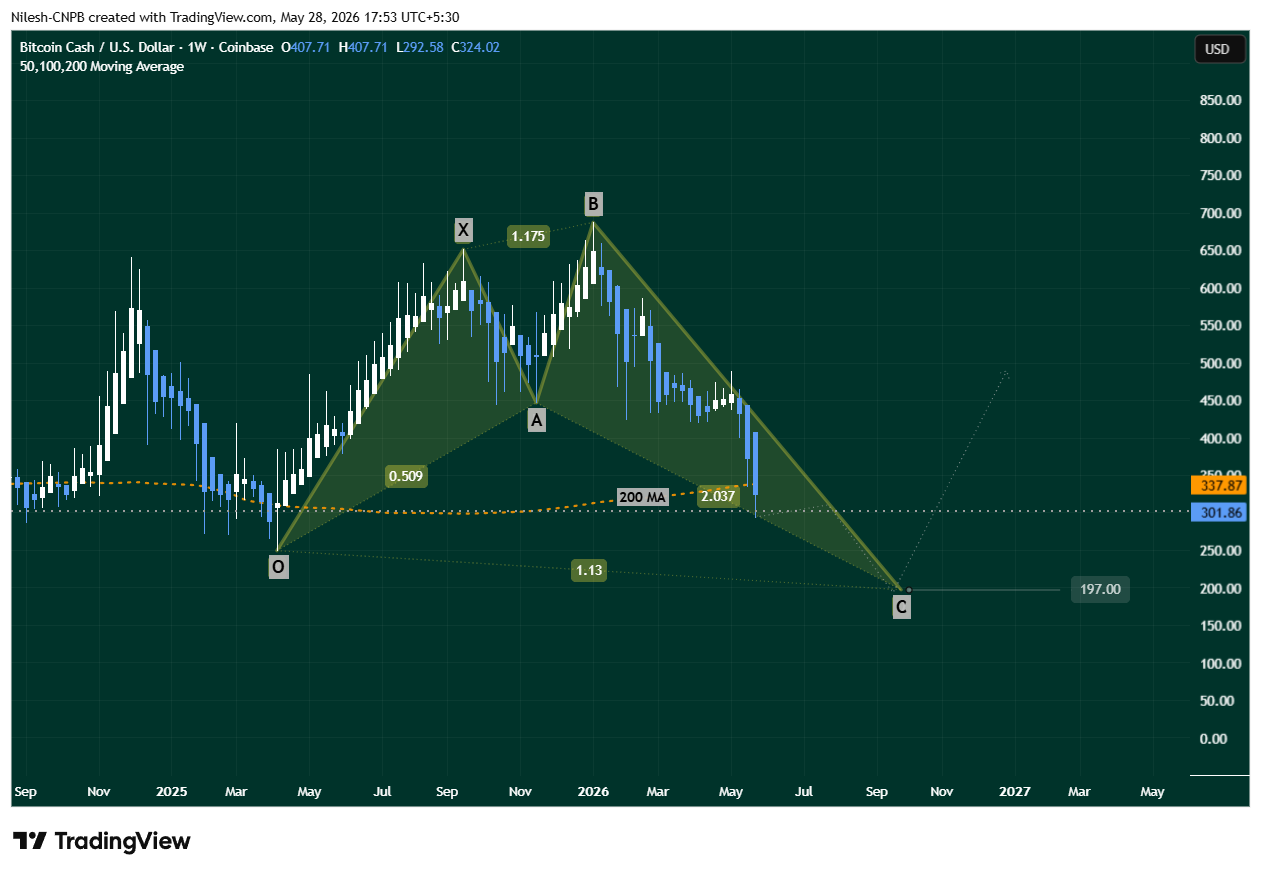
Point C target — ~$197 — If the Bullish Shark pattern continues to unfold as projected, the BC leg targets approximately $197 — the harmonic PRZ where the pattern completes and the bullish reversal becomes statistically most likely. From the current $301.71, this represents an additional -34.7% decline before the reversal zone is reached.
The $197 zone is not a random target — it is a Fibonacci-derived level that aligns multiple ratio relationships from the prior swing points simultaneously — giving it structural significance beyond a simple round number.
What’s Next — Two Scenarios
Bearish Scenario — Pattern Plays Out
BCH sustains its break below the 200 MA at $337.87 — the level now acting as overhead resistance rather than support — and continues the CD leg progression toward the $197–$250 harmonic completion zone. Each failed recovery attempt that rejects from the 200 MA confirms the pattern is following its projected structure.
The $250 level represents the upper boundary of the reversal zone — where early pattern traders might begin cautious positioning. The $197 level is the full harmonic completion — where the Bullish Shark PRZ activates and the highest-probability reversal occurs.
Bullish Invalidation
A strong daily or weekly close above the 200 MA at $337.87 would invalidate the bearish harmonic extension — signalling that the CD leg has completed early and buyers have absorbed the breakdown with sufficient conviction to reclaim the key level. In this scenario a relief rally toward the $380–$400 zone becomes the primary objective.
The invalidation requires a sustained close — not just an intraday spike above $337.87. A wick above followed by a close below would simply confirm the 200 MA has flipped from support to resistance.
Bottom Line
Bitcoin Cash has broken a critical level today — and the harmonic pattern that has been developing since the $686 high is now pointing toward a target that will make many holders uncomfortable: $197. The 200 MA loss at $337.87 removes the last meaningful technical defence between current prices and the completion zone — and the 97.7% long-heavy liquidation profile confirms there was no genuine buying conviction at the breakdown level.
The Bullish Shark pattern is named bullish for a reason — the completion at the PRZ near $197 is where the highest-conviction reversal opportunity historically emerges. But getting there first requires weathering the CD leg — and the clean break of the 200 MA today suggests that leg has resumed.
Watch $300 as the immediate floor. Watch $337.87 as the resistance that must be reclaimed to change the thesis. And watch for confirmation of the pattern completing near $197 as the eventual high-conviction accumulation zone.
Frequently Asked Questions (FAQ)
Why is Bitcoin Cash falling so sharply today?
BCH dropped -11.77% after losing the critical 200-day MA support at $337.87 — amplified by $7.43M in liquidations (97.7% from long positions) and broader crypto market risk-off from US-Iran geopolitical tensions.
What is BCH’s downside target?
The Bullish Shark pattern targets approximately $197 — representing an additional -34.7% decline from the current $301.71 — as the full harmonic PRZ completion where the reversal opportunity activates.
What would invalidate the bearish BCH setup?
A sustained daily or weekly close above $337.87 — the 200 MA — would invalidate the bearish harmonic extension and signal the CD leg has completed early — opening the door for a relief rally toward $380–$400.
The opinions and market insights shared on CoinsProbe represent the views of individual authors based on prevailing market conditions at the time of publication. Cryptocurrency investments carry significant risk and volatility. Readers are encouraged to conduct their own research and seek professional financial advice before making investment decisions. CoinsProbe and its contributors do not accept responsibility for financial losses or decisions made based on published content.
CoinsProbe may publish sponsored articles, affiliate links, or promotional collaborations. All sponsored material is clearly labeled to maintain transparency with our audience. Our editorial decisions remain fully independent, and advertising partnerships do not influence reviews, rankings, or published opinions.
Since 2023, CoinsProbe has delivered reliable insights on cryptocurrency, blockchain, and digital assets. Our content is created by experienced researchers and analysts who follow strict editorial standards focused on accuracy, transparency, and credibility. Every article is carefully reviewed and verified using trusted sources and current market data. We provide unbiased analysis and timely updates covering everything from emerging crypto projects to major industry developments.