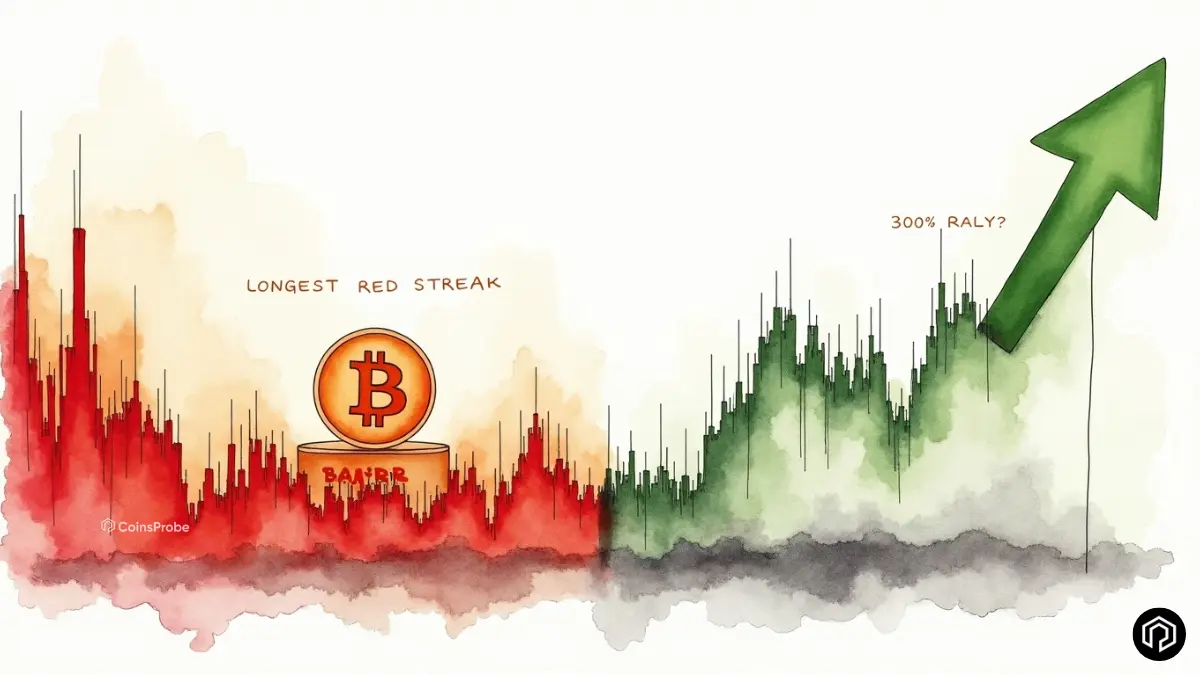

- Bitcoin has posted five consecutive red monthly closes from October 2025 through February 2026 — with March currently negative at -1.69%. A red March close would tie the longest losing streak in Bitcoin's entire history — a record previously set between August 2018 and January 2019.
- The last time BTC posted six consecutive red monthly closes, price was near $3,400 — followed by a 300% rally in the next five months.
- Macro strategist Gert van Lagen (@GertvanLagen) has identified a Bump and Run Reversal (BARR) pattern on the daily chart — with the 2026 downtrend broken to the upside and successfully retested three times as support.
- The combination of a rare historical red streak and a confirmed technical breakout makes the Q2 2026 opening one of the most critical periods for Bitcoin's price direction in the current cycle.
Bitcoin is approaching one of the most historically significant moments in its entire price history — simultaneously facing its longest potential losing streak ever recorded while a technical breakout pattern suggests the broader 2026 downtrend may have already structurally reversed. The convergence of these two signals makes the final days of March 2026 one of the most closely watched periods for BTC traders and long-term investors alike.
As of March 27, 2026, Bitcoin is trading at $66,157.47, down 3.43% in the past 24 hours and 24.40% year-to-date, with a market capitalization of approximately $1.32 trillion.
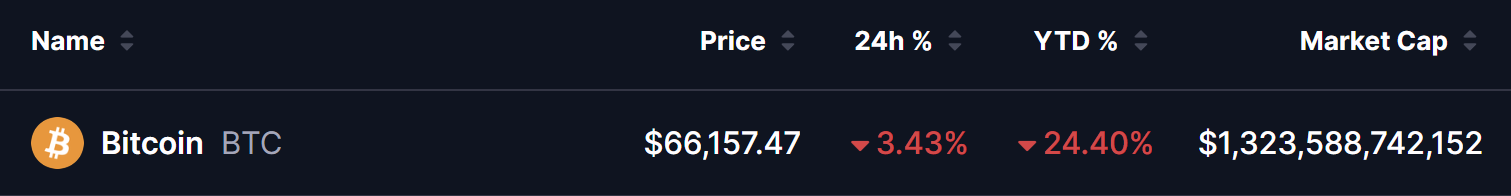
Despite its 24.40% year-to-date decline, Bitcoin’s $1.32 trillion market capitalization confirms its enduring dominance as the world’s largest cryptocurrency. BTC continues to consolidate in the mid-$60,000 range as March 2026 approaches its close — with market participants watching two specific and independent signals that are converging simultaneously to create an unusually significant setup.
As we covered in our Bitcoin whale accumulation analysis, smart money has been quietly accumulating 61,568 BTC over the past month — adding a third data point to an already compelling picture as the month-end approaches.
Five Straight Red Months — Matching Bitcoin’s Longest Historical Streak
Analyst Jeremy (@Jeremybtc) drew attention to a remarkable historical data point on March 27, 2026 — Bitcoin has now posted five consecutive red monthly closes from October 2025 through February 2026, and March is currently trading negative at -1.69% with the monthly close just days away.
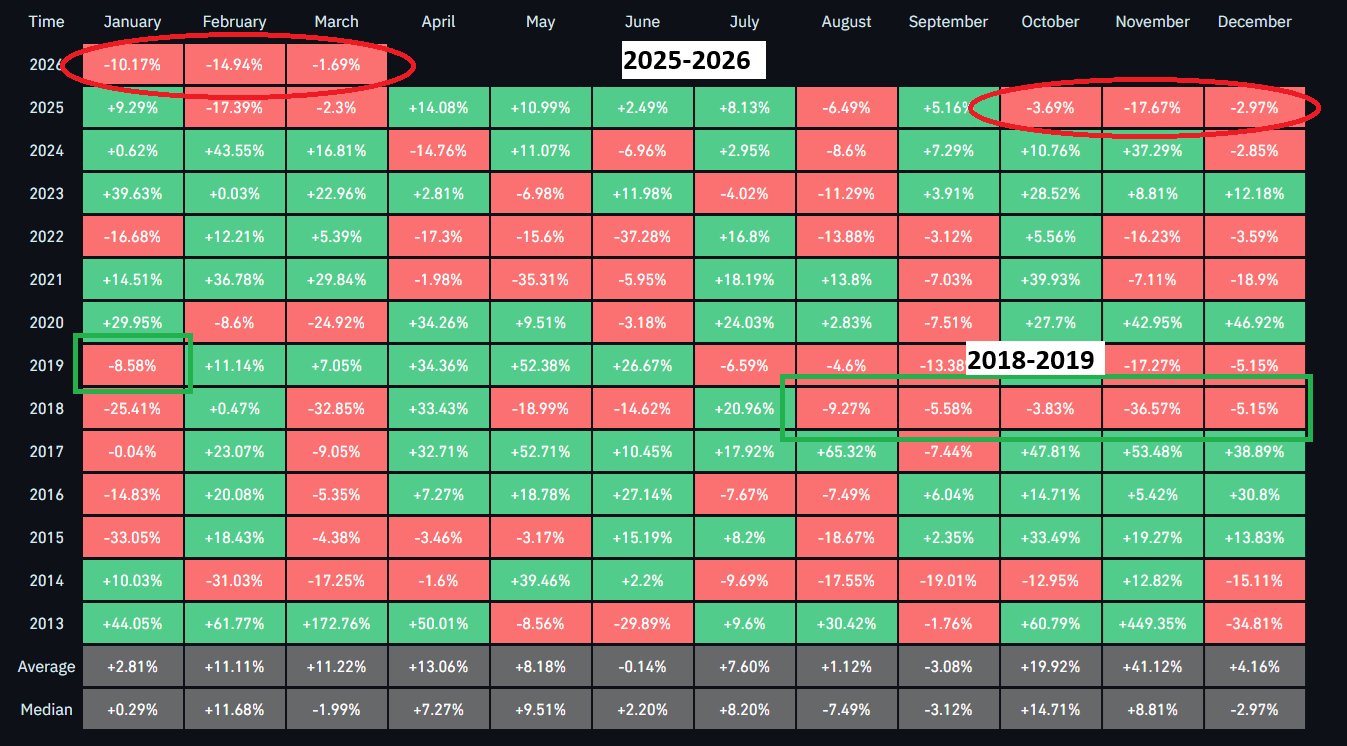
The monthly performance breakdown:
- October 2025: -3.69%
- November 2025: -17.67%
- December 2025: -2.97%
- January 2026: -10.17%
- February 2026: -14.94%
- March 2026: -1.69% (month not yet closed)
If March closes in the red — which the current price action suggests is highly likely — it would mark six consecutive red monthly closes — tying the longest losing streak in Bitcoin’s entire recorded price history.
The Historical Parallel — 2018–2019
The only previous time Bitcoin experienced six consecutive red monthly closes was between August 2018 and January 2019 — during the depths of the crypto bear market that followed the 2017 all-time high. At that point, BTC was trading near $3,400 — approximately 83% below its peak.
What happened next is the data point that has captured market attention:
Following the completion of that six-month red streak, Bitcoin delivered a ~300% rally over the next five months — one of the most powerful recovery moves in its history.
Jeremy’s detailed monthly returns table covering 2013 to 2026 — visible in the chart — highlights both the current 2025–2026 red period (circled in red at the top) and the 2018–2019 reference period (circled in green at the bottom) — showing the structural similarity between both sequences of consecutive negative monthly closes.
Important caveat: Past performance does not guarantee future outcomes. The 2018–2019 comparison provides historical context — not a prediction. The macro environment, market structure, and institutional landscape of 2026 differ significantly from 2018–2019. However, the rarity of six consecutive red months — occurring only once in Bitcoin’s entire history — makes the historical parallel genuinely noteworthy rather than superficial pattern-matching.
Bump and Run Reversal (BARR) — 2026 Downtrend Broken
While the monthly candle data captures the historical context, the daily chart is telling a different but complementary story — one that suggests the structural trend may have already shifted beneath the surface of the bearish monthly closes.
Macro strategist Gert van Lagen (@GertvanLagen) shared a technical perspective on March 27, 2026 — noting that the 2026 downtrend has been broken to the upside and has now been successfully retested three times as support.
What Is a Bump and Run Reversal (BARR)?
The Bump and Run Reversal is a chart pattern used to identify the end of a downtrend and the beginning of a structural reversal. It typically features three distinct phases: Lead-in Phase, Bump Phase and Run Phase.
How the BARR Pattern Applies to Bitcoin’s Current Chart:
Looking at the daily chart (TradingView, March 27, 2026):
Lead-in Phase — Clearly visible from mid-January 2026 through early February 2026 — an orderly decline along the primary descending trendline from Bitcoin’s highs.
Bump Phase — The sharper acceleration lower through February 2026 — the steepest part of the descent that pushed BTC toward its cycle lows near $60,000 before recovering.
Trendline Breakout — Bitcoin has broken above the key descending trendline from the 2026 downtrend — the critical structural break that defines the BARR pattern.
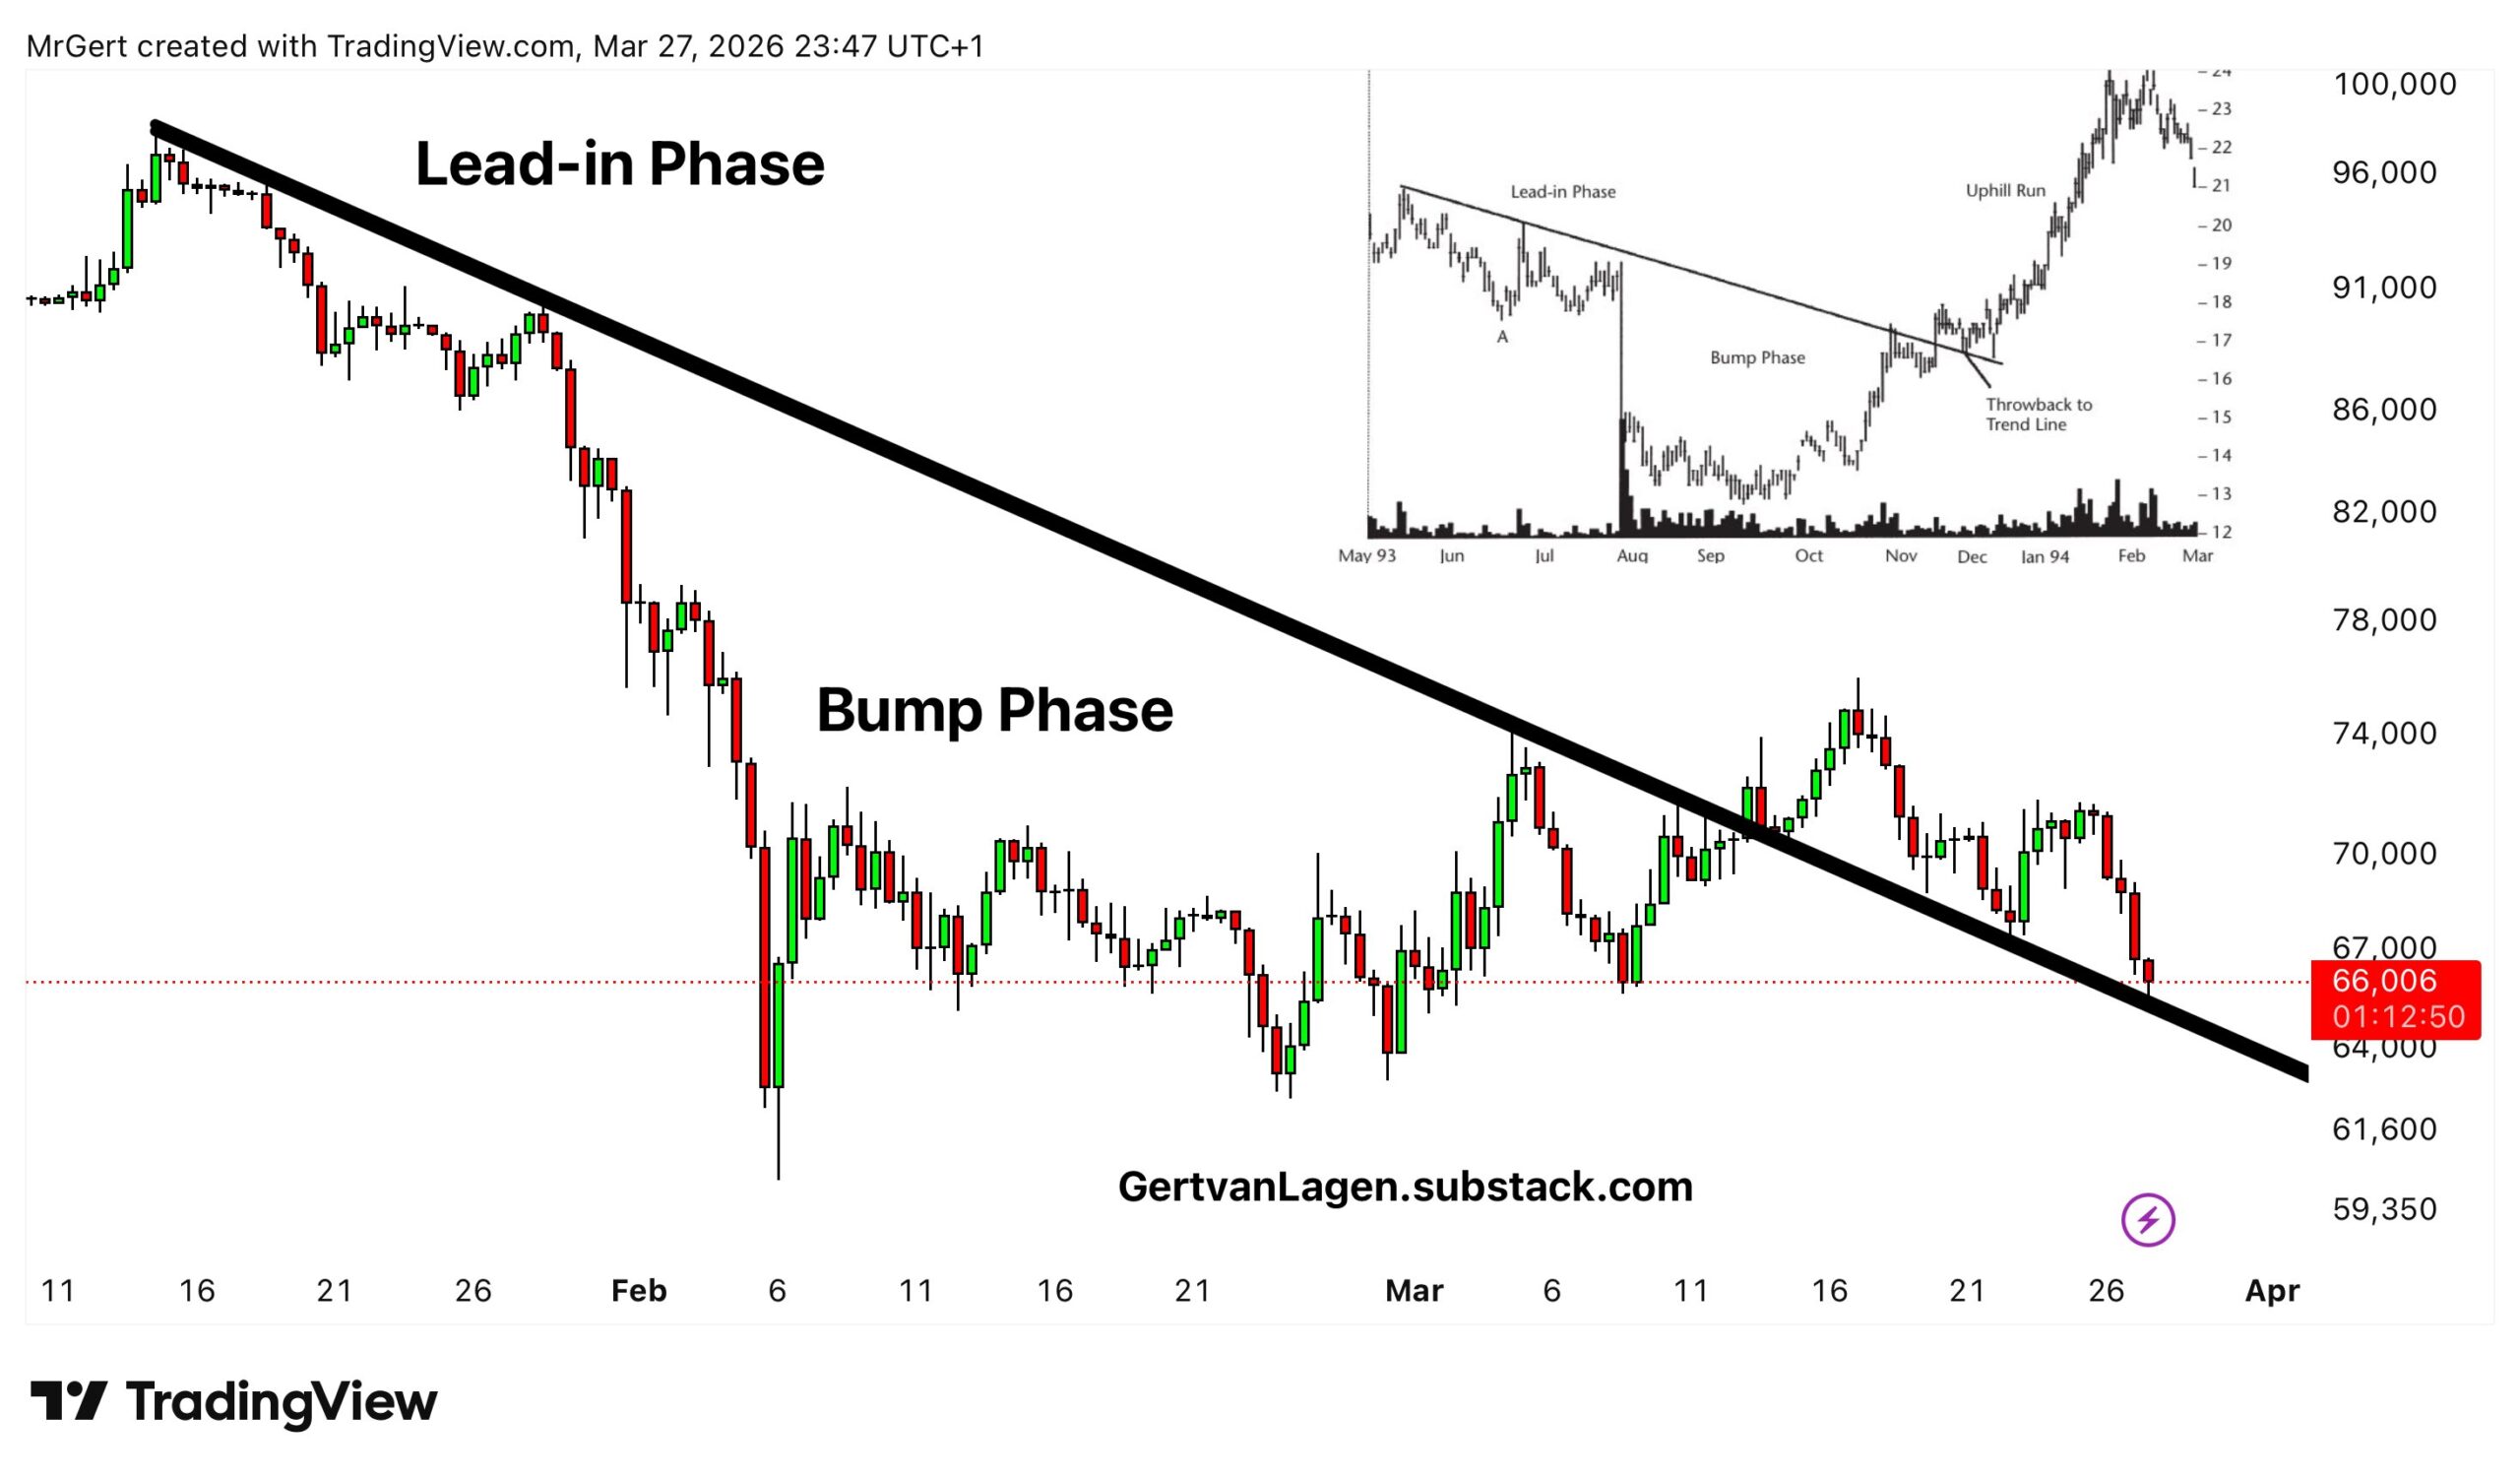
Three Successful Retests — Since the initial breakout, price has returned to test the broken trendline three times — each time holding it as support rather than breaking back below. Multiple successful retests are the hallmark of a confirmed BARR reversal — signaling that what was previously resistance has become a genuine support level defended by buyers.
The inset historical analog on the chart — drawn from 1993–1994 — illustrates the classic “throwback to trend line” behavior that defines the BARR pattern, showing how price typically revisits the broken trendline multiple times before the “Uphill Run” phase that follows.
Current price action near $66,006 sits in the proximity of the broken trendline — making the current retest zone one of the most critical levels on the chart heading into Q2 2026.
What’s Next for Bitcoin?
Bitcoin is at a genuinely rare historical and technical juncture — where a record-tying red monthly streak and a confirmed technical breakout pattern are converging simultaneously as March closes and Q2 2026 begins.
Bullish Scenario
- March closes red — completing the six-month losing streak and establishing the historical parallel to 2018–2019
- The BARR trendline holds as support on the current retest — confirming the third successful defense of the broken downtrend
- Q2 2026 opens with buying pressure returning — mirroring the April–May 2019 recovery that followed the previous six-month red streak
- 300% historical analog target — while not a price prediction, the 2018–2019 parallel suggests the magnitude of the potential recovery if the pattern repeats
- Whale accumulation we identified in our Bitcoin analysis — 61,568 BTC accumulated by large wallets — provides additional fundamental support for a recovery
Bearish Scenario
- The BARR trendline fails to hold on the current retest — price breaks back below the broken downtrend, invalidating the bullish reversal pattern
- March closes red AND the BARR breakdown triggers a deeper sell-off as pattern failure attracts additional selling pressure
- The historical 2018–2019 parallel fails to repeat — macro differences including geopolitical tensions from the US-Iran conflict and persistent risk-off sentiment keep Bitcoin under pressure into Q2 2026
- Next meaningful support below current levels would be the $60,000 cycle low — a break below which would signal the bearish scenario is fully in play
What to Watch for $BTC — Final Days of March 2026
Three specific data points will determine how this setup resolves:
Monthly close — March 31, 2026 — The most immediate catalyst. A red close confirms the six-month streak and establishes the historical parallel. A surprise green close would break the streak but would not necessarily invalidate the BARR pattern.
BARR trendline defense — Watch for Bitcoin to hold the current retest zone near $66,000 on a daily closing basis. A sustained close above the broken trendline confirms the third successful retest and keeps the bullish BARR setup intact.
Q2 2026 opening momentum — The first week of April will be the most telling signal for whether the historical 2018–2019 recovery analog begins to play out. Strong buying volume in early April — combined with the monthly streak completion — would be the most compelling confirmation signal available.
Frequently Asked Questions
What happened after Bitcoin’s last six consecutive red monthly closes?
Bitcoin has posted five consecutive red monthly closes from October 2025 through February 2026, with March 2026 currently negative. If March closes red, it would tie the longest losing streak in Bitcoin’s entire history — previously recorded between August 2018 and January 2019. The rarity of this event — occurring only once before in Bitcoin’s history — makes it historically significant as a potential mean-reversion signal.
What is the Bump and Run Reversal (BARR) pattern?
The BARR is a technical chart pattern that identifies the end of a downtrend and the beginning of a structural reversal. It features a Lead-in Phase (orderly decline) followed by a sharper Bump Phase (accelerated descent), before price breaks back above the primary downtrend trendline. Multiple successful retests of the broken trendline — as seen three times with Bitcoin — confirm growing buyer strength and signal a potential sustained reversal.
What does it mean that the 2026 downtrend has been retested three times?
In the BARR pattern, each successful retest of the broken trendline as support — rather than resistance — confirms that the structural trend has shifted. Three successful retests is a strong confirmation signal that the broken downtrend has genuinely flipped from resistance to support — suggesting buyers are defending the level with increasing conviction.
What invalidates the bullish Bitcoin setup?
A decisive daily close back below the broken 2026 downtrend trendline — currently near the $66,000 level — would invalidate the BARR pattern and signal that the bearish trend has resumed. In this scenario, the next meaningful support would be the cycle low near $60,000.
The opinions and market insights shared on CoinsProbe represent the views of individual authors based on prevailing market conditions at the time of publication. Cryptocurrency investments carry significant risk and volatility. Readers are encouraged to conduct their own research and seek professional financial advice before making investment decisions. CoinsProbe and its contributors do not accept responsibility for financial losses or decisions made based on published content.
CoinsProbe may publish sponsored articles, affiliate links, or promotional collaborations. All sponsored material is clearly labeled to maintain transparency with our audience. Our editorial decisions remain fully independent, and advertising partnerships do not influence reviews, rankings, or published opinions.
Since 2023, CoinsProbe has delivered reliable insights on cryptocurrency, blockchain, and digital assets. Our content is created by experienced researchers and analysts who follow strict editorial standards focused on accuracy, transparency, and credibility. Every article is carefully reviewed and verified using trusted sources and current market data. We provide unbiased analysis and timely updates covering everything from emerging crypto projects to major industry developments.