
Sui has experienced a difficult stretch in recent months, with price action and on-chain metrics reflecting a sharp cooldown after its earlier hype cycle. While the Layer-1 blockchain was once widely compared to Solana during its explosive 2021 bull run, the reality so far has been far more challenging.
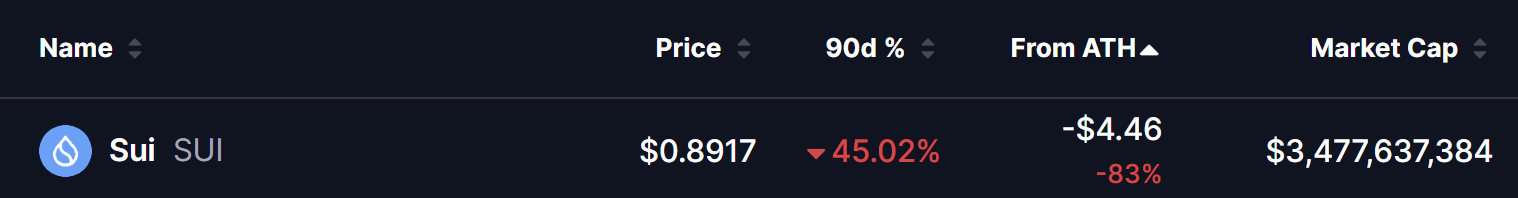
As of now, SUI trades around $0.89, representing a 45% decline over the past 90 days and roughly 83% below its all-time high. The token currently holds a market capitalization of approximately $3.47 billion, placing it among the larger Layer-1 blockchain projects despite the recent downturn.
While the ecosystem continues to develop, both price performance and DeFi liquidity trends suggest that Sui has yet to replicate the explosive growth that Solana experienced during its peak cycle.
Sui’s DeFi Liquidity Sees Major Decline
A major indicator of weakening momentum has been the sharp drop in Total Value Locked (TVL) across the Sui ecosystem.
According to data from DefiLlama, Sui’s TVL peaked around $2.63 billion in October 2025. However, that figure has since fallen dramatically to approximately $566 million as of March 2026.
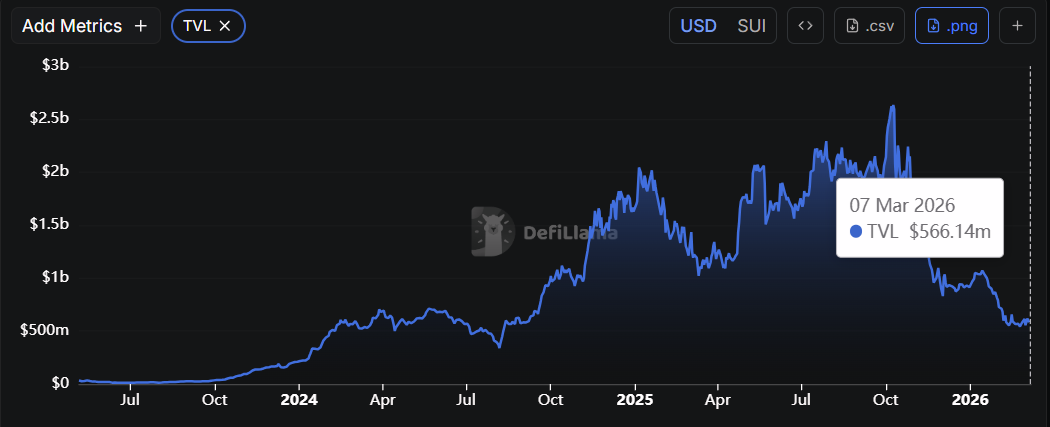
This represents a drop of nearly 80% in locked capital, highlighting reduced activity across decentralized applications built on the network.
A declining TVL often signals:
- Lower DeFi participation
- Reduced liquidity across protocols
- Declining user activity
For investors tracking Layer-1 ecosystems, TVL remains one of the most important metrics for assessing network health and developer traction.
BNB Fractal Suggests a Familiar Market Cycle
Despite the bearish conditions, an interesting technical pattern has caught the attention while comparing Sui’s market structure to the historic cycle of BNB.
Back in March 2020, BNB experienced a massive 76% correction before eventually reclaiming its 100-day moving average. Once momentum returned, the token rallied more than 850%, ultimately topping near the 2.618 Fibonacci extension level before entering another brutal correction of roughly 84%.
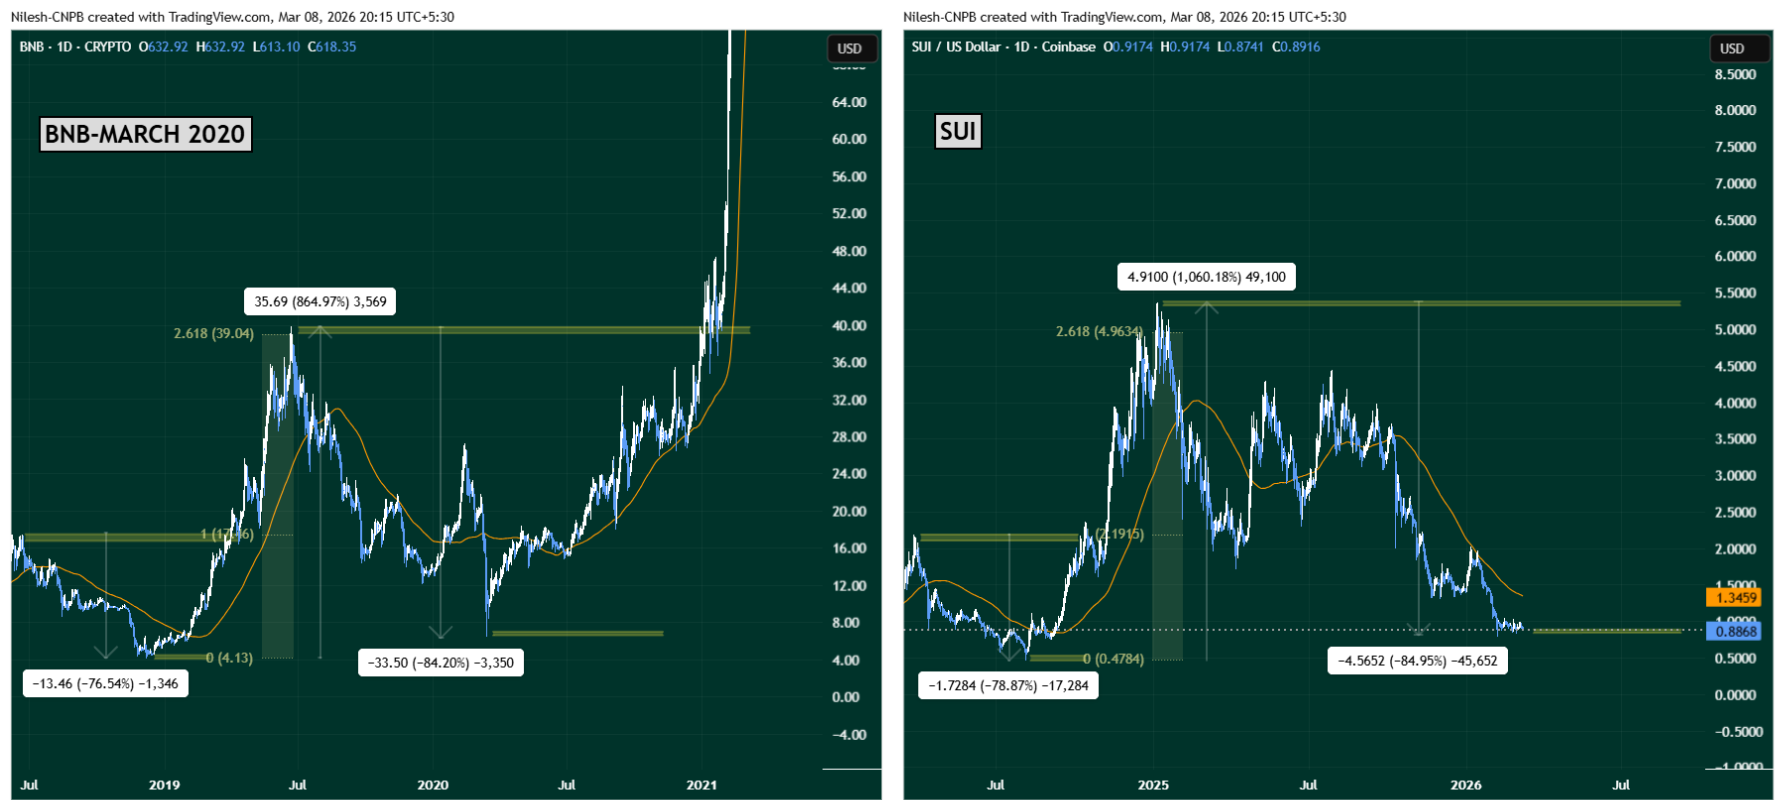
Interestingly, Sui appears to be following a strikingly similar path.
The chart comparison shows that:
- SUI first suffered a 78% correction during its early cycle
- It then staged a massive rally exceeding 800%
- The rally also topped near the 2.618 Fibonacci extension level
- The token is now experiencing a brutal 84% correction
This structure closely mirrors the same sequence that occurred in BNB’s 2020 market cycle—a pattern that ultimately preceded a powerful bullish reversal.
What’s Next for SUI?
If the fractal comparison with BNB continues to hold, the current price region near $0.80–$0.90 could potentially represent a long-term accumulation zone.
Historically, deep corrections following extended rallies often serve as reset phases before the next major market expansion.
However, confirmation of a bullish reversal will require a key technical milestone.
For SUI, watching the 100-day moving average near $1.3459 will be crucial. A decisive reclaim of this level would signal renewed momentum and potentially mark the beginning of the next upward trend.
Until then, the market may remain in a consolidation phase, as investors assess whether Sui can rebuild ecosystem growth and eventually reignite the excitement that once drew comparisons to Solana’s legendary 2021 run.
The opinions and market insights shared on CoinsProbe represent the views of individual authors based on prevailing market conditions at the time of publication. Cryptocurrency investments carry significant risk and volatility. Readers are encouraged to conduct their own research and seek professional financial advice before making investment decisions. CoinsProbe and its contributors do not accept responsibility for financial losses or decisions made based on published content.
CoinsProbe may publish sponsored articles, affiliate links, or promotional collaborations. All sponsored material is clearly labeled to maintain transparency with our audience. Our editorial decisions remain fully independent, and advertising partnerships do not influence reviews, rankings, or published opinions.
Since 2023, CoinsProbe has delivered reliable insights on cryptocurrency, blockchain, and digital assets. Our content is created by experienced researchers and analysts who follow strict editorial standards focused on accuracy, transparency, and credibility. Every article is carefully reviewed and verified using trusted sources and current market data. We provide unbiased analysis and timely updates covering everything from emerging crypto projects to major industry developments.