

Key Takeaways
- Ethereum has pulled back to the $3,200 zone following a broader market sell-off triggered by US–EU trade tensions.
- The daily chart continues to show a well-formed ascending triangle pattern that has been developing since late 2025.
- ETH is approaching a key rising trendline support near $3,150, a level that has historically attracted strong buying interest.
- As long as this support holds, the broader bullish structure remains intact despite short-term weakness.
- A successful bounce from the lower boundary could set up another attempt toward the $3,400 resistance zone.
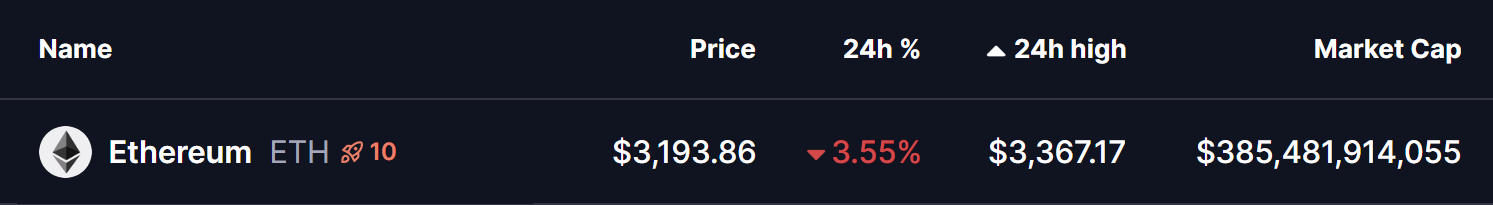
As of January 19, 2026, Ethereum (ETH) is trading around $3,200, down 3.36% on the day. The decline followed a rejection from its 24-hour high near $3,367, as the broader crypto market turned risk-off amid escalating US–EU trade tensions. The macro shock triggered nearly $870 million in long liquidations, dragging major assets like ETH lower and pushing price action toward a critical technical zone.
Despite the sell-off, Ethereum’s broader structure remains technically constructive.
Ascending Triangle Still Intact
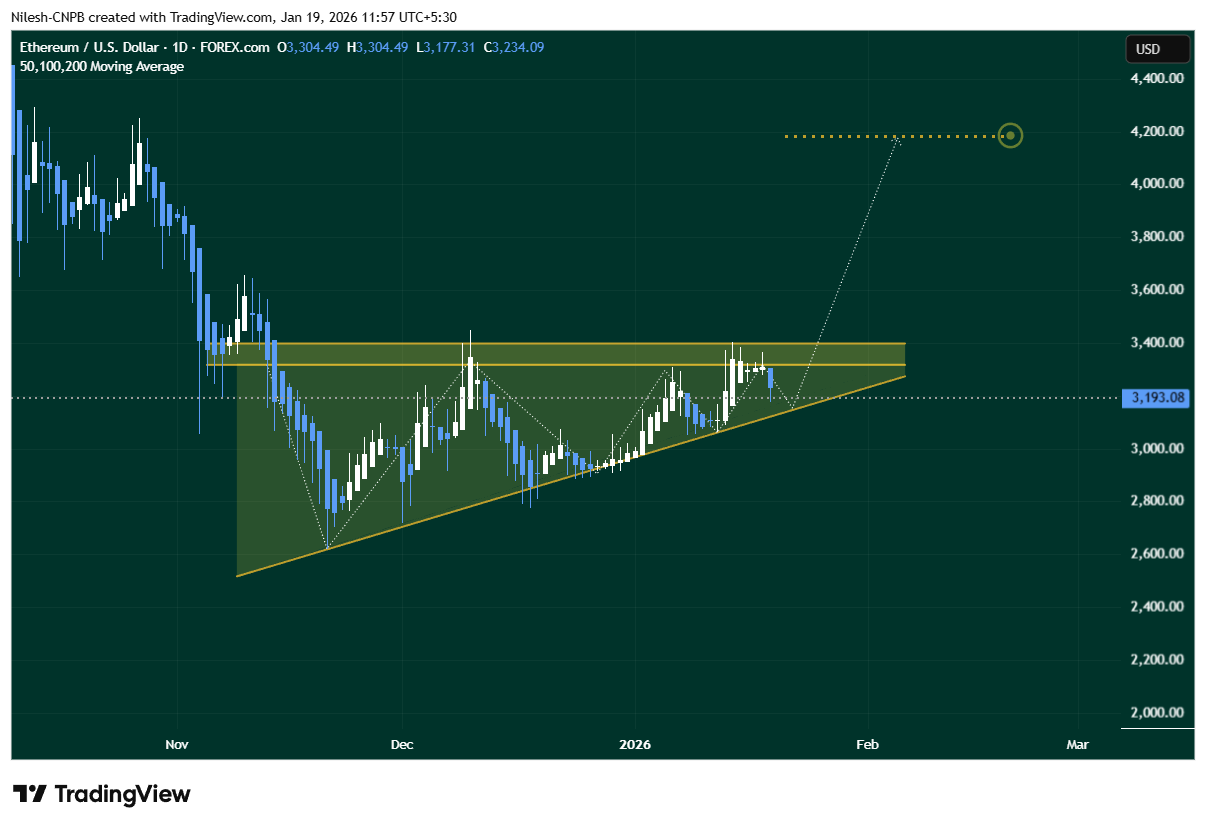
On the daily chart, Ethereum continues to trade within a well-defined ascending triangle pattern that has been forming since late 2025. This structure is characterized by higher lows rising steadily against a strong horizontal resistance zone around $3,400.
During today’s pullback, ETH once again faced rejection at the triangle’s neckline resistance before sliding lower. Price is now hovering near $3,190–$3,200, gradually drifting toward the ascending trendline support that has repeatedly acted as a demand zone over the past several months.
Importantly, every previous visit to this rising support has attracted buyers, resulting in sharp rebounds.
Momentum Cooling, But Structure Holds
While short-term momentum has weakened due to the broader market sell-off, ETH has not broken its bullish structure. The series of higher lows remains intact, and price continues to respect the rising trendline drawn from the November and December swing lows.
This suggests that the current move is more of a healthy pullback within a larger consolidation, rather than a breakdown.
Will This Pattern Trigger a Rebound?
If Ethereum drops slightly further and tests the lower boundary near $3,150, the reaction at this level will be crucial. A strong bounce from this zone would reinforce the ascending triangle setup and increase the probability of another attempt toward the $3,400 resistance.
Historically, this support has been defended aggressively by buyers, making it a key level to watch in the coming sessions. A successful hold could set the stage for a renewed push higher once broader market sentiment stabilizes.
On the flip side, a clean breakdown below the ascending trendline would weaken the bullish thesis and expose ETH to deeper downside in the short term.
Bottom Line
For now, Ethereum remains at a make-or-break technical zone. While macro uncertainty has injected volatility into the market, ETH’s chart structure still favors a potential rebound as long as the rising support continues to hold. Traders will be watching closely to see whether buyers step in once again — or if broader risk-off pressure forces a deeper correction.
Disclaimer: The views and analysis presented in this article are for informational purposes only and reflect the author’s perspective, not financial advice. Technical patterns and indicators discussed are subject to market volatility and may or may not yield the anticipated results. Investors are advised to exercise caution, conduct independent research, and make decisions aligned with their individual risk tolerance.
About Author: Nilesh Hembade is the Founder and Lead Author of Coinsprobe, with over 5 years of experience in the cryptocurrency and blockchain industry. Since launching Coinsprobe in 2023, he has been providing daily, research-driven insights through in-depth market analysis, on-chain data, and technical research.
The opinions and market insights shared on CoinsProbe represent the views of individual authors based on prevailing market conditions at the time of publication. Cryptocurrency investments carry significant risk and volatility. Readers are encouraged to conduct their own research and seek professional financial advice before making investment decisions. CoinsProbe and its contributors do not accept responsibility for financial losses or decisions made based on published content.
CoinsProbe may publish sponsored articles, affiliate links, or promotional collaborations. All sponsored material is clearly labeled to maintain transparency with our audience. Our editorial decisions remain fully independent, and advertising partnerships do not influence reviews, rankings, or published opinions.
Since 2023, CoinsProbe has delivered reliable insights on cryptocurrency, blockchain, and digital assets. Our content is created by experienced researchers and analysts who follow strict editorial standards focused on accuracy, transparency, and credibility. Every article is carefully reviewed and verified using trusted sources and current market data. We provide unbiased analysis and timely updates covering everything from emerging crypto projects to major industry developments.