Date: Sun, Dec 21 2025 | 10:26 AM GMT
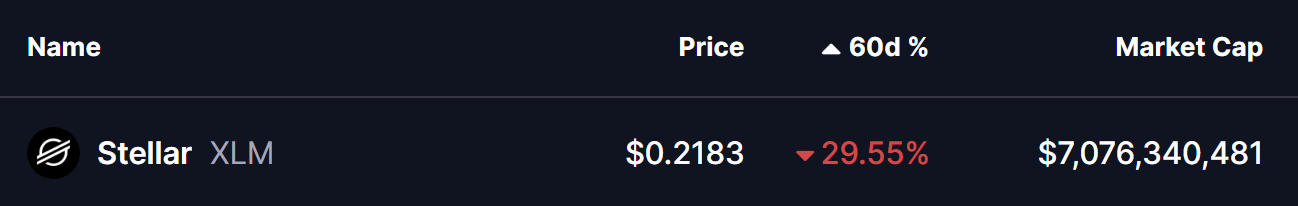
The broader cryptocurrency market has continued to struggle with uneven and choppy price action over the past several weeks, a phase that began after the sharp sell-off on October 10. That correction pushed Ethereum (ETH) lower by nearly 26% over the last 60 days, keeping sustained pressure across the altcoin market. Stellar (XLM) has been no exception, remaining under selling pressure as risk appetite across the sector stays muted.
XLM is down more than 29% over the past two months, but beneath the surface, the weekly chart is starting to reveal a technical structure that could lay the groundwork for a potential rebound if key levels continue to hold.
Descending Triangle Structure Comes Into Focus
On the weekly timeframe, XLM has been trading within a large descending triangle formation. This pattern is defined by a series of lower highs pressing against a relatively flat support base, reflecting consistent selling pressure from the top while buyers defend the same demand zone below. While descending triangles are often viewed as bearish continuation structures, repeated defenses of the base can also precede sharp upside reactions, particularly when broader market sentiment is already pessimistic.
The chart shows XLM once again pulling back into the critical $0.20–$0.22 support region. This zone has acted as a reliable demand area throughout the year, with each visit producing long lower wicks and swift reactions from buyers. These candle structures suggest that accumulation is taking place, even as price continues to respect the descending trendline from above. Despite months of pressure, sellers have so far been unable to force a decisive breakdown below this floor.
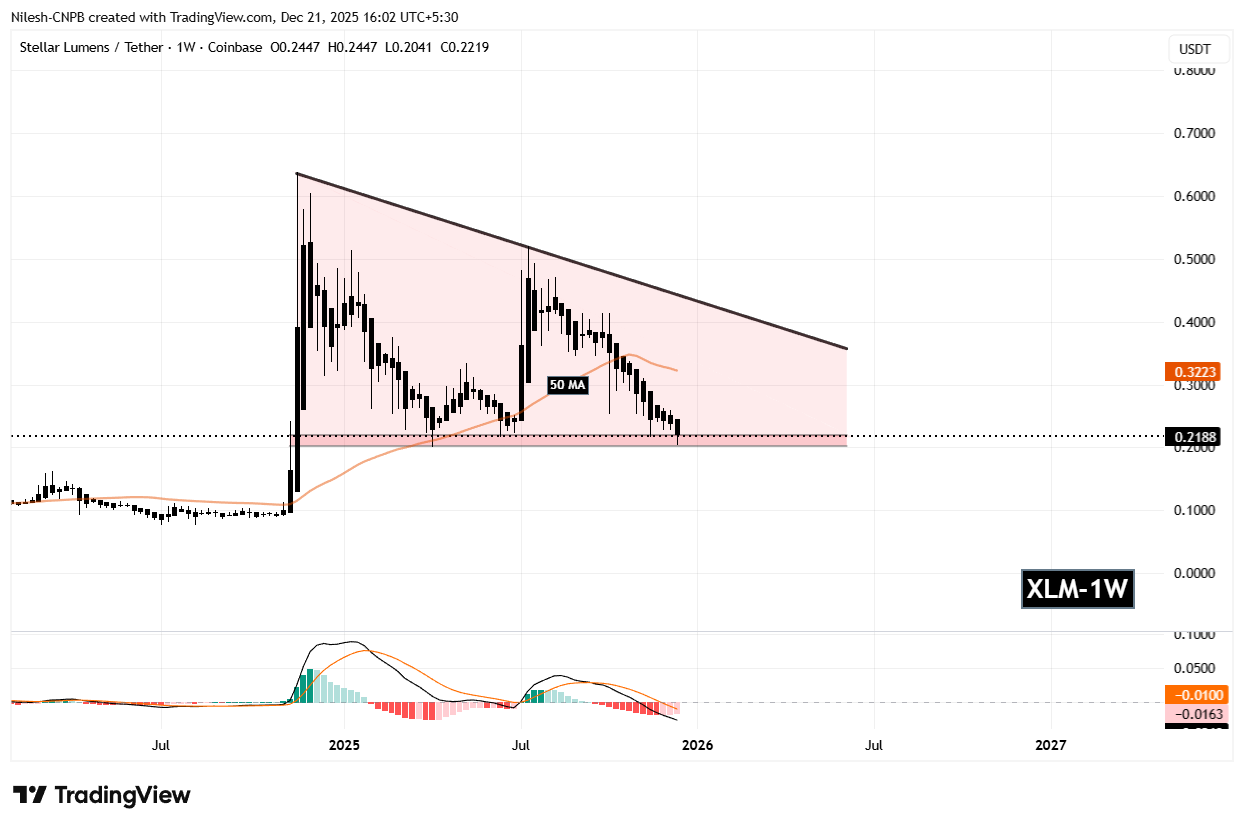
At the same time, XLM is trading below its 50-week moving average, currently near the $0.32 region. This moving average has historically marked important shifts in trend direction, and price behavior around it often determines whether rallies can gain traction or fade quickly.
What’s Next for XLM?
As long as the $0.20–$0.22 support zone remains intact, the probability of a rebound stays firmly on the table. A sustained defense of this level could allow XLM to stabilize and attempt a move back toward the descending trendline resistance near $0.32. This area aligns closely with the 50-week moving average, making it a key zone that bulls would need to reclaim to signal improving market structure.
A decisive weekly close above the descending trendline would be a notable technical development. Such a move would invalidate the bearish bias of the triangle and could open the door for a broader trend reversal, especially if accompanied by rising volume and improving momentum across the wider crypto market.
That said, the downside risk remains clearly defined. A weekly close below the $0.20 support would confirm a breakdown from the triangle and could expose XLM to deeper declines, with the next major support area sitting closer to the $0.13 region.
For now, Stellar sits at a pivotal inflection point. With price pressing against long-term support and sellers struggling to force a breakdown, the coming weeks are likely to be decisive in determining whether XLM can stage a meaningful rebound or extend its broader corrective trend.
Disclaimer: The views and analysis presented in this article are for informational purposes only and reflect the author’s perspective, not financial advice. Technical patterns and indicators discussed are subject to market volatility and may or may not yield the anticipated results. Investors are advised to exercise caution, conduct independent research, and make decisions aligned with their individual risk tolerance.
The opinions and market insights shared on CoinsProbe represent the views of individual authors based on prevailing market conditions at the time of publication. Cryptocurrency investments carry significant risk and volatility. Readers are encouraged to conduct their own research and seek professional financial advice before making investment decisions. CoinsProbe and its contributors do not accept responsibility for financial losses or decisions made based on published content.
CoinsProbe may publish sponsored articles, affiliate links, or promotional collaborations. All sponsored material is clearly labeled to maintain transparency with our audience. Our editorial decisions remain fully independent, and advertising partnerships do not influence reviews, rankings, or published opinions.
Since 2023, CoinsProbe has delivered reliable insights on cryptocurrency, blockchain, and digital assets. Our content is created by experienced researchers and analysts who follow strict editorial standards focused on accuracy, transparency, and credibility. Every article is carefully reviewed and verified using trusted sources and current market data. We provide unbiased analysis and timely updates covering everything from emerging crypto projects to major industry developments.