Date: Tue, Dec 02, 2025 | 03:45 AM GMT
The broader cryptocurrency market is off to a volatile start this week as the downturn has triggered over $518.83 million in liquidations across major exchanges, with long positions taking the biggest hit — more than $398.47 million wiped out.
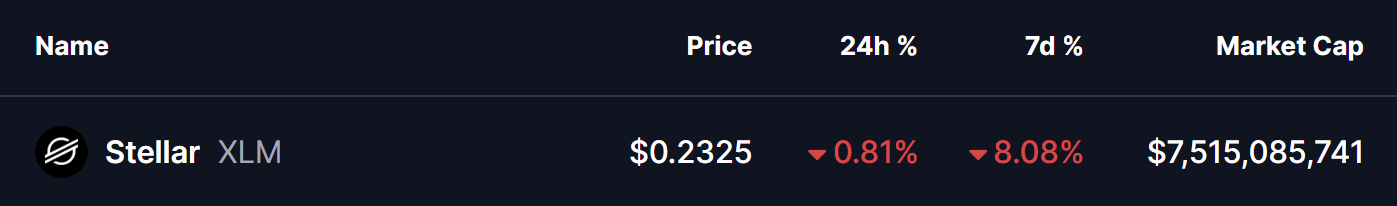
This wave of volatility has pressured major altcoins, and Stellar (XLM) is among those struggling, down more than 8% on the weekly chart. But despite the deep selloff, XLM’s larger technical structure hints that a potential rebound may be forming right at a crucial level.
Descending Triangle in Play
On the weekly timeframe, XLM continues to trade inside a descending triangle pattern. This structure builds when sellers consistently lower the highs while buyers repeatedly defend a key horizontal support zone. While descending triangles often act as bearish continuation patterns, they can also produce strong countertrend rallies — especially when support holds for an extended period.
The current drop has pulled XLM back into its major demand region between $0.20 and $0.24. This area has served as a solid support base for several months, with each test prompting strong pushbacks from buyers. The repeated defense of this zone shows clear signs of accumulation and weakening selling pressure.
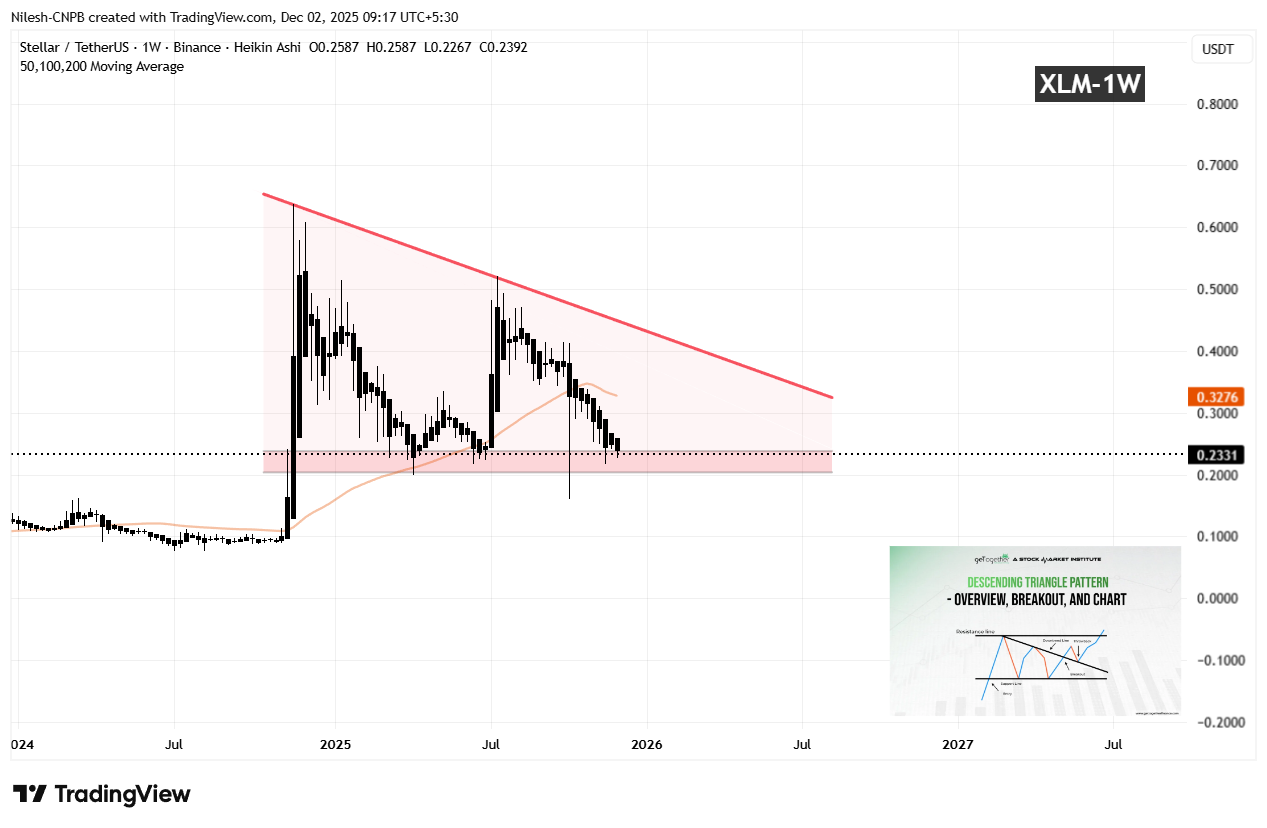
XLM is also sitting below the 100-week moving average near $0.3276. Reclaiming this key moving average would be one of the earliest signals of a momentum shift in favor of the bulls.
What’s Next for XLM?
If buyers continue to defend the $0.20–$0.24 range and manage to push the price back above the 100-week MA, XLM could quickly regain strength. This would pave the way for a retest of the descending trendline resistance near $0.35 — a level that has capped upside movement for nearly a year.
A breakout above the trendline would be a major technical development and could signal the start of a broader reversal, especially if volume picks up on the breakout.
However, the risk remains on the downside. If XLM loses the $0.20 support with a firm close below the range, the descending triangle would break bearishly. In that scenario, the price could fall toward the next macro support around $0.13.
For now, the weekly close will be critical. As long as buyers continue to defend the foundation of the triangle, a rebound remains a realistic and technically supported possibility.
Disclaimer: The views and analysis presented in this article are for informational purposes only and reflect the author’s perspective, not financial advice. Technical patterns and indicators discussed are subject to market volatility and may or may not yield the anticipated results. Investors are advised to exercise caution, conduct independent research, and make decisions aligned with their individual risk tolerance.
The opinions and market insights shared on CoinsProbe represent the views of individual authors based on prevailing market conditions at the time of publication. Cryptocurrency investments carry significant risk and volatility. Readers are encouraged to conduct their own research and seek professional financial advice before making investment decisions. CoinsProbe and its contributors do not accept responsibility for financial losses or decisions made based on published content.
CoinsProbe may publish sponsored articles, affiliate links, or promotional collaborations. All sponsored material is clearly labeled to maintain transparency with our audience. Our editorial decisions remain fully independent, and advertising partnerships do not influence reviews, rankings, or published opinions.
Since 2023, CoinsProbe has delivered reliable insights on cryptocurrency, blockchain, and digital assets. Our content is created by experienced researchers and analysts who follow strict editorial standards focused on accuracy, transparency, and credibility. Every article is carefully reviewed and verified using trusted sources and current market data. We provide unbiased analysis and timely updates covering everything from emerging crypto projects to major industry developments.