
Date: Mon, Dec 01, 2025 | 03:45 AM GMT
The broader cryptocurrency market is facing a sharp selloff at the start of the new week and month as Bitcoin (BTC) and Ethereum (ETH) slide more than 4% over the past 24 hours. This rapid move triggered over $526 million in liquidations, with long positions taking the majority of the damage. Market-wide volatility has dragged down major altcoins, and Hedera (HBAR) has not been spared, falling more than 6%.

But despite the heavy pressure, HBAR’s weekly chart is signaling a technical setup that could lay the foundation for a potential rebound.
Descending Triangle in Play
HBAR has been moving inside a large descending triangle pattern on the weekly timeframe. This structure is characterized by lower highs meeting a flat horizontal support zone. While descending triangles are typically bearish continuation patterns, they can also lead to sharp rebounds when the base support repeatedly holds, especially during periods of high market fear.
The chart shows that HBAR has once again pulled back into the critical support zone between $0.12 and $0.14 — a level that has triggered strong reactions from buyers throughout the year. Each dip into this region has created a wick-heavy candle, reflecting aggressive buying and clear accumulation. Sellers have tightened lower highs, but they have failed to break the major demand zone.
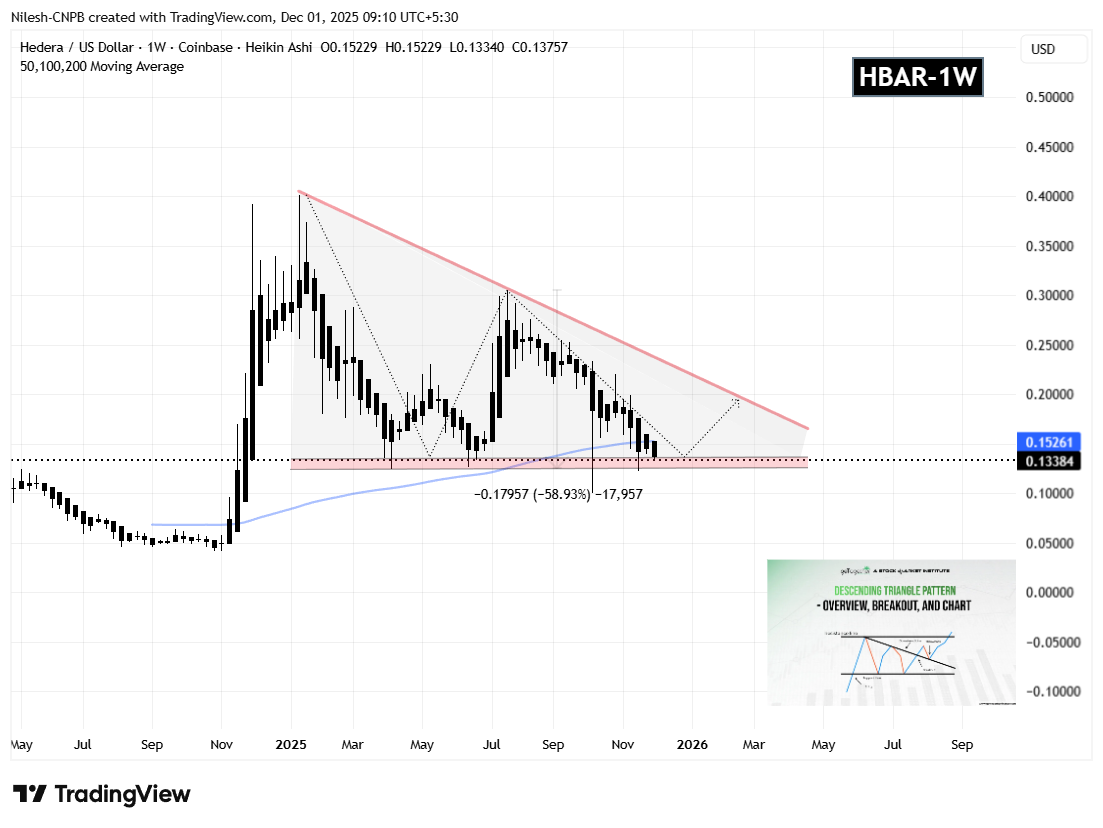
HBAR is currently trading just below the 100-week moving average, which is positioned near $0.1526. This moving average has played a pivotal role in past trend shifts, and reclaiming it would be an early signal that buyers are stepping back in.
What’s Next for HBAR?
If buyers defend the $0.12–$0.14 zone once again and push price back above the 100-week MA, a rebound toward the descending trendline resistance near $0.19 becomes likely. This upper trendline has capped upside attempts for months, and a breakout above it would signal a meaningful shift in market structure.
A decisive weekly close above the trendline would invalidate the descending triangle’s bearish bias and potentially initiate a broader trend reversal — especially if volume expands on the breakout.
However, the risk remains clear. If HBAR loses the $0.12 support with a weekly close below it, the descending triangle would technically break downward. Such a move could expose the price to deeper declines toward the next macro support zone around $0.09.
For now, all eyes are on how HBAR behaves within this major demand region. As long as buyers continue to defend the triangle’s base, a rebound remains a realistic and technically supported scenario.
Disclaimer: The views and analysis presented in this article are for informational purposes only and reflect the author’s perspective, not financial advice. Technical patterns and indicators discussed are subject to market volatility and may or may not yield the anticipated results. Investors are advised to exercise caution, conduct independent research, and make decisions aligned with their individual risk tolerance.
The opinions and market insights shared on CoinsProbe represent the views of individual authors based on prevailing market conditions at the time of publication. Cryptocurrency investments carry significant risk and volatility. Readers are encouraged to conduct their own research and seek professional financial advice before making investment decisions. CoinsProbe and its contributors do not accept responsibility for financial losses or decisions made based on published content.
CoinsProbe may publish sponsored articles, affiliate links, or promotional collaborations. All sponsored material is clearly labeled to maintain transparency with our audience. Our editorial decisions remain fully independent, and advertising partnerships do not influence reviews, rankings, or published opinions.
Since 2023, CoinsProbe has delivered reliable insights on cryptocurrency, blockchain, and digital assets. Our content is created by experienced researchers and analysts who follow strict editorial standards focused on accuracy, transparency, and credibility. Every article is carefully reviewed and verified using trusted sources and current market data. We provide unbiased analysis and timely updates covering everything from emerging crypto projects to major industry developments.