Date: Sat, May 10, 2025 | 10:58 AM GMT
The cryptocurrency market continues to build on its recent strength, with Bitcoin (BTC) and Ethereum (ETH) leading the charge. BTC has crossed the $103K mark, while ETH has soared more than 52% in the past 30 days, now trading near $2,400 — its highest level in months. This bullish wave is spilling into altcoins too, including Cosmos (ATOM).
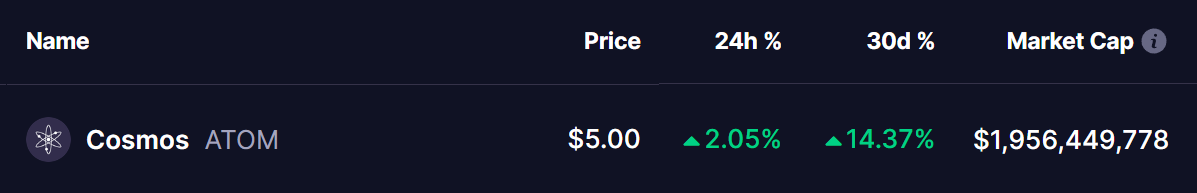
ATOM is currently up over 14% in its monthly gain and now trading near $5. The altcoin is showing strong bullish structure — and based on the current chart, this rally might just be getting started.
Double Bottom Pattern Signal
A closer look at the daily chart reveals a highly promising technical structure — a double bottom pattern, a bullish reversal signal that often emerges at the tail-end of prolonged downtrends.
The first bottom of this pattern formed back in April 2024, after ATOM was rejected near the $10.69 mark, leading to a brutal selloff. After bottoming out, ATOM staged a powerful 190% rally, once again peaking around $10.69 in December. However, that rally eventually ran out of steam, and ATOM retraced nearly 68%, revisiting the critical support level around $3.66 — establishing the second bottom.
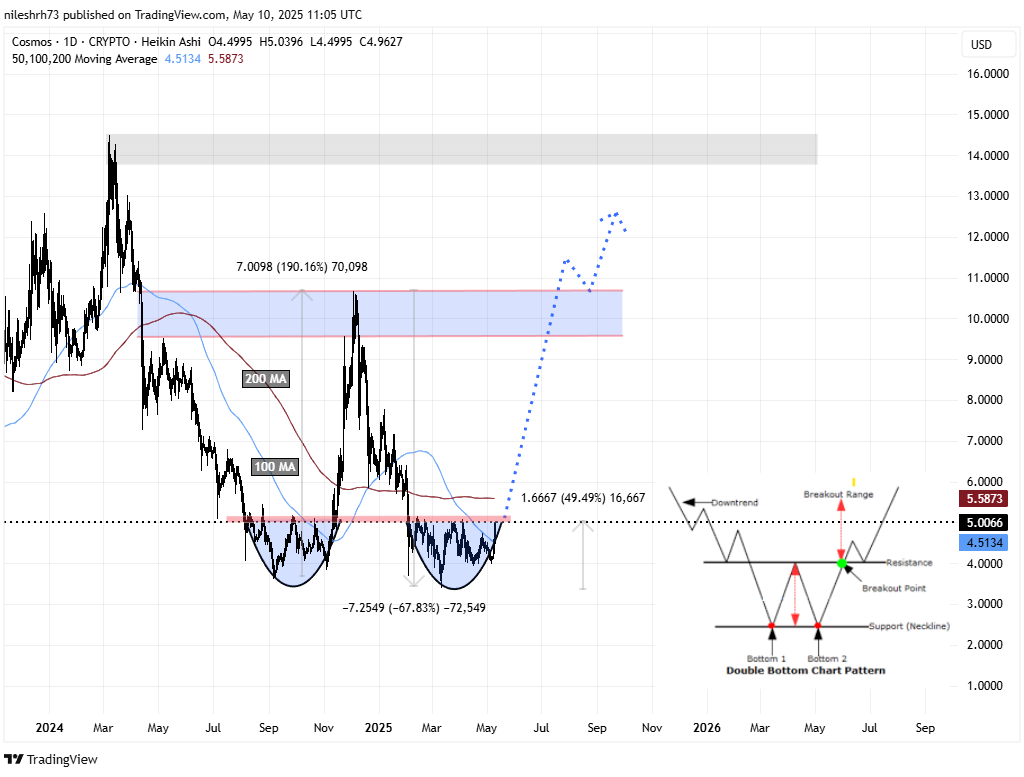
Following this important support retest, ATOM bounced sharply, surging over 49% and currently trading near $5. This current recovery strongly resembles its previous move — with price now reclaiming its 100-day moving average (MA) and knocking on the door of the red resistance zone once again.
What’s Next for ATOM?
Right now, the structure is echoing the setup from the first bottom rally. ATOM has already reclaimed its 100-day MA and is now attempting a breakout from the horizontal resistance zone near $5.19.
If bullish momentum persists and ATOM manages to decisively break above this level, the next key resistance to watch is the 200-day MA, currently sitting at $5.58. A breakout above this level would likely confirm a full trend reversal, opening the doors to a potential rally toward the neckline zone at $10.69 — which represents a 112% upside from the current price.

Disclaimer: This article is for informational purposes only and not financial advice. Always conduct your own research before investing in cryptocurrencies.
The opinions and market insights shared on CoinsProbe represent the views of individual authors based on prevailing market conditions at the time of publication. Cryptocurrency investments carry significant risk and volatility. Readers are encouraged to conduct their own research and seek professional financial advice before making investment decisions. CoinsProbe and its contributors do not accept responsibility for financial losses or decisions made based on published content.
CoinsProbe may publish sponsored articles, affiliate links, or promotional collaborations. All sponsored material is clearly labeled to maintain transparency with our audience. Our editorial decisions remain fully independent, and advertising partnerships do not influence reviews, rankings, or published opinions.
Since 2023, CoinsProbe has delivered reliable insights on cryptocurrency, blockchain, and digital assets. Our content is created by experienced researchers and analysts who follow strict editorial standards focused on accuracy, transparency, and credibility. Every article is carefully reviewed and verified using trusted sources and current market data. We provide unbiased analysis and timely updates covering everything from emerging crypto projects to major industry developments.