
Date: Tue, April 08, 2025 | 06:10 AM GMT
After a brutal “Black Monday” in the markets triggered by President Donald Trump’s aggressive new tariff policies, global financial assets—including crypto—faced a sharp decline. However, Tuesday has brought some relief, with both Bitcoin (BTC) and Ethereum (ETH) bouncing back into green territory, posting gains of 3% and 2% respectively.
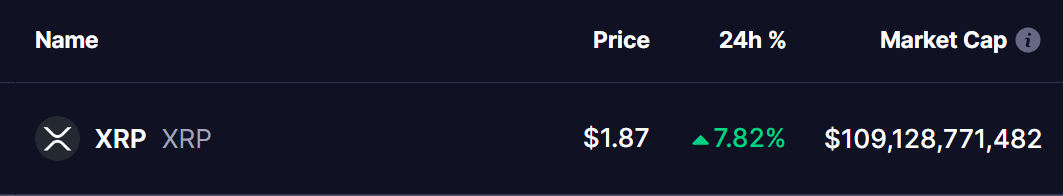
Among altcoins, XRP also showed signs of recovery, jumping over 7% to trade near $1.87. But while this bounce looks promising on the surface, a deeper dive into historical patterns suggests caution might be warranted.
A Bearish Fractal from the Past: DOT vs. XRP
Looking at the current chart of XRP, there’s an eerie resemblance to Polkadot’s (DOT) price action from early 2022. Just like DOT back then, XRP recently formed a head and shoulders pattern—a classic bearish setup.
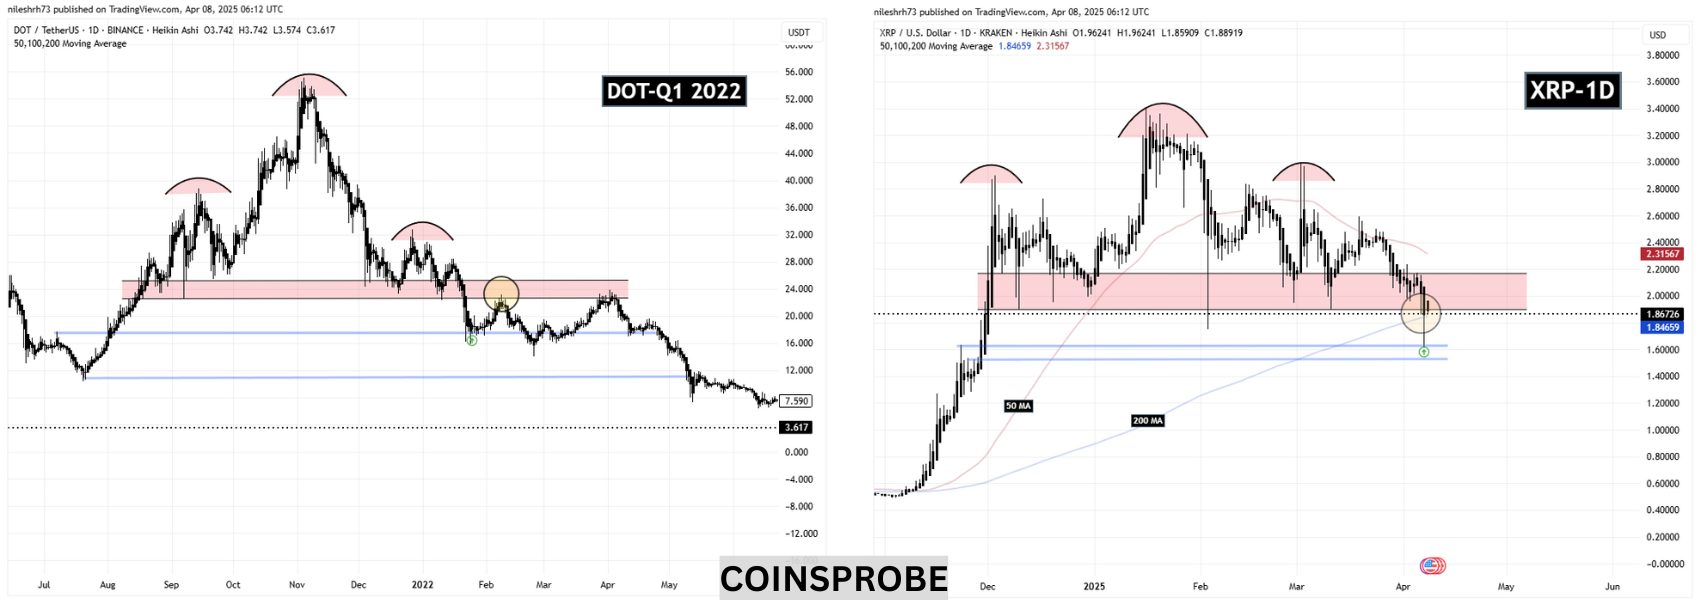
XRP broke down from this pattern after failing to hold its critical neckline support at $1.90, sliding down to test a strong support near $1.61. From there, the price bounced back and is now hovering just below its old neckline, trading near at $1.87.
This is nearly identical to DOT’s price action in Q1 2022. DOT also lost its neckline, bounced temporarily, retested the breakdown zone—and then resumed a steep decline that saw its price spiral down more than 70% in the following months.
Can XRP Avoid DOT’s Fate?
Unless XRP can reclaim and hold above $1.90, the current bounce may just be a short-term relief rally. Adding to concerns is the fact that XRP is now below its 50-day moving average, while only the 200-day MA at $1.84 is offering nearby support.
If XRP follows the same trajectory as DOT did in 2022, the next downside targets could lie between $1.45 to $1.30, as marked by previous demand zones.
Final Thoughts
While the broader crypto market is attempting to stabilize, XRP’s fractal resemblance to DOT’s 2022 breakdown should not be ignored. Traders and investors might want to wait for a clean breakout above the neckline at $1.90 before turning bullish again.

Disclaimer: This article is for informational purposes only and does not constitute financial advice. Always do your own research before making investment decisions.
The opinions and market insights shared on CoinsProbe represent the views of individual authors based on prevailing market conditions at the time of publication. Cryptocurrency investments carry significant risk and volatility. Readers are encouraged to conduct their own research and seek professional financial advice before making investment decisions. CoinsProbe and its contributors do not accept responsibility for financial losses or decisions made based on published content.
CoinsProbe may publish sponsored articles, affiliate links, or promotional collaborations. All sponsored material is clearly labeled to maintain transparency with our audience. Our editorial decisions remain fully independent, and advertising partnerships do not influence reviews, rankings, or published opinions.
Since 2023, CoinsProbe has delivered reliable insights on cryptocurrency, blockchain, and digital assets. Our content is created by experienced researchers and analysts who follow strict editorial standards focused on accuracy, transparency, and credibility. Every article is carefully reviewed and verified using trusted sources and current market data. We provide unbiased analysis and timely updates covering everything from emerging crypto projects to major industry developments.