Date: Sun, April 06, 2025 | 08:30 AM GMT
The cryptocurrency market has been struggling with an extended correction phase, with Ethereum (ETH) recording its worst Q1 decline since 2018—down nearly 45%. This weakness has weighed heavily on altcoins, and Bitcoin Cash (BCH) is no exception.
Over the past 90 days, BCH has dropped by over 37%, shaking out weak hands and pushing investor sentiment to a low. But beneath this gloomy surface, the chart tells a potentially exciting story—a setup that strongly resembles the price structure seen right before BCH’s explosive 2021 rally.
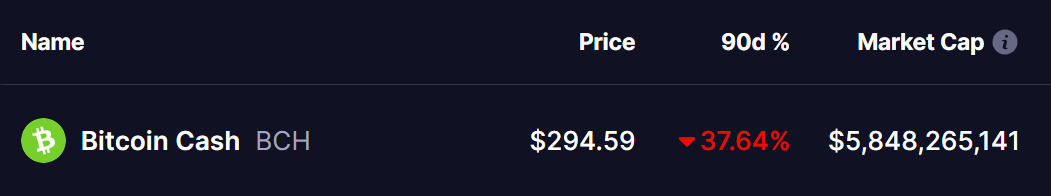
Chart Mirrors 2021 Bull Run Setup
When comparing the current weekly chart to its 2019–2021 pattern, BCH appears to be repeating history. The structure shows a series of rounded bottoms forming beneath a long-term descending trendline—almost identical to the accumulation phase seen before the 2021 breakout, where BCH surged over 700%, from around $200 to over $1,600.
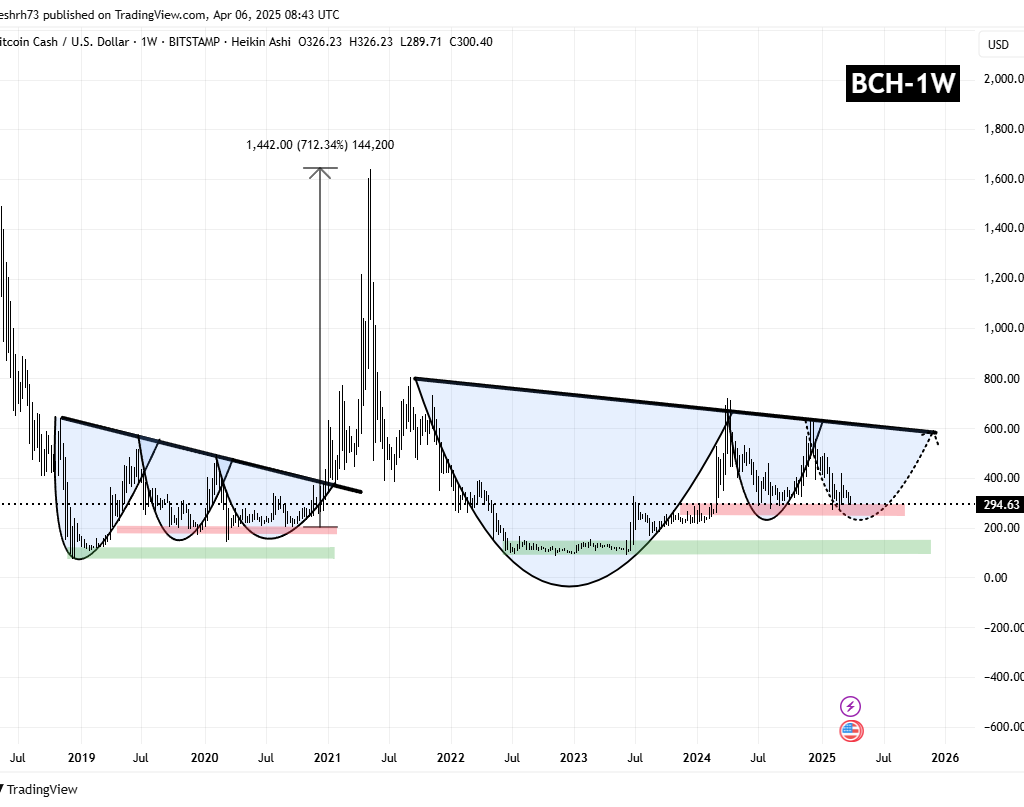
Back then, BCH formed three rounded bottom formations under a falling resistance line. Once that line was broken, momentum exploded to the upside.
Fast-forward to 2025: a similar multi-year resistance trendline has formed, and BCH is once again coiling underneath it—this time around the $250–$300 range. What makes this setup even more compelling is that the current red and green support zones closely mirror the accumulation zones from the pre-2021 breakout.
The red zone (~$250–$300) is acting as a short-term demand area, while the green band has served as a long-term base—just like before BCH’s 700% rally.
Can BCH Repeat History?
From a technical standpoint, BCH is now completing its third rounded bottom, forming a massive cup-like structure on the weekly chart. If the price can hold above the pink accumulation zone ($250–$300) and eventually break out above the descending trendline resistance (~$600), it could trigger a powerful move.
Just like the 2021 breakout, this structure suggests that Bitcoin Cash could be gearing up for a multi-hundred percent rally. A breakout above $600 could set the stage for a rally toward $2,000 or higher—mirroring the previous cycle’s price action.

Disclaimer: This article is for informational purposes only and does not constitute financial advice. Always conduct your own research before investing in cryptocurrencies.
The opinions and market insights shared on CoinsProbe represent the views of individual authors based on prevailing market conditions at the time of publication. Cryptocurrency investments carry significant risk and volatility. Readers are encouraged to conduct their own research and seek professional financial advice before making investment decisions. CoinsProbe and its contributors do not accept responsibility for financial losses or decisions made based on published content.
CoinsProbe may publish sponsored articles, affiliate links, or promotional collaborations. All sponsored material is clearly labeled to maintain transparency with our audience. Our editorial decisions remain fully independent, and advertising partnerships do not influence reviews, rankings, or published opinions.
Since 2023, CoinsProbe has delivered reliable insights on cryptocurrency, blockchain, and digital assets. Our content is created by experienced researchers and analysts who follow strict editorial standards focused on accuracy, transparency, and credibility. Every article is carefully reviewed and verified using trusted sources and current market data. We provide unbiased analysis and timely updates covering everything from emerging crypto projects to major industry developments.