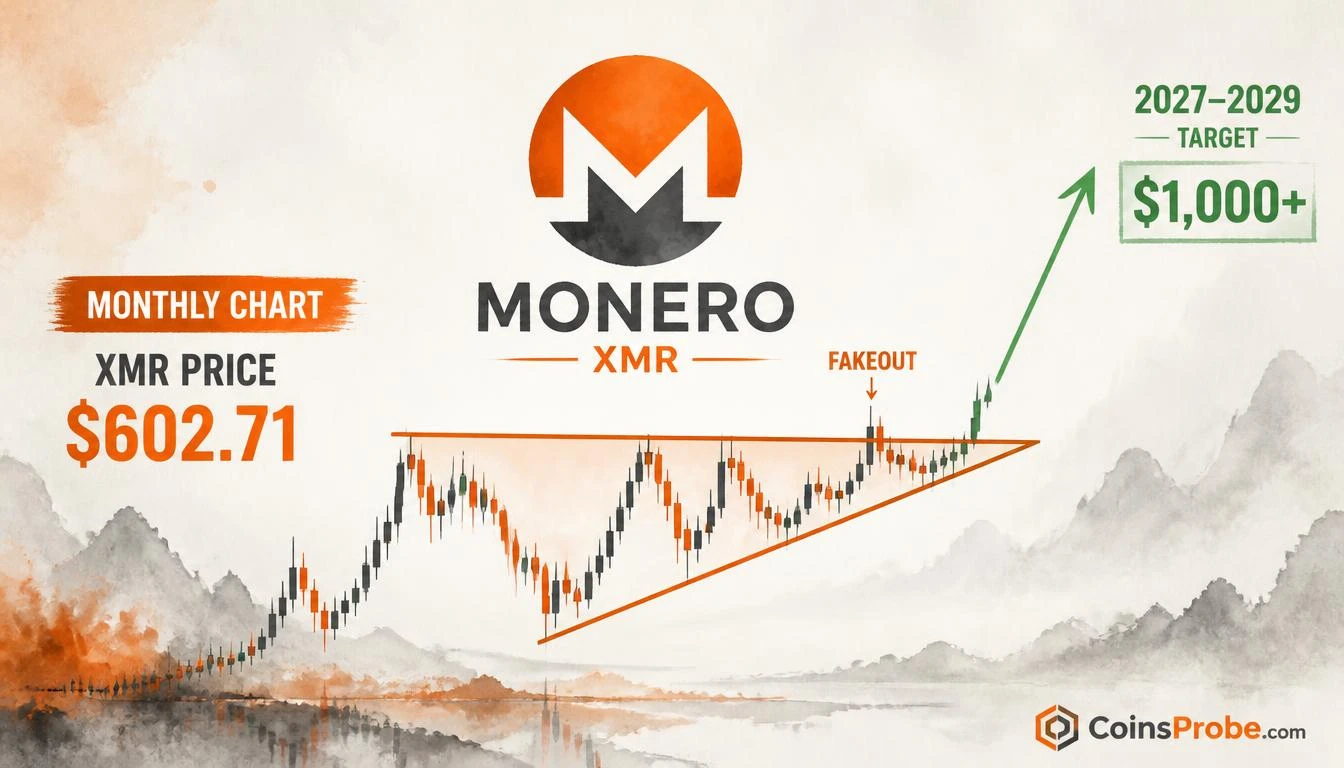

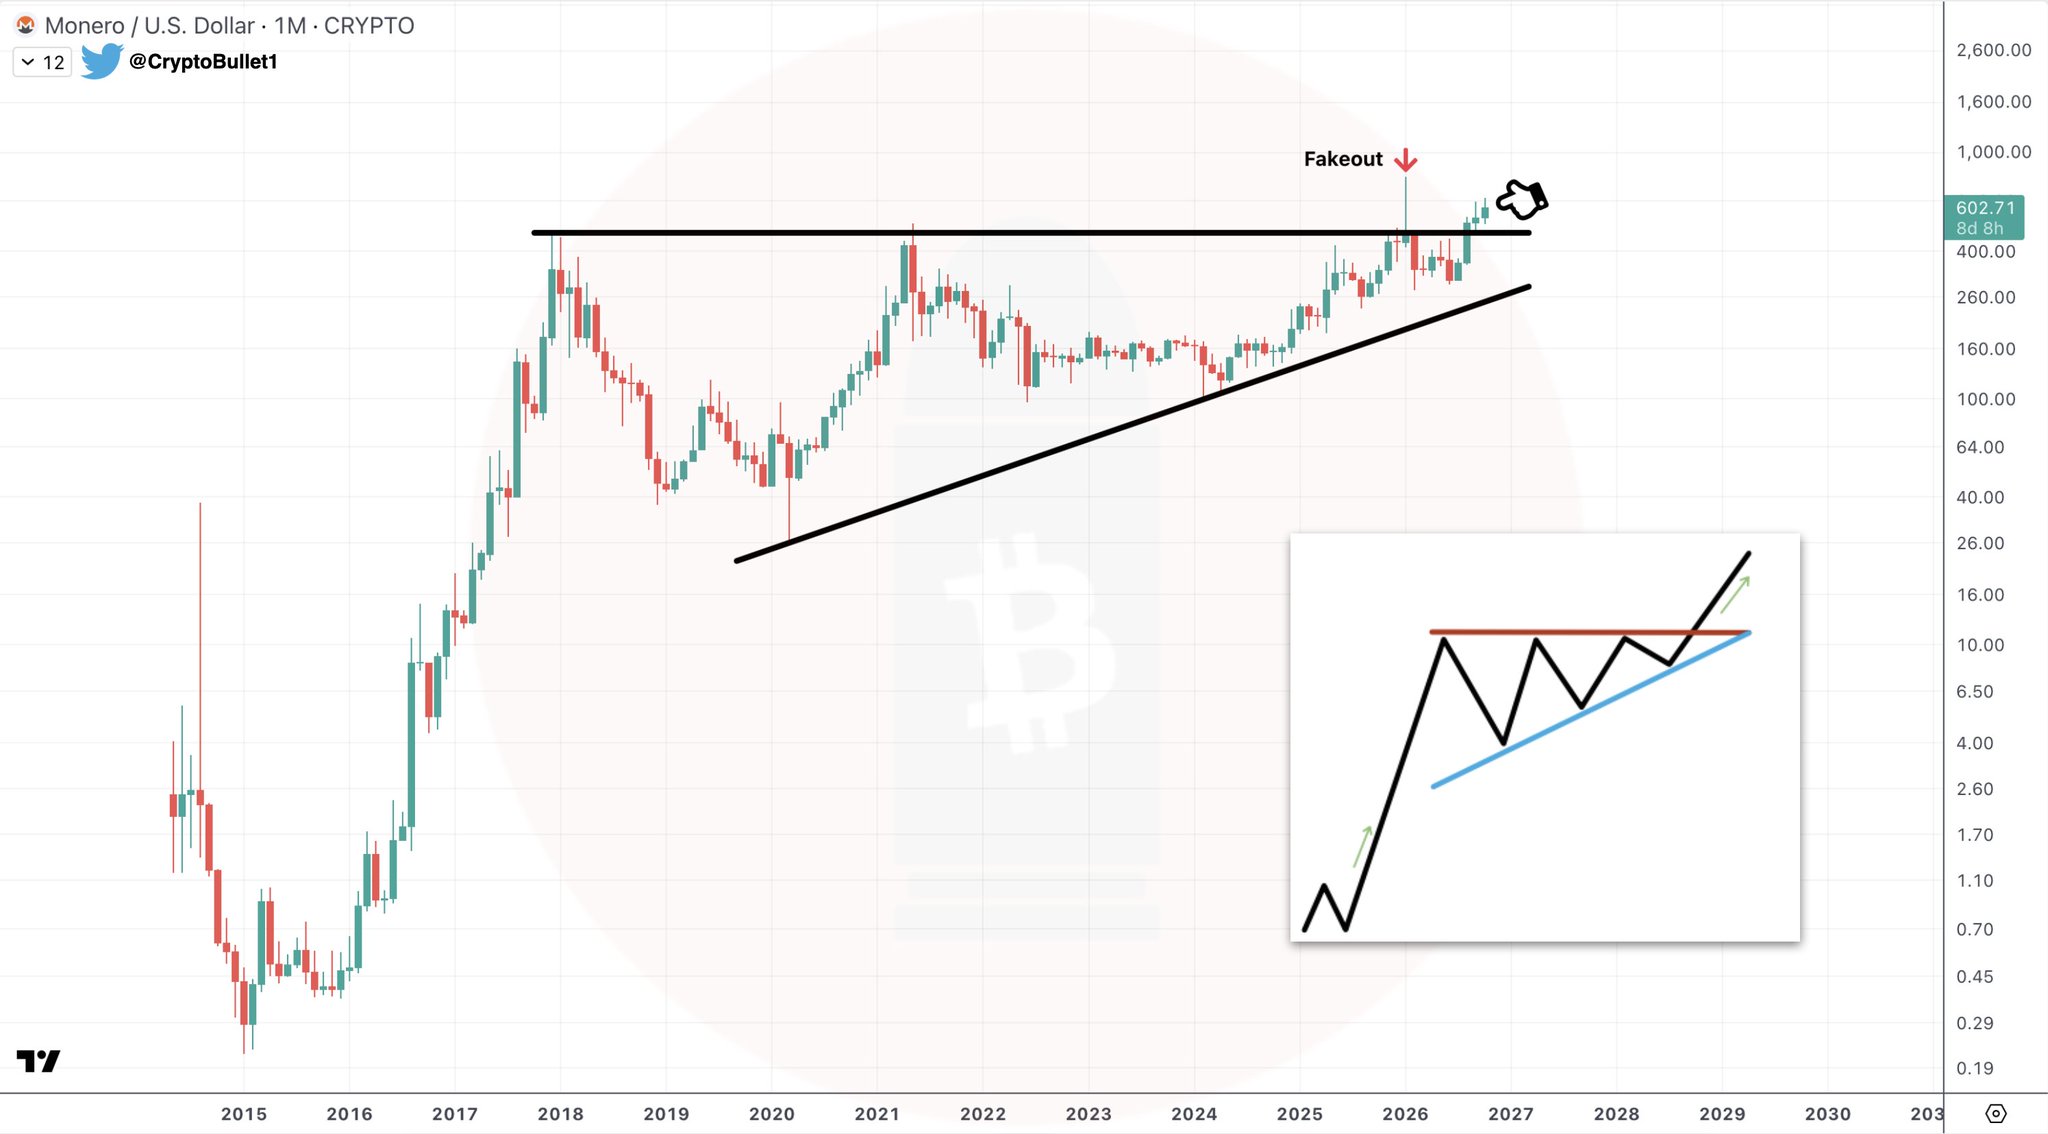
- XMR trades at $602.71 — forming a multi-year ascending triangle on the monthly chart per @CryptoBullet1
- Chart shows a labeled 'Fakeout' above horizontal resistance — a classic precursor to the genuine breakout leg
- @CryptoBullet1 projects breakout continuation into the 2027–2029 timeframe based on pattern structure
- Confirmation requires a sustained monthly close above the horizontal resistance ceiling near current price
Monero (XMR) is trading at approximately $602.71 on the monthly chart — and the structure forming behind that price is one of the more compelling multi-year setups in the privacy-coin sector. Analyst @CryptoBullet1 flagged the chart with a simple but pointed declaration: “$XMR looks great!” — a reaction to a large ascending triangle that has been building across multiple years on the monthly timeframe.
The signal here is not a short-term momentum call. It is a structural chart pattern with a documented breakout schematic — and what makes the current moment notable is the “fakeout” phase that @CryptoBullet1 explicitly labels on the chart, a behavior that has historically preceded the most aggressive legs of ascending triangle breakouts.
The Multi-Year Ascending Triangle — What It Is and What It Shows
An ascending triangle is defined by two converging trendlines: a flat horizontal resistance ceiling and a rising diagonal support floor. Each successive test of the resistance line from a higher low compresses price into a progressively tighter range — building energy for a directional resolution. The pattern is inherently bullish in its construction: buyers are consistently willing to pay more to enter, while sellers defend a fixed ceiling. Eventually, that ceiling breaks.
The monthly XMR/USD chart shared by @CryptoBullet1 shows exactly this structure. The horizontal resistance has been tested repeatedly across what the chart suggests spans a multi-year formation, while the rising support trendline has produced a series of higher lows. The current price of $602.71 sits near the upper boundary of this structure — which is precisely where the “fakeout” event is labeled.
The Fakeout — Why It Matters More Than the Initial Breakout
The “Fakeout” label on the chart is not a warning — it is a stage in the pattern’s resolution. In ascending triangle analysis, a fakeout occurs when price temporarily breaches the horizontal resistance, triggers stop-loss orders on both sides, and then pulls back below the level. This shakeout of weak hands and over-leveraged positions is, historically, what precedes the genuine breakout leg — the one that sustains above resistance with volume and momentum.
@CryptoBullet1’s inset diagram illustrates this explicitly: a spike above the resistance ceiling, a pullback, and then a resumed upward move that constitutes the actual breakout continuation. The analyst’s annotation places the projected breakout resolution in the 2027–2029 timeframe, reflecting the multi-year scale of the base that has been built. This is not a trade for days or weeks — it is a macro structural thesis playing out on monthly candles.
Privacy coins as a category have historically moved in extended cycles. Monero’s prior major breakouts — when the underlying triangle or range resolved — produced moves measured not in percentages but in multiples. The monthly log-scale price axis on the chart, which runs from sub-$1 levels up through $2,600, contextualizes how large the prior range of XMR’s price history has been. The current formation sits in the upper half of that historical range, not at a generational low, which means the pattern’s breakout target would need to be assessed relative to the structural resistance levels visible above — levels the chart’s own price axis extends toward at $1,000, $1,600, and $2,600.
For broader context on macro cycle positioning — which is directly relevant to a multi-year thesis like this — Bitcoin Is Only 40% Through Its Recovery — Every Cycle Says More Time Ahead provides relevant cycle-length framing that applies across the broader crypto asset class.
What the Pattern Requires for Confirmation
The ascending triangle, at this stage, has not produced a confirmed monthly breakout. The fakeout phase — while structurally normal and often a constructive precursor — means XMR needs to reclaim and sustain a monthly close above the horizontal resistance ceiling to validate the bullish resolution @CryptoBullet1 is anticipating.
The critical distinction: an intraday or weekly spike above resistance does not confirm the pattern. A sustained monthly close above the resistance ceiling — the flat upper boundary of the triangle — is the condition that would mark the fakeout phase as complete and the genuine breakout as underway. Until that monthly close prints, the fakeout remains an open structure.
On the downside, the rising support trendline of the ascending triangle acts as the structural invalidation level. A monthly close below that diagonal — wherever it intersects at the time of a given candle — would damage the ascending triangle thesis and suggest the pattern is resolving to the downside rather than up. @CryptoBullet1’s chart does not label a specific invalidation price, but the rising support line is visually traceable on the monthly chart.
Bullish Scenario
A sustained monthly close above the horizontal resistance ceiling confirms the fakeout phase as complete. Per @CryptoBullet1’s projected timeline, the breakout continuation targets the 2027–2029 window, with the monthly log-scale chart showing open air toward the $1,000–$2,600 range — levels that represent the upper historical price axis visible on the chart. Macro cycle tailwinds, as noted in Bitcoin’s Midterm Election Cycle analysis, would support this thesis if the broader market enters an accelerative phase in that window.
Bearish Scenario
A monthly close below the rising diagonal support trendline invalidates the ascending triangle structure. This would suggest the multi-year base has failed to produce a bullish resolution and opens the possibility of a retest of lower structural supports visible on the monthly chart — an outcome @CryptoBullet1’s current framing does not anticipate but which the pattern’s mechanics require as the failure case.
Privacy Coins and the Macro Backdrop
Monero’s price action does not occur in isolation. The research context shows no major protocol upgrade or exchange listing accompanying the current move — meaning the chart structure, not a fundamental catalyst, is the primary driver of @CryptoBullet1’s bullish read. That makes the pattern itself the thesis, and pattern theses live and die on the confirmation criteria outlined above.
Privacy coin rotation — where capital moves into XMR, Zcash, and related assets during specific market phases — has historically coincided with periods of broader altcoin outperformance. The research notes a modest uptick in shielded transaction volume alongside the recent price action, which provides a minor on-chain supporting data point but is not the primary argument here.
The macro context is also worth noting: macro headwinds in the broader crypto market could delay the timeline for any ascending triangle resolution, as monthly-candle patterns are sensitive to sustained macro pressure. @CryptoBullet1’s 2027–2029 projection implicitly assumes the macro environment resolves favorably over that window.
The setup @CryptoBullet1 identifies is structural, multi-year, and currently in the fakeout phase of an ascending triangle on XMR’s monthly chart. The pattern’s bullish resolution requires a sustained monthly close above the horizontal resistance near the current $602 area — that close is the single most important confirmation signal for this thesis. Until it prints, the structure is valid but unconfirmed.
Watch the monthly close above the horizontal resistance ceiling as the trigger that converts the fakeout into a confirmed ascending triangle breakout — the level that separates the pattern’s bullish promise from its actual delivery.
Frequently Asked Questions
What is an ascending triangle fakeout and why does it matter for XMR?
What price close would confirm the XMR ascending triangle breakout?
What is @CryptoBullet1’s projected timeline for XMR’s breakout move?
What would invalidate the XMR ascending triangle thesis?
Source: Cryptobullet1 · Published by CoinsProbe Markets Desk
The opinions and market insights shared on CoinsProbe represent the views of individual authors based on prevailing market conditions at the time of publication. Cryptocurrency investments carry significant risk and volatility. Readers are encouraged to conduct their own research and seek professional financial advice before making investment decisions. CoinsProbe and its contributors do not accept responsibility for financial losses or decisions made based on published content.
CoinsProbe may publish sponsored articles, affiliate links, or promotional collaborations. All sponsored material is clearly labeled to maintain transparency with our audience. Our editorial decisions remain fully independent, and advertising partnerships do not influence reviews, rankings, or published opinions.
Since 2023, CoinsProbe has delivered reliable insights on cryptocurrency, blockchain, and digital assets. Our content is created by experienced researchers and analysts who follow strict editorial standards focused on accuracy, transparency, and credibility. Every article is carefully reviewed and verified using trusted sources and current market data. We provide unbiased analysis and timely updates covering everything from emerging crypto projects to major industry developments.