
- Bitcoin's 'Midterm Election Curse' is 4-for-4 — corrections of −27% to −72% in every midterm year since 2010
- Q4 returns after midterm corrections ranged from +391% (2010) to −42.16% (2018) — direction is not predictable from the pattern alone
- Analyst Ali Martinez (@alicharts) identifies $73,000 — the short-term holder cost basis — as the key seller exhaustion zone to watch
- Next US midterm election is November 3, 2026 — the historical pressure point for election-related Bitcoin volatility
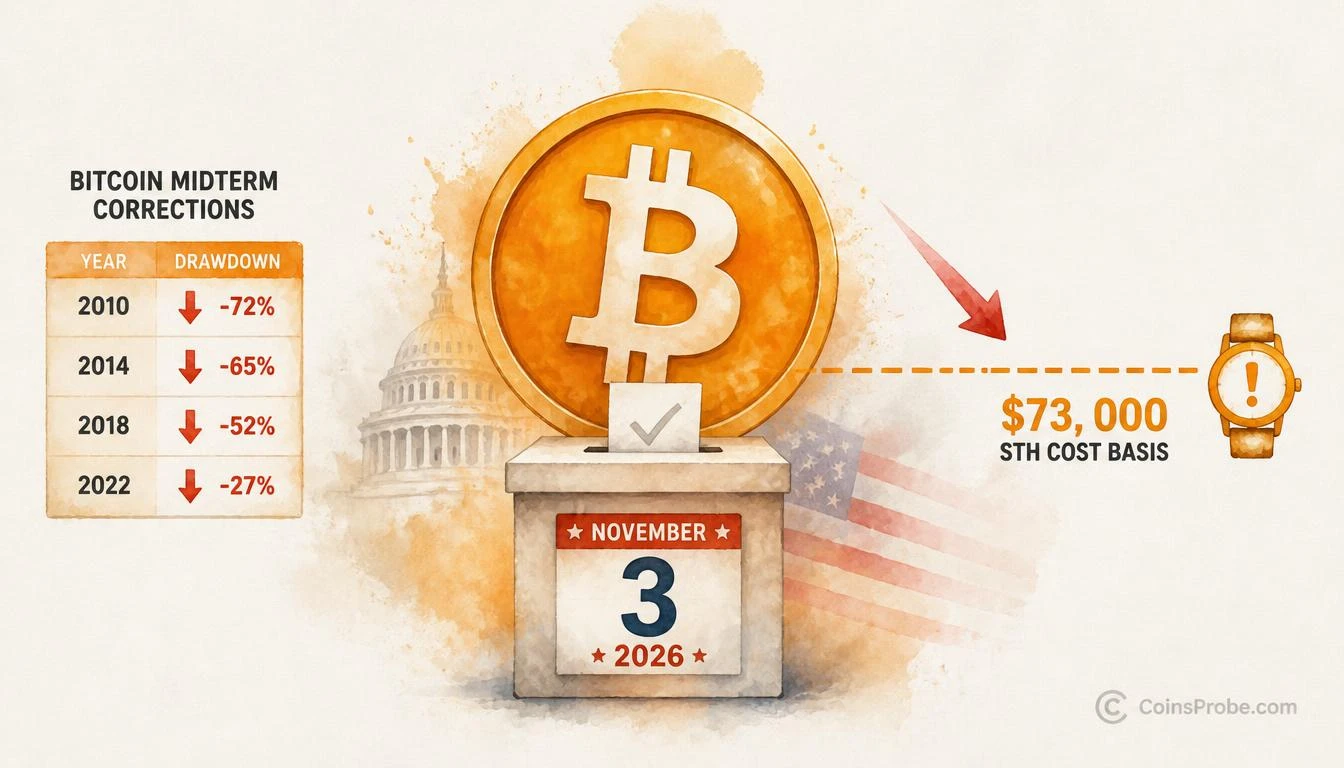
Bitcoin is approaching one of its most historically consistent stress points — the US midterm election cycle. With midterms scheduled for November 3, 2026, and Bitcoin trading near all-time high territory, crypto analyst Ali Martinez (@alicharts) has issued a direct warning: every midterm election cycle since 2010 has produced a significant Bitcoin correction, and the critical support level traders need to watch is the short-term holder cost basis at $73,000.
Martinez, widely followed for his on-chain and cycle analysis, characterizes this pattern as the “Midterm Election Curse” — a recurring sequence where Bitcoin experiences pronounced volatility and downside risk around US midterm elections. His October 23, 2026 post lays out four complete cycles of historical data, each showing corrections of varying severity in midterm years, followed by wildly divergent Q4 outcomes. The $73,000 level — the current short-term holder cost basis — is the zone Martinez identifies as the point where seller exhaustion could emerge before any meaningful recovery.
The Midterm Election Curse — Four Cycles of Evidence
The historical record Martinez cites is unambiguous in one direction: Bitcoin has corrected in every midterm election year without exception. What varies is the magnitude.
| Midterm Year | Correction | Q4 Return |
|---|---|---|
| 2010 | −72% | +391% |
| 2014 | −65% | −16.70% |
| 2018 | −52% | −42.16% |
| 2022 | −27% | −14.75% |
Bitcoin Midterm Election Cycle Data | Source: @alicharts (X)
Several things stand out in this dataset. First, the corrections themselves have been shrinking in magnitude across cycles — from −72% in 2010 to −27% in 2022. This is consistent with Bitcoin’s growing market capitalization and liquidity depth making extreme percentage drawdowns progressively harder to sustain. A −72% move in 2010 Bitcoin required moving a market that was a fraction of today’s size. A comparable drawdown today would represent a multi-trillion-dollar destruction of market value — structurally less probable, though not impossible.
Second — and this is the part Martinez flags as the genuine uncertainty — the Q4 outcomes after midterm corrections are almost perfectly unpredictable from the correction alone. 2010’s −72% correction was followed by a +391% Q4 explosion. 2022’s comparatively shallow −27% correction was followed by another −14.75% quarter. The correction magnitude does not determine the subsequent direction.
This is critical context for traders currently positioned around the November 3 date. The historical record confirms volatility and downside pressure are probable. It does not confirm a particular Q4 direction.
$73,000 — The Short-Term Holder Cost Basis
The specific level Martinez identifies as the zone to watch is $73,000 — the current short-term holder (STH) cost basis. This is not an arbitrary technical level. The short-term holder cost basis represents the average acquisition price of all Bitcoin moved on-chain within the last 155 days. When Bitcoin trades above this level, recent buyers are in profit. When it trades below it, short-term holders are underwater — a condition that historically precedes either capitulation selling or accumulation by longer-term investors.
Martinez’s thesis is that if the midterm-related volatility drives Bitcoin into a test of $73,000, that zone could serve as the point of seller exhaustion — the level where short-term holders who want to exit have already exited, and where the structural supply overhang clears. This framing is consistent with how the STH cost basis has functioned in prior cycles: it is not automatically a floor, but it is the most watched on-chain reference level for identifying whether selling pressure has been absorbed.
It is worth noting the current macro environment compounds the election cycle pressure. As covered in our recent analysis, Bitcoin is already navigating macro headwinds as Brent Crude holds above $100 — an inflationary signal that historically has created risk-off pressure across speculative assets. The midterm election overhang layered on top of elevated energy prices creates a more complex backdrop than any single prior midterm cycle offered.
What the Q4 Data Actually Tells You — And What It Doesn’t
The four-cycle dataset contains two recoveries and two continued declines in Q4 after midterm corrections. That is a 50/50 split on direction — statistically insufficient to derive a directional edge for 2026. What the data does confirm with four-for-four consistency is the correction itself happening around the midterm period. Traders positioning for the November 3 event should treat the correction probability as high-confidence and the subsequent Q4 direction as genuinely uncertain.
The outlier case worth understanding is 2010. The −72% correction that year was followed by a +391% Q4 because Bitcoin was at an extremely early adoption stage — a small supply shock or demand event could produce exponential percentage returns from a tiny base. That dynamic does not apply to 2026 Bitcoin. Any mechanical extrapolation of 2010’s Q4 to the current cycle would be analytically invalid.
On the long-term holder side, recent data shows accumulation is ongoing but decelerating. As we noted in our Bitcoin LTH Net Position Change analysis, long-term holders have added +1.27M BTC to their positions — but the pace of that accumulation is slowing. This is a relevant context layer: if short-term holders face pressure at $73,000, the question of whether long-term holders step in as buyers at that level becomes the structural determinant.
November 3, 2026 — The Specific Trigger Date
Martinez is explicit that the next US midterm election falls on November 3, 2026. The historical pattern does not require the correction to begin precisely on election day — the 2022 correction, for example, was distributed across the months surrounding the November midterms. What the pattern shows is that the midterm calendar year as a whole contains the correction, with election proximity acting as the pressure point.
Traders monitoring this signal should track the $73,000 level as Martinez’s stated watch zone. A sustained hold above $73,000 through and after the election would suggest the midterm-related selling has been absorbed. A decisive break below $73,000 with follow-through would open the possibility of a deeper correction in line with the historical pattern — though whether it resembles 2022’s −27% or something more severe is not determinable from cycle data alone.
Bullish Scenario
Bitcoin holds above $73,000 through the November 3 election, seller exhaustion is confirmed at the short-term holder cost basis, and Q4 2026 tracks the 2010 precedent of a sharp post-correction recovery. Long-term holder accumulation accelerating would be the confirmation signal.
Bearish Scenario
Bitcoin breaks decisively below $73,000 on election-related volatility, short-term holders capitulate, and Q4 2026 follows the 2014, 2018, or 2022 precedent — all of which produced negative Q4 returns ranging from −14.75% to −42.16% after midterm corrections.
The midterm election pattern is four-for-four on producing corrections. Whether $73,000 holds as seller exhaustion or breaks as the next leg down is the single most important question in Martinez’s framework. That level, and what happens around November 3, will determine which side of the Q4 outcome ledger 2026 lands on.
Watch $73,000 — the short-term holder cost basis — as the structural line between absorbed selling pressure and a deeper midterm correction.
Frequently Asked Questions
What is Bitcoin’s ‘Midterm Election Curse’ and how consistent is the pattern?
Why is $73,000 the critical level for Bitcoin around the 2026 midterms?
Does the midterm pattern predict what happens to Bitcoin in Q4 after the correction?
Are midterm Bitcoin corrections getting smaller over time?
Source: Ali Charts · Published by CoinsProbe Markets Desk
The opinions and market insights shared on CoinsProbe represent the views of individual authors based on prevailing market conditions at the time of publication. Cryptocurrency investments carry significant risk and volatility. Readers are encouraged to conduct their own research and seek professional financial advice before making investment decisions. CoinsProbe and its contributors do not accept responsibility for financial losses or decisions made based on published content.
CoinsProbe may publish sponsored articles, affiliate links, or promotional collaborations. All sponsored material is clearly labeled to maintain transparency with our audience. Our editorial decisions remain fully independent, and advertising partnerships do not influence reviews, rankings, or published opinions.
Since 2023, CoinsProbe has delivered reliable insights on cryptocurrency, blockchain, and digital assets. Our content is created by experienced researchers and analysts who follow strict editorial standards focused on accuracy, transparency, and credibility. Every article is carefully reviewed and verified using trusted sources and current market data. We provide unbiased analysis and timely updates covering everything from emerging crypto projects to major industry developments.