
- Bitcoin is trading at $81,647 (+0.06% 24h) with a $1.64T market cap as CryptoQuant flags a key cycle timing signal
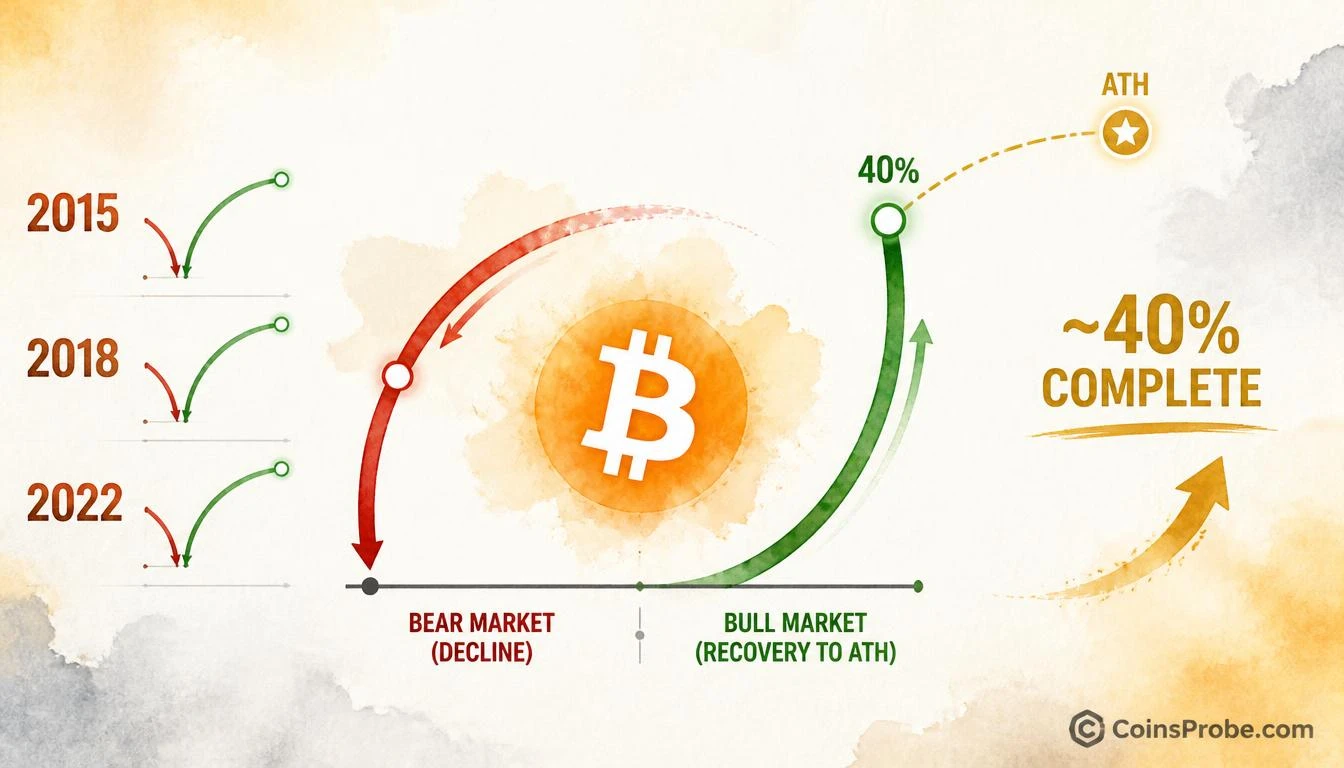
- CryptoQuant's @cryptovizart shows Bitcoin's ATH recovery takes ~2x longer than the bear decline — consistent across 2015, 2018, and 2022
- Current cycle is only ~40% complete on the recovery timeline, per CryptoQuant's ratio analysis
- No price target named — the signal is time-domain: more than half the recovery duration remains by historical precedent
Bitcoin is trading at $81,647 — up 0.06% in the past 24 hours — with a market cap of $1.64 trillion. But the price alone tells only half the story. The more important signal right now is not where Bitcoin is, but how far along in its recovery it actually is. According to CryptoQuant’s analysis, the answer is: not very.
CryptoQuant’s analyst @cryptovizart, publishing through the official @cryptoquant_com account on October 23, 2026, identifies a structural pattern that has held without exception across every Bitcoin cycle since 2015: the recovery from bear market lows back to a new all-time high consistently takes approximately 2x longer than the preceding decline into the bear market. And the current cycle, by CryptoQuant’s measure, is only ~40% of the way through that recovery arc.
The Ratio — Consistent Across 2015, 2018, and 2022
CryptoQuant’s @cryptovizart examined three complete Bitcoin cycles — the 2015 bear market and recovery, the 2018 collapse and rally back to ATH, and the 2022 drawdown and climb — and in each case, the recovery phase required roughly twice as many months as the fall. This is not a rough approximation or a single data point. It is a pattern that has repeated across three independent cycles spanning more than a decade of market structure.
The mechanism is intuitive once stated: bear markets compress rapidly as forced sellers, leveraged longs, and macro fear converge simultaneously, accelerating downside. Recoveries, by contrast, are built on gradual re-accumulation, returning retail confidence, institutional positioning, and fundamental catalyst layering — processes that take time to compound. The asymmetry between a fast collapse and a slow rebuild is not unique to Bitcoin, but the consistency of the 2:1 ratio across three cycles is what makes this signal structurally meaningful.
Where This Cycle Stands — ~40% Complete
Applying that 2:1 ratio to the current cycle, CryptoQuant’s analysis concludes that Bitcoin is approximately 40% of the way through its recovery duration — meaning the majority of the recovery timeline, measured in time rather than price, still lies ahead. The implication is direct: traders anchoring to price alone and expecting a rapid resolution to new all-time highs may be significantly underestimating how much runway remains in this cycle.
This framing matters particularly for those tracking Bitcoin’s position relative to its previous all-time high. The Bitcoin Power Law Oscillator, currently at 34.5, maps the +100 threshold to $157,800 — a long-range target consistent with a full cycle completion. CryptoQuant’s time-ratio analysis suggests that reaching that destination is less about a single catalyst and more about the duration of the process itself.
Why the 2x Ratio Has Held — The Structural Logic
Each of the three cited cycles produced the same temporal asymmetry for compounding structural reasons. In 2015, Bitcoin’s bear market lasted roughly 14 months from peak to trough; the subsequent recovery to a new ATH took approximately 26 months. In 2018, the collapse from the December 2017 high to the December 2018 low spanned roughly 12 months; the full recovery to a new ATH in late 2020 took approximately 24 months. The 2022 cycle followed the same pattern: a sharp bear phase followed by a recovery arc of approximately double the duration.
CryptoQuant does not present this as a mechanical prediction. The ratio describes a temporal regularity, not a price trajectory. What it does say with clarity is that markets consistently underestimate how long the recovery phase requires — and that at 40% completion, this cycle has not yet reached its midpoint on the time dimension.
For context on what Bitcoin has already navigated in this recovery, the recent October price action — holding up 1.86% through the calendar’s weakest three-day stretch — is consistent with the gradual, resilience-building character of a cycle that still has distance to cover.
What 40% Completion Implies for Timing
CryptoQuant’s signal is a time-domain observation, not a price call. It does not specify a new ATH price, a specific month of completion, or a catalyst that triggers the next leg. What it establishes is a probability framework grounded in cycle repetition: if the 2:1 recovery-to-bear-market ratio holds for a third consecutive time, the current cycle has more than half its total recovery duration remaining.
That has direct implications for positioning. Investors who entered during the 2022 bear market lows expecting a rapid round-trip to ATH are operating against the historical pattern. The data CryptoQuant cites across 2015, 2018, and 2022 collectively argue that patience — not urgency — is the posture most consistent with prior cycles. The whale distribution seen near $87K earlier in this cycle may itself be a reflection of this dynamic: sophisticated participants trimming into strength knowing the recovery arc is long.
Bullish Scenario
The 2:1 ratio holds for a fourth consecutive cycle. Bitcoin continues its gradual recovery arc, with the remaining ~60% of recovery duration playing out over the coming months. Price progression toward previous ATH levels follows the pattern established in 2015, 2018, and 2022, with no requirement for a single catalyst — just continued time in the recovery phase.
Bearish Scenario
The 40% completion figure overstates progress if macro conditions extend the recovery duration beyond the 2:1 ratio. A deterioration in risk appetite, significant exchange inflows, or structural de-risking could reset the clock — meaning the current cycle takes longer than the historical 2x ratio, not shorter. CryptoQuant’s analysis does not name a price level at which the thesis would be invalidated, as the signal is time-based rather than price-based.
Bitcoin’s recovery-to-ATH has required approximately twice the duration of its preceding bear market in every documented cycle — 2015, 2018, and 2022 — and CryptoQuant’s @cryptovizart places the current cycle at only ~40% of the way through that recovery arc. At $81,647, Bitcoin may look like a market in active recovery. The time-ratio data says it is — but that recovery, by historical precedent, has significantly more runway ahead. Watch the passage of time itself as the primary variable: the ratio argues that cycle completion is measured in months of recovery, not just price distance to the prior ATH.
Frequently Asked Questions
What does CryptoQuant’s 2x recovery ratio actually measure?
What does ‘40% complete’ mean for Bitcoin’s current cycle?
Does the 2:1 ratio give a specific price target or timeline for Bitcoin’s next ATH?
Has this 2:1 recovery ratio ever failed in Bitcoin’s history?
Source: CryptoQuant · Published by CoinsProbe Markets Desk
The opinions and market insights shared on CoinsProbe represent the views of individual authors based on prevailing market conditions at the time of publication. Cryptocurrency investments carry significant risk and volatility. Readers are encouraged to conduct their own research and seek professional financial advice before making investment decisions. CoinsProbe and its contributors do not accept responsibility for financial losses or decisions made based on published content.
CoinsProbe may publish sponsored articles, affiliate links, or promotional collaborations. All sponsored material is clearly labeled to maintain transparency with our audience. Our editorial decisions remain fully independent, and advertising partnerships do not influence reviews, rankings, or published opinions.
Since 2023, CoinsProbe has delivered reliable insights on cryptocurrency, blockchain, and digital assets. Our content is created by experienced researchers and analysts who follow strict editorial standards focused on accuracy, transparency, and credibility. Every article is carefully reviewed and verified using trusted sources and current market data. We provide unbiased analysis and timely updates covering everything from emerging crypto projects to major industry developments.