Date: Thu, July 03, 2025 | 06:22 AM GMT
As Q3 kicks off, the cryptocurrency market is continuing its impressive recovery from Q2, with Ethereum (ETH) leading the charge — surging over 36.5% to trade around $2,575. This broader bullish sentiment has positively impacted many altcoins — and among them, Worldcoin (WLD) is emerging as a potential breakout candidate.
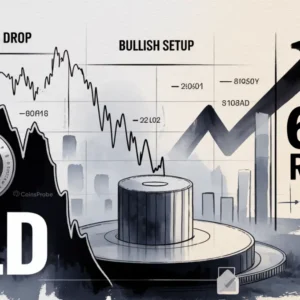
Over the past 90 days, WLD has climbed more than 27%. But what’s turning heads now isn’t just the green candles — it’s the fact that WLD is now mirroring the exact same fractal pattern that recently played out on SEI, a setup that triggered a massive breakout.

WLD Mirrors SEI’s Breakout Setup
The side-by-side chart comparison of SEI and WLD reveals striking similarities.
Just weeks ago, SEI was stuck inside a falling wedge — a classic bullish reversal pattern. Once it broke out of the wedge and cleared both the 100-day and 50-day moving averages (MA), SEI soared by over 76%, validating the setup with a strong confirmation rally.

Now, WLD is playing out the same script.
After spending weeks in a falling wedge, WLD has successfully broken out and made a clean retest. It is currently testing a major resistance — the 100-day MA — a point that matches SEI’s exact setup before its explosive rally. The structure here is almost identical, suggesting that WLD could be next in line for a similar move.
What’s Next for WLD?
All eyes are now on how WLD handles this resistance zone. If WLD can break above its 100-day MA, the next major level to watch will be the 50-day MA sitting near $1.085. A successful breakout above both could open the path toward $1.64 — the next key resistance — representing a potential 70% upside from current levels.
However, it’s important to stay cautious. If WLD gets rejected from these resistance zones and slips back below the breakout trendline, it could signal further consolidation or even delay bullish momentum.
Disclaimer: This article is for informational purposes only and not financial advice. Always do your own research before investing in cryptocurrencies.
The opinions and market insights shared on CoinsProbe represent the views of individual authors based on prevailing market conditions at the time of publication. Cryptocurrency investments carry significant risk and volatility. Readers are encouraged to conduct their own research and seek professional financial advice before making investment decisions. CoinsProbe and its contributors do not accept responsibility for financial losses or decisions made based on published content.
CoinsProbe may publish sponsored articles, affiliate links, or promotional collaborations. All sponsored material is clearly labeled to maintain transparency with our audience. Our editorial decisions remain fully independent, and advertising partnerships do not influence reviews, rankings, or published opinions.
Since 2023, CoinsProbe has delivered reliable insights on cryptocurrency, blockchain, and digital assets. Our content is created by experienced researchers and analysts who follow strict editorial standards focused on accuracy, transparency, and credibility. Every article is carefully reviewed and verified using trusted sources and current market data. We provide unbiased analysis and timely updates covering everything from emerging crypto projects to major industry developments.